Beaver County, UT
Beaver County Map
Beaver County Overview
7,102
TOTAL POPULATION
3,814
MALE POPULATION
3,288
FEMALE POPULATION
116.00
MALES / 100 FEMALES
86.21
FEMALES / 100 MALES
33.8
MEDIAN AGE
3.4
AVG FAMILY SIZE
3.0
AVG HOUSEHOLD SIZE
$28,176
PER CAPITA INCOME
$86,524
AVG FAMILY INCOME
$80,268
AVG HOUSEHOLD INCOME
53.9%
WAGE / INCOME GAP [ % ]
46.1¢/ $1
WAGE / INCOME GAP [ $ ]
0.33
INEQUALITY / GINI INDEX
3,183
LABOR FORCE [ PEOPLE ]
61.5%
PERCENT IN LABOR FORCE
3.6%
UNEMPLOYMENT RATE
Beaver County Area Codes
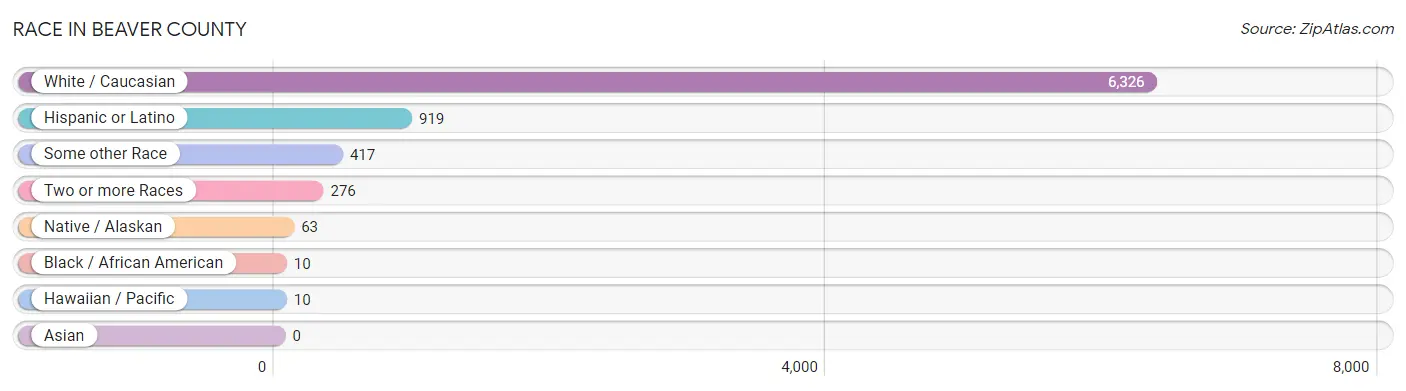
Race in Beaver County
The most populous races in Beaver County are White / Caucasian (6,326 | 89.1%), Hispanic or Latino (919 | 12.9%), and Some other Race (417 | 5.9%).
| Race | # Population | % Population |
| Asian | 0 | 0.0% |
| Black / African American | 10 | 0.1% |
| Hawaiian / Pacific | 10 | 0.1% |
| Hispanic or Latino | 919 | 12.9% |
| Native / Alaskan | 63 | 0.9% |
| White / Caucasian | 6,326 | 89.1% |
| Two or more Races | 276 | 3.9% |
| Some other Race | 417 | 5.9% |
| Total | 7,102 | 100.0% |
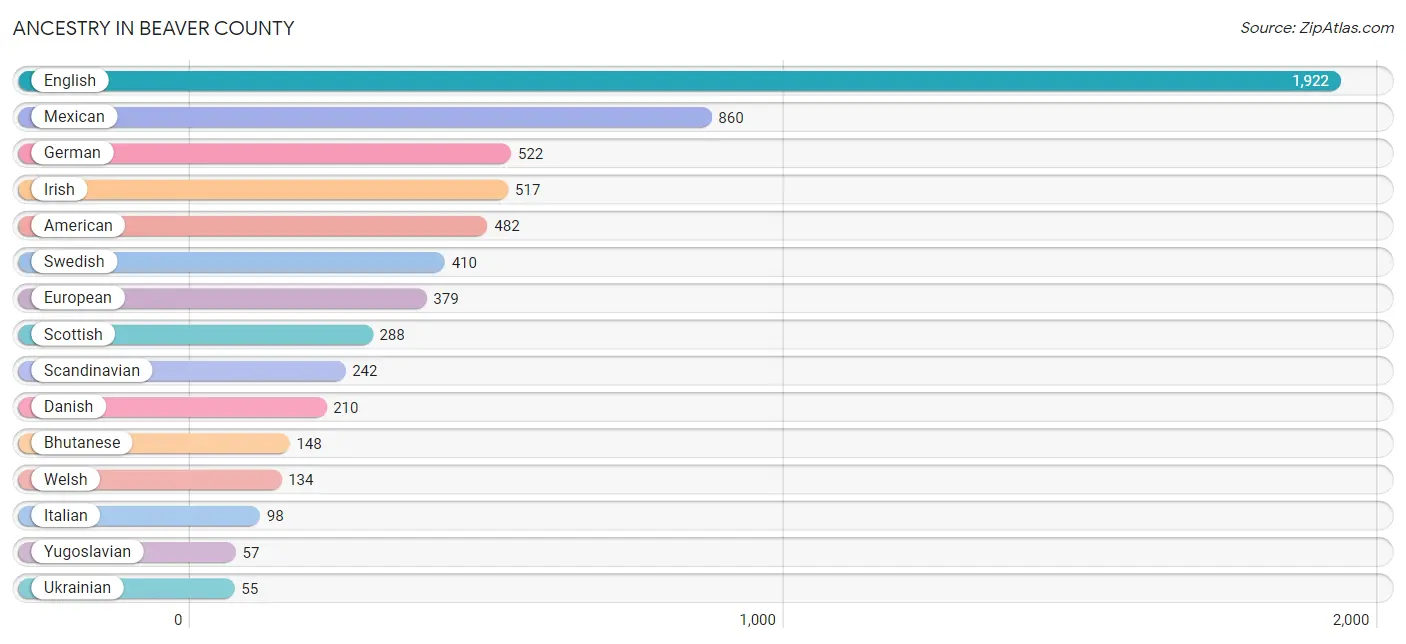
Ancestry in Beaver County
The most populous ancestries reported in Beaver County are English (1,922 | 27.1%), Mexican (860 | 12.1%), German (522 | 7.3%), Irish (517 | 7.3%), and American (482 | 6.8%), together accounting for 60.6% of all Beaver County residents.
| Ancestry | # Population | % Population |
| American | 482 | 6.8% |
| Apache | 36 | 0.5% |
| Bhutanese | 148 | 2.1% |
| British | 47 | 0.7% |
| Canadian | 52 | 0.7% |
| Central American | 14 | 0.2% |
| Cherokee | 3 | 0.0% |
| Comanche | 6 | 0.1% |
| Czechoslovakian | 14 | 0.2% |
| Danish | 210 | 3.0% |
| Dutch | 41 | 0.6% |
| Eastern European | 13 | 0.2% |
| English | 1,922 | 27.1% |
| European | 379 | 5.3% |
| French | 27 | 0.4% |
| French Canadian | 11 | 0.2% |
| German | 522 | 7.3% |
| Greek | 11 | 0.2% |
| Irish | 517 | 7.3% |
| Italian | 98 | 1.4% |
| Mexican | 860 | 12.1% |
| Navajo | 48 | 0.7% |
| Nicaraguan | 5 | 0.1% |
| Northern European | 44 | 0.6% |
| Norwegian | 40 | 0.6% |
| Polish | 19 | 0.3% |
| Portuguese | 4 | 0.1% |
| Puerto Rican | 18 | 0.3% |
| Salvadoran | 9 | 0.1% |
| Scandinavian | 242 | 3.4% |
| Scotch-Irish | 39 | 0.5% |
| Scottish | 288 | 4.1% |
| Spaniard | 16 | 0.2% |
| Swedish | 410 | 5.8% |
| Ukrainian | 55 | 0.8% |
| Welsh | 134 | 1.9% |
| Yugoslavian | 57 | 0.8% | View All 37 Rows |
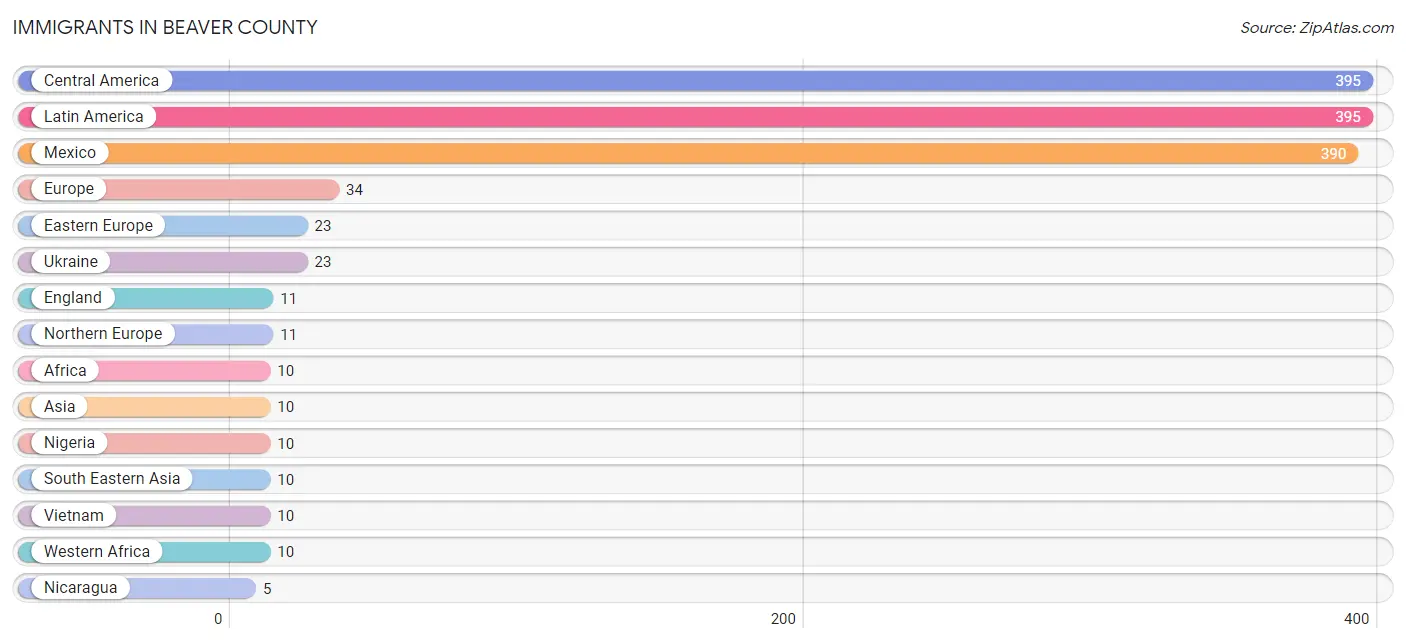
Immigrants in Beaver County
The most numerous immigrant groups reported in Beaver County came from Central America (395 | 5.6%), Latin America (395 | 5.6%), Mexico (390 | 5.5%), Europe (34 | 0.5%), and Eastern Europe (23 | 0.3%), together accounting for 17.4% of all Beaver County residents.
| Immigration Origin | # Population | % Population |
| Africa | 10 | 0.1% |
| Asia | 10 | 0.1% |
| Central America | 395 | 5.6% |
| Eastern Europe | 23 | 0.3% |
| England | 11 | 0.2% |
| Europe | 34 | 0.5% |
| Latin America | 395 | 5.6% |
| Mexico | 390 | 5.5% |
| Nicaragua | 5 | 0.1% |
| Nigeria | 10 | 0.1% |
| Northern Europe | 11 | 0.2% |
| South Eastern Asia | 10 | 0.1% |
| Ukraine | 23 | 0.3% |
| Vietnam | 10 | 0.1% |
| Western Africa | 10 | 0.1% | View All 15 Rows |
Sex and Age in Beaver County
Sex and Age in Beaver County
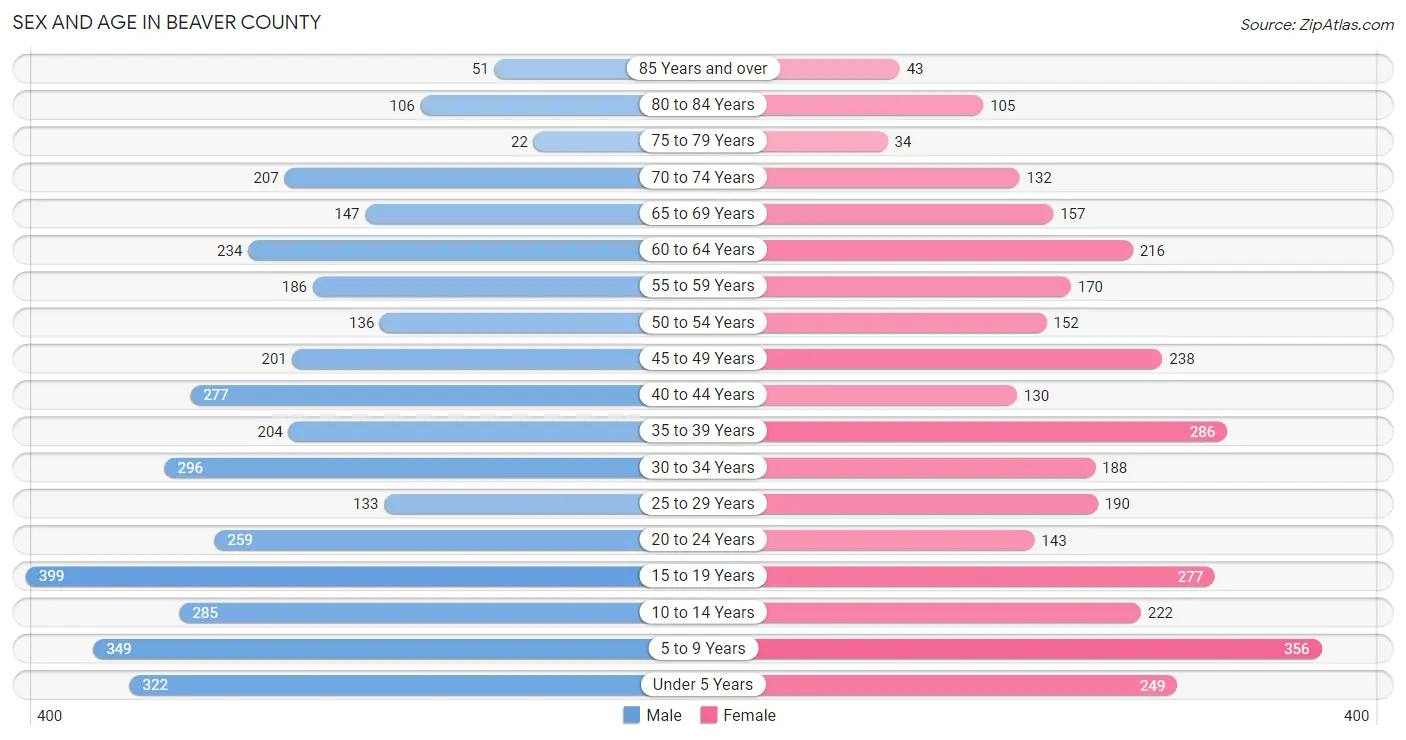
The most populous age groups in Beaver County are 15 to 19 Years (399 | 10.5%) for men and 5 to 9 Years (356 | 10.8%) for women.
| Age Bracket | Male | Female |
| Under 5 Years | 322 (8.4%) | 249 (7.6%) |
| 5 to 9 Years | 349 (9.1%) | 356 (10.8%) |
| 10 to 14 Years | 285 (7.5%) | 222 (6.8%) |
| 15 to 19 Years | 399 (10.5%) | 277 (8.4%) |
| 20 to 24 Years | 259 (6.8%) | 143 (4.3%) |
| 25 to 29 Years | 133 (3.5%) | 190 (5.8%) |
| 30 to 34 Years | 296 (7.8%) | 188 (5.7%) |
| 35 to 39 Years | 204 (5.3%) | 286 (8.7%) |
| 40 to 44 Years | 277 (7.3%) | 130 (4.0%) |
| 45 to 49 Years | 201 (5.3%) | 238 (7.2%) |
| 50 to 54 Years | 136 (3.6%) | 152 (4.6%) |
| 55 to 59 Years | 186 (4.9%) | 170 (5.2%) |
| 60 to 64 Years | 234 (6.1%) | 216 (6.6%) |
| 65 to 69 Years | 147 (3.8%) | 157 (4.8%) |
| 70 to 74 Years | 207 (5.4%) | 132 (4.0%) |
| 75 to 79 Years | 22 (0.6%) | 34 (1.0%) |
| 80 to 84 Years | 106 (2.8%) | 105 (3.2%) |
| 85 Years and over | 51 (1.3%) | 43 (1.3%) |
| Total | 3,814 (100.0%) | 3,288 (100.0%) |
Families and Households in Beaver County
Median Family Size in Beaver County
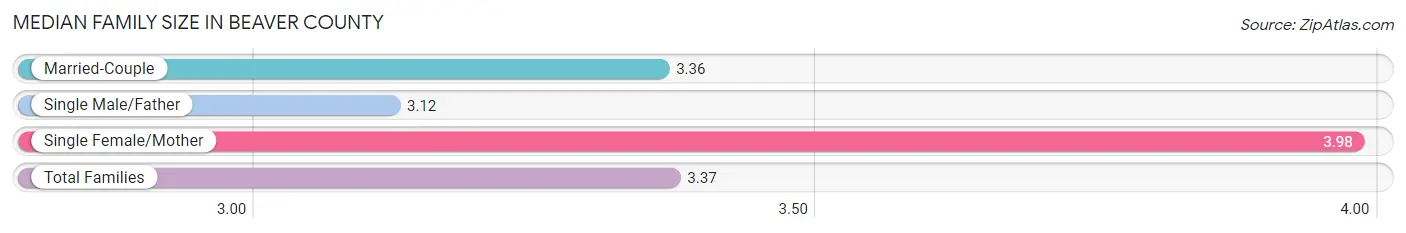
The median family size in Beaver County is 3.37 persons per family, with single female/mother families (80 | 4.2%) accounting for the largest median family size of 3.98 persons per family. On the other hand, single male/father families (114 | 6.0%) represent the smallest median family size with 3.12 persons per family.
| Family Type | # Families | Family Size |
| Married-Couple | 1,694 (89.7%) | 3.36 |
| Single Male/Father | 114 (6.0%) | 3.12 |
| Single Female/Mother | 80 (4.2%) | 3.98 |
| Total Families | 1,888 (100.0%) | 3.37 |
Median Household Size in Beaver County
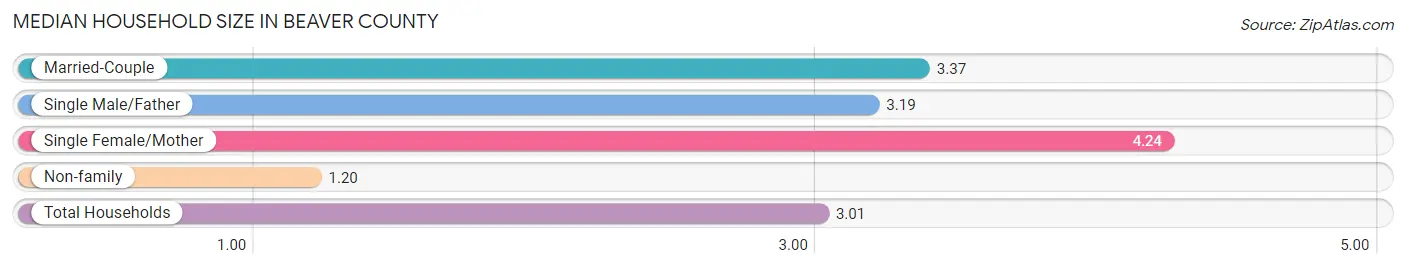
The median household size in Beaver County is 3.01 persons per household, with single female/mother households (80 | 3.5%) accounting for the largest median household size of 4.24 persons per household. non-family households (402 | 17.5%) represent the smallest median household size with 1.20 persons per household.
| Household Type | # Households | Household Size |
| Married-Couple | 1,694 (74.0%) | 3.37 |
| Single Male/Father | 114 (5.0%) | 3.19 |
| Single Female/Mother | 80 (3.5%) | 4.24 |
| Non-family | 402 (17.5%) | 1.20 |
| Total Households | 2,290 (100.0%) | 3.01 |
Household Size by Marriage Status in Beaver County
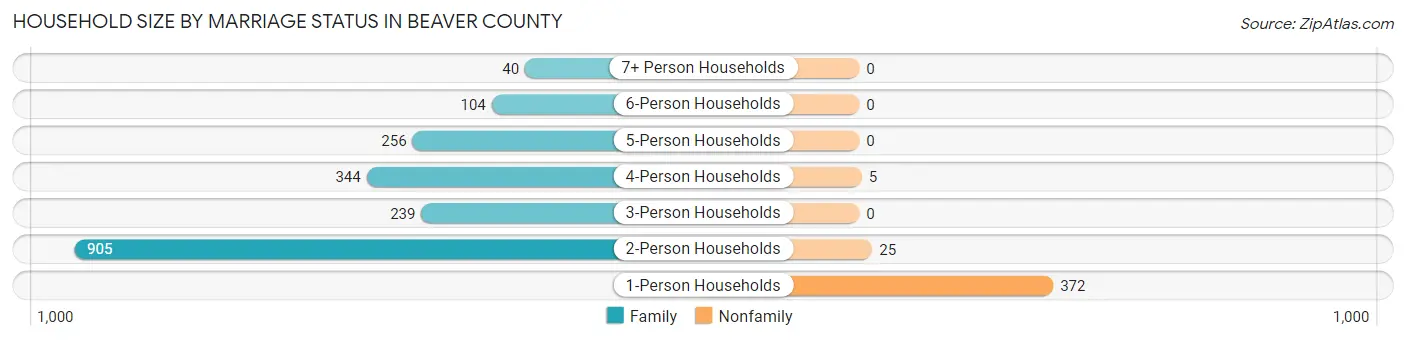
Out of a total of 2,290 households in Beaver County, 1,888 (82.5%) are family households, while 402 (17.5%) are nonfamily households. The most numerous type of family households are 2-person households, comprising 905, and the most common type of nonfamily households are 1-person households, comprising 372.
| Household Size | Family Households | Nonfamily Households |
| 1-Person Households | - | 372 (16.2%) |
| 2-Person Households | 905 (39.5%) | 25 (1.1%) |
| 3-Person Households | 239 (10.4%) | 0 (0.0%) |
| 4-Person Households | 344 (15.0%) | 5 (0.2%) |
| 5-Person Households | 256 (11.2%) | 0 (0.0%) |
| 6-Person Households | 104 (4.5%) | 0 (0.0%) |
| 7+ Person Households | 40 (1.8%) | 0 (0.0%) |
| Total | 1,888 (82.5%) | 402 (17.5%) |
Female Fertility in Beaver County
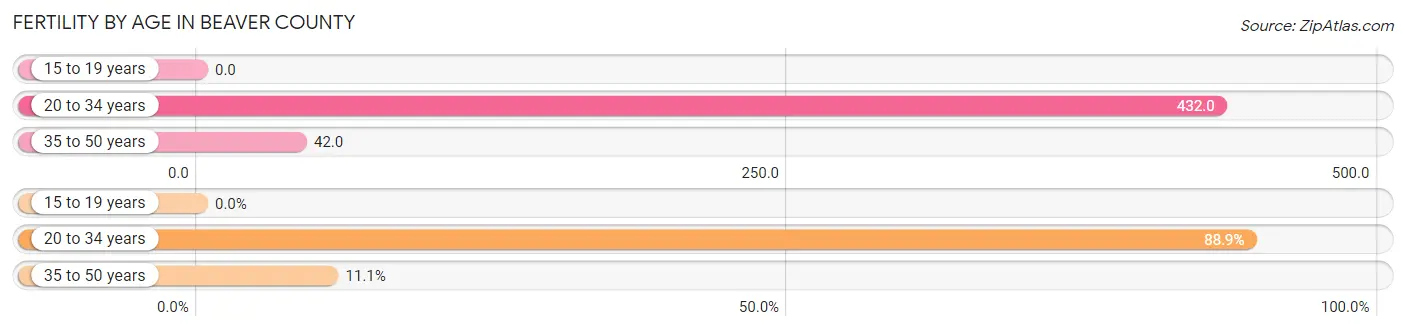
Fertility by Age in Beaver County
Average fertility rate in Beaver County is 173.0 births per 1,000 women. Women in the age bracket of 20 to 34 years have the highest fertility rate with 432.0 births per 1,000 women. Women in the age bracket of 20 to 34 years acount for 88.9% of all women with births.
| Age Bracket | Women with Births | Births / 1,000 Women |
| 15 to 19 years | 0 (0.0%) | 0.0 |
| 20 to 34 years | 225 (88.9%) | 432.0 |
| 35 to 50 years | 28 (11.1%) | 42.0 |
| Total | 253 (100.0%) | 173.0 |
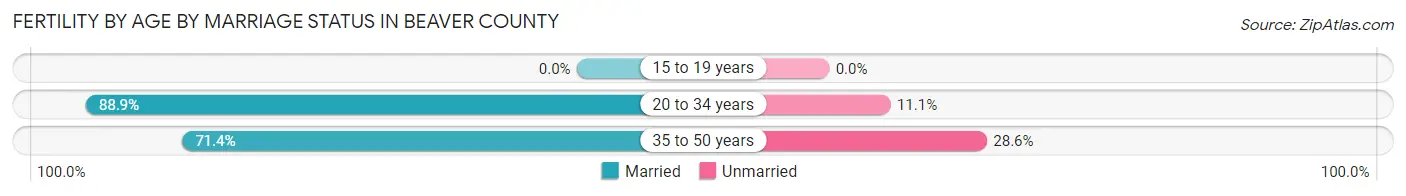
Fertility by Age by Marriage Status in Beaver County
87.0% of women with births (253) in Beaver County are married. The highest percentage of unmarried women with births falls into 35 to 50 years age bracket with 28.6% of them unmarried at the time of birth, while the lowest percentage of unmarried women with births belong to 20 to 34 years age bracket with 11.1% of them unmarried.
| Age Bracket | Married | Unmarried |
| 15 to 19 years | 0 (0.0%) | 0 (0.0%) |
| 20 to 34 years | 200 (88.9%) | 25 (11.1%) |
| 35 to 50 years | 20 (71.4%) | 8 (28.6%) |
| Total | 220 (87.0%) | 33 (13.0%) |
Fertility by Education in Beaver County
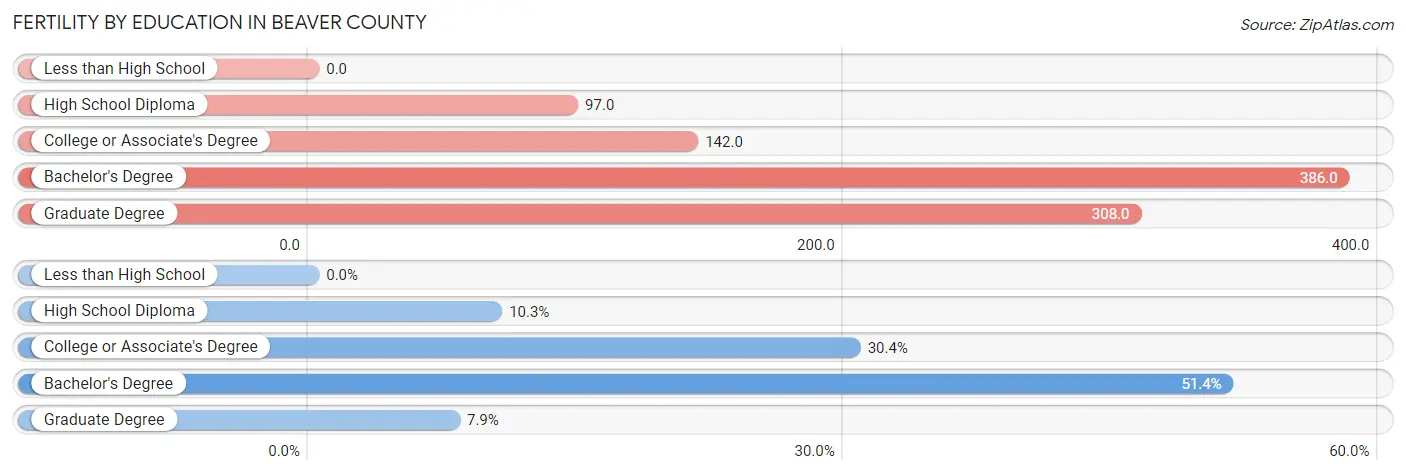
| Educational Attainment | Women with Births | Births / 1,000 Women |
| Less than High School | 0 (0.0%) | 0.0 |
| High School Diploma | 26 (10.3%) | 97.0 |
| College or Associate's Degree | 77 (30.4%) | 142.0 |
| Bachelor's Degree | 130 (51.4%) | 386.0 |
| Graduate Degree | 20 (7.9%) | 308.0 |
| Total | 253 (100.0%) | 173.0 |
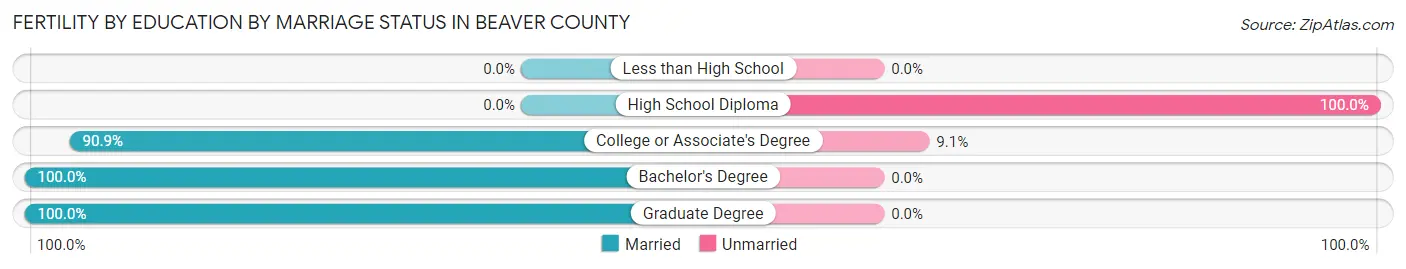
Fertility by Education by Marriage Status in Beaver County
13.0% of women with births in Beaver County are unmarried. Women with the educational attainment of bachelor's degree are most likely to be married with 100.0% of them married at childbirth, while women with the educational attainment of high school diploma are least likely to be married with 100.0% of them unmarried at childbirth.
| Educational Attainment | Married | Unmarried |
| Less than High School | 0 (0.0%) | 0 (0.0%) |
| High School Diploma | 0 (0.0%) | 26 (100.0%) |
| College or Associate's Degree | 70 (90.9%) | 7 (9.1%) |
| Bachelor's Degree | 130 (100.0%) | 0 (0.0%) |
| Graduate Degree | 20 (100.0%) | 0 (0.0%) |
| Total | 220 (87.0%) | 33 (13.0%) |
Income in Beaver County
Income Overview in Beaver County
Per Capita Income in Beaver County is $28,176, while median incomes of families and households are $86,524 and $80,268 respectively.
| Characteristic | Number | Measure |
| Per Capita Income | 7,102 | $28,176 |
| Median Family Income | 1,888 | $86,524 |
| Mean Family Income | 1,888 | $93,877 |
| Median Household Income | 2,290 | $80,268 |
| Mean Household Income | 2,290 | $86,270 |
| Income Deficit | 1,888 | $0 |
| Wage / Income Gap (%) | 7,102 | 53.88% |
| Wage / Income Gap ($) | 7,102 | 46.12¢ per $1 |
| Gini / Inequality Index | 7,102 | 0.33 |
Earnings by Sex in Beaver County
Average Earnings in Beaver County are $42,639, $58,646 for men and $27,045 for women, a difference of 53.9%.
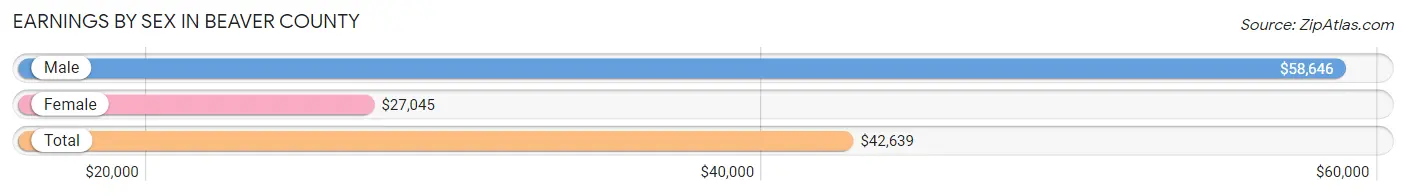
| Sex | Number | Average Earnings |
| Male | 1,930 (55.4%) | $58,646 |
| Female | 1,556 (44.6%) | $27,045 |
| Total | 3,486 (100.0%) | $42,639 |
Earnings by Sex by Income Bracket in Beaver County
The most common earnings brackets in Beaver County are $55,000 to $64,999 for men (291 | 15.1%) and $55,000 to $64,999 for women (247 | 15.9%).
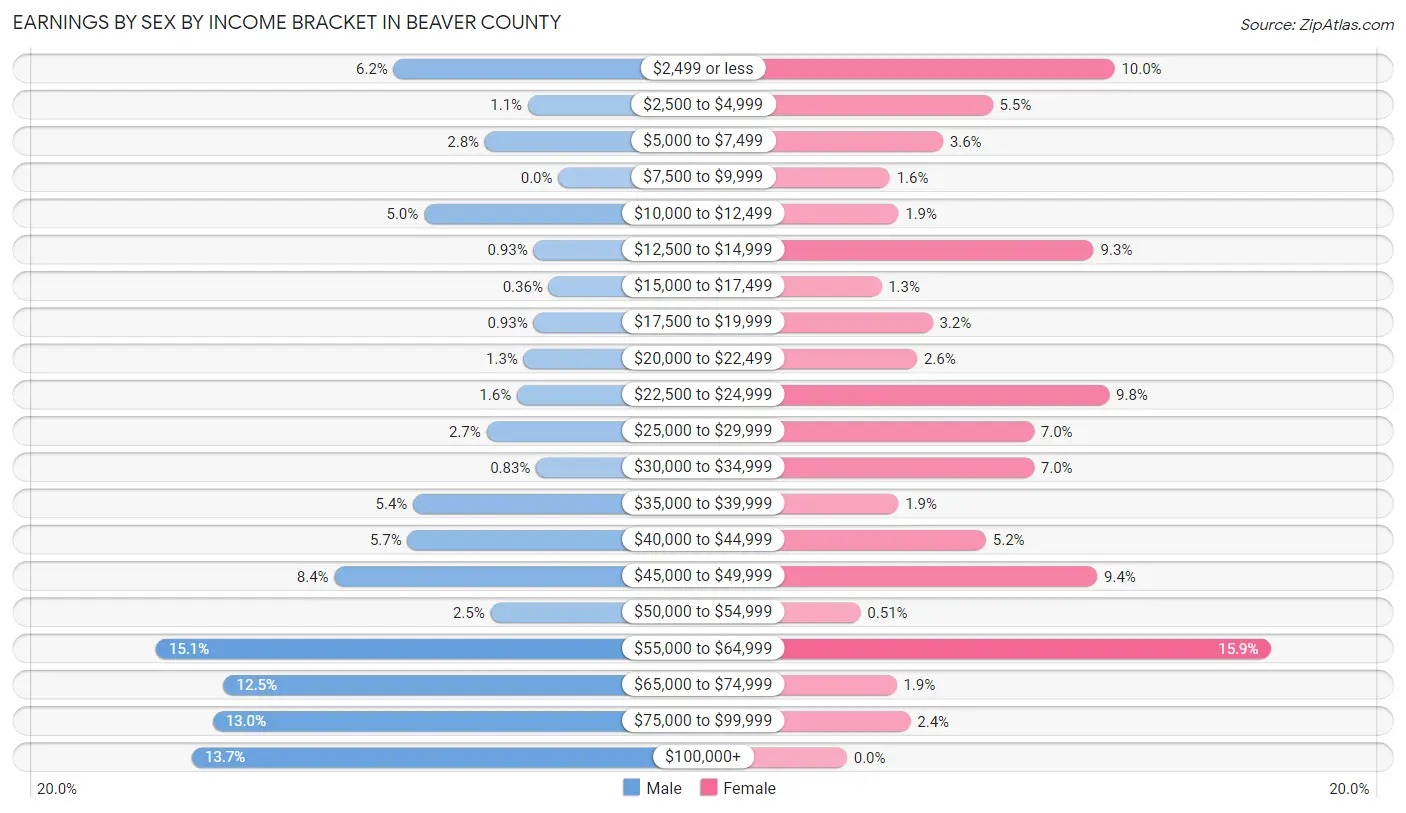
| Income | Male | Female |
| $2,499 or less | 119 (6.2%) | 156 (10.0%) |
| $2,500 to $4,999 | 22 (1.1%) | 85 (5.5%) |
| $5,000 to $7,499 | 53 (2.8%) | 56 (3.6%) |
| $7,500 to $9,999 | 0 (0.0%) | 25 (1.6%) |
| $10,000 to $12,499 | 97 (5.0%) | 30 (1.9%) |
| $12,500 to $14,999 | 18 (0.9%) | 144 (9.2%) |
| $15,000 to $17,499 | 7 (0.4%) | 20 (1.3%) |
| $17,500 to $19,999 | 18 (0.9%) | 50 (3.2%) |
| $20,000 to $22,499 | 25 (1.3%) | 41 (2.6%) |
| $22,500 to $24,999 | 30 (1.5%) | 153 (9.8%) |
| $25,000 to $29,999 | 52 (2.7%) | 109 (7.0%) |
| $30,000 to $34,999 | 16 (0.8%) | 109 (7.0%) |
| $35,000 to $39,999 | 105 (5.4%) | 30 (1.9%) |
| $40,000 to $44,999 | 109 (5.7%) | 81 (5.2%) |
| $45,000 to $49,999 | 162 (8.4%) | 146 (9.4%) |
| $50,000 to $54,999 | 49 (2.5%) | 8 (0.5%) |
| $55,000 to $64,999 | 291 (15.1%) | 247 (15.9%) |
| $65,000 to $74,999 | 242 (12.5%) | 29 (1.9%) |
| $75,000 to $99,999 | 250 (13.0%) | 37 (2.4%) |
| $100,000+ | 265 (13.7%) | 0 (0.0%) |
| Total | 1,930 (100.0%) | 1,556 (100.0%) |
Earnings by Sex by Educational Attainment in Beaver County
Average earnings in Beaver County are $63,532 for men and $29,187 for women, a difference of 54.1%. Men with an educational attainment of graduate degree enjoy the highest average annual earnings of $66,618, while those with high school diploma education earn the least with $55,926. Women with an educational attainment of graduate degree earn the most with the average annual earnings of $64,500, while those with college or associate's degree education have the smallest earnings of $23,077.
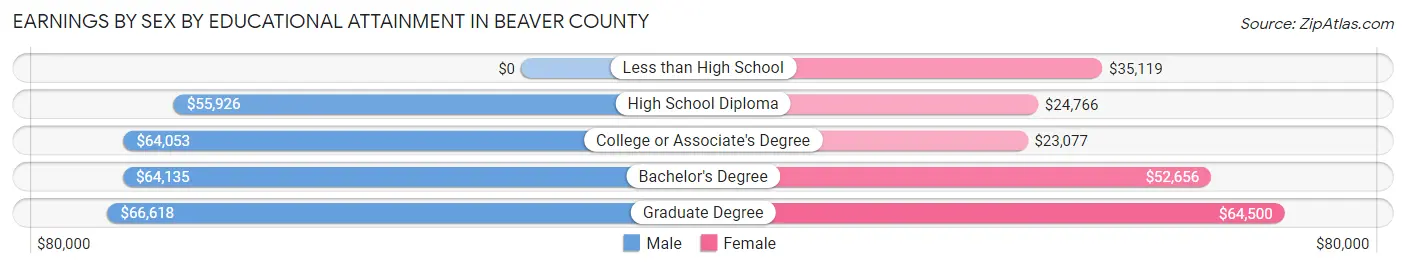
| Educational Attainment | Male Income | Female Income |
| Less than High School | - | - |
| High School Diploma | $55,926 | $24,766 |
| College or Associate's Degree | $64,053 | $23,077 |
| Bachelor's Degree | $64,135 | $52,656 |
| Graduate Degree | $66,618 | $64,500 |
| Total | $63,532 | $29,187 |
Family Income in Beaver County
Family Income Brackets in Beaver County
According to the Beaver County family income data, there are 610 families falling into the $100,000 to $149,999 income range, which is the most common income bracket and makes up 32.3% of all families. Conversely, the $10,000 to $14,999 income bracket is the least frequent group with only 6 families (0.3%) belonging to this category.
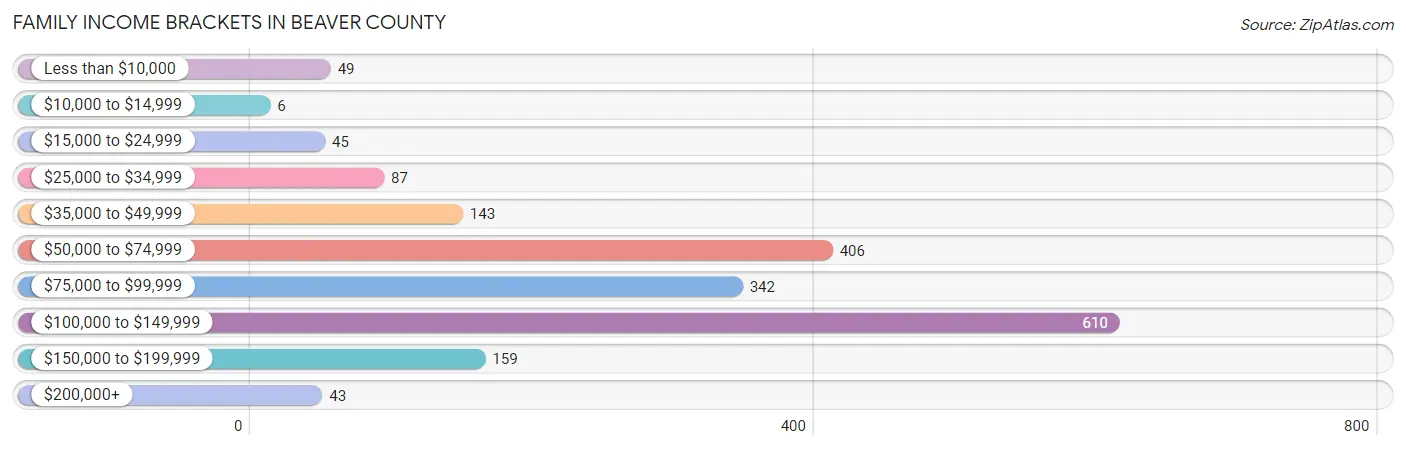
| Income Bracket | # Families | % Families |
| Less than $10,000 | 49 | 2.6% |
| $10,000 to $14,999 | 6 | 0.3% |
| $15,000 to $24,999 | 45 | 2.4% |
| $25,000 to $34,999 | 87 | 4.6% |
| $35,000 to $49,999 | 143 | 7.6% |
| $50,000 to $74,999 | 406 | 21.5% |
| $75,000 to $99,999 | 342 | 18.1% |
| $100,000 to $149,999 | 610 | 32.3% |
| $150,000 to $199,999 | 159 | 8.4% |
| $200,000+ | 43 | 2.3% |
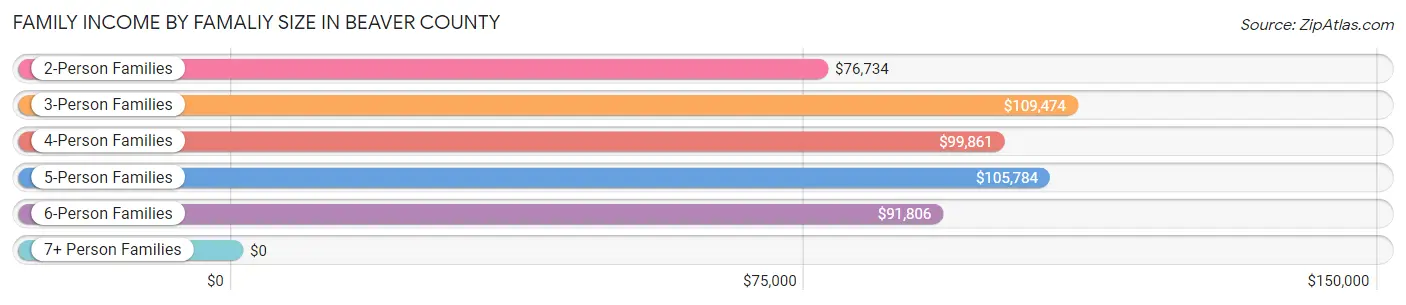
Family Income by Famaliy Size in Beaver County
3-person families (244 | 12.9%) account for the highest median family income in Beaver County with $109,474 per family, while 2-person families (913 | 48.4%) have the highest median income of $38,367 per family member.
| Income Bracket | # Families | Median Income |
| 2-Person Families | 913 (48.4%) | $76,734 |
| 3-Person Families | 244 (12.9%) | $109,474 |
| 4-Person Families | 343 (18.2%) | $99,861 |
| 5-Person Families | 244 (12.9%) | $105,784 |
| 6-Person Families | 104 (5.5%) | $91,806 |
| 7+ Person Families | 40 (2.1%) | $0 |
| Total | 1,888 (100.0%) | $86,524 |
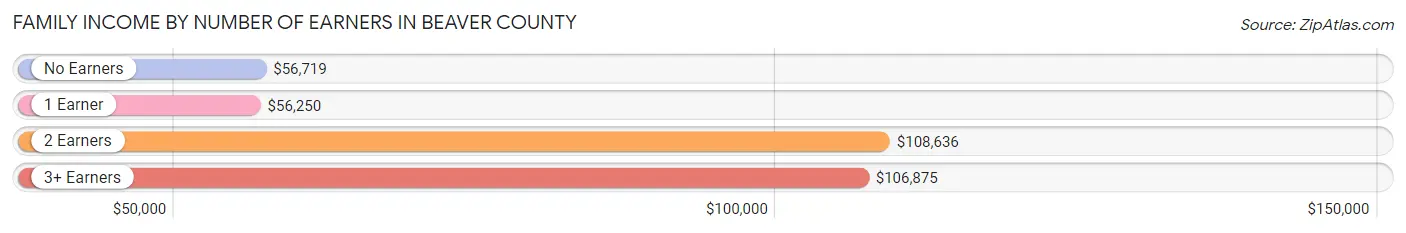
Family Income by Number of Earners in Beaver County
The median family income in Beaver County is $86,524, with families comprising 2 earners (1,028) having the highest median family income of $108,636, while families with 1 earner (333) have the lowest median family income of $56,250, accounting for 54.4% and 17.6% of families, respectively.
| Number of Earners | # Families | Median Income |
| No Earners | 350 (18.5%) | $56,719 |
| 1 Earner | 333 (17.6%) | $56,250 |
| 2 Earners | 1,028 (54.4%) | $108,636 |
| 3+ Earners | 177 (9.4%) | $106,875 |
| Total | 1,888 (100.0%) | $86,524 |
Household Income in Beaver County
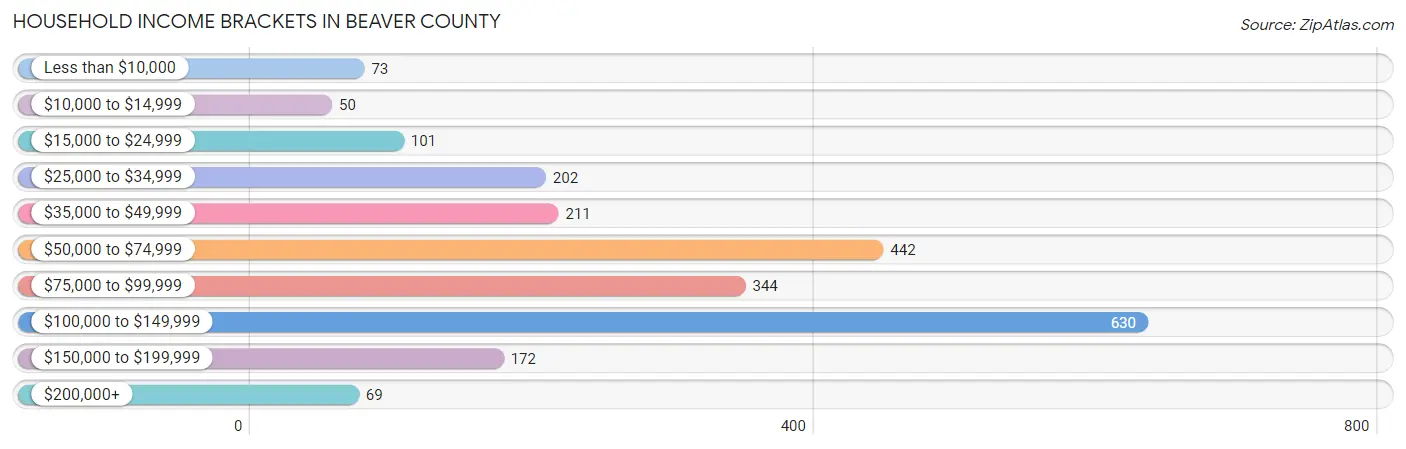
Household Income Brackets in Beaver County
With 630 households falling in the category, the $100,000 to $149,999 income range is the most frequent in Beaver County, accounting for 27.5% of all households. In contrast, only 50 households (2.2%) fall into the $10,000 to $14,999 income bracket, making it the least populous group.
| Income Bracket | # Households | % Households |
| Less than $10,000 | 73 | 3.2% |
| $10,000 to $14,999 | 50 | 2.2% |
| $15,000 to $24,999 | 101 | 4.4% |
| $25,000 to $34,999 | 202 | 8.8% |
| $35,000 to $49,999 | 211 | 9.2% |
| $50,000 to $74,999 | 442 | 19.3% |
| $75,000 to $99,999 | 344 | 15.0% |
| $100,000 to $149,999 | 630 | 27.5% |
| $150,000 to $199,999 | 172 | 7.5% |
| $200,000+ | 69 | 3.0% |
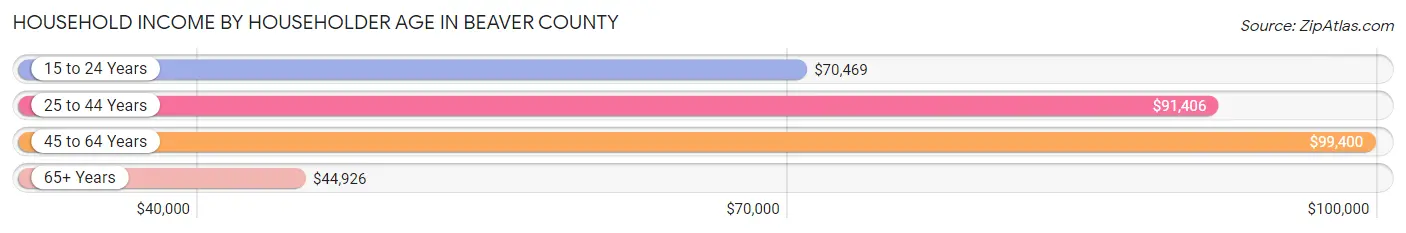
Household Income by Householder Age in Beaver County
The median household income in Beaver County is $80,268, with the highest median household income of $99,400 found in the 45 to 64 years age bracket for the primary householder. A total of 854 households (37.3%) fall into this category. Meanwhile, the 65+ years age bracket for the primary householder has the lowest median household income of $44,926, with 587 households (25.6%) in this group.
| Income Bracket | # Households | Median Income |
| 15 to 24 Years | 68 (3.0%) | $70,469 |
| 25 to 44 Years | 781 (34.1%) | $91,406 |
| 45 to 64 Years | 854 (37.3%) | $99,400 |
| 65+ Years | 587 (25.6%) | $44,926 |
| Total | 2,290 (100.0%) | $80,268 |
Poverty in Beaver County
Income Below Poverty by Sex and Age in Beaver County
With 7.1% poverty level for males and 6.9% for females among the residents of Beaver County, 18 to 24 year old males and 5 year old females are the most vulnerable to poverty, with 69 males (16.3%) and 27 females (40.9%) in their respective age groups living below the poverty level.
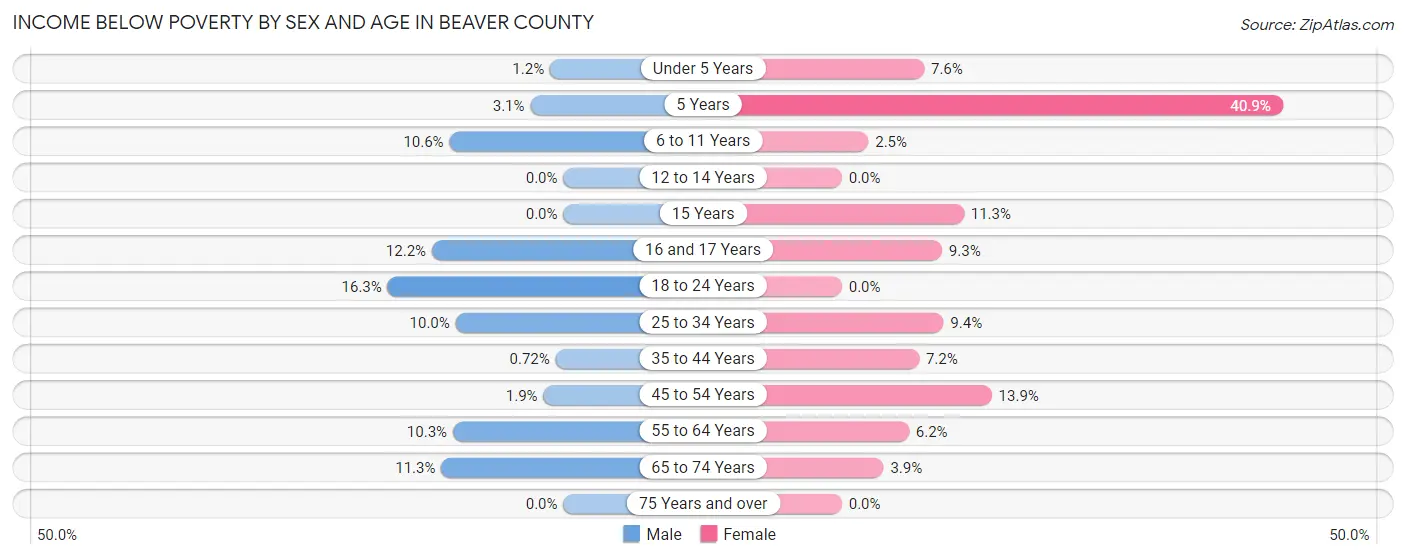
| Age Bracket | Male | Female |
| Under 5 Years | 4 (1.2%) | 19 (7.6%) |
| 5 Years | 3 (3.1%) | 27 (40.9%) |
| 6 to 11 Years | 39 (10.6%) | 8 (2.5%) |
| 12 to 14 Years | 0 (0.0%) | 0 (0.0%) |
| 15 Years | 0 (0.0%) | 6 (11.3%) |
| 16 and 17 Years | 15 (12.2%) | 13 (9.3%) |
| 18 to 24 Years | 69 (16.3%) | 0 (0.0%) |
| 25 to 34 Years | 40 (10.0%) | 35 (9.4%) |
| 35 to 44 Years | 3 (0.7%) | 29 (7.2%) |
| 45 to 54 Years | 6 (1.8%) | 53 (13.9%) |
| 55 to 64 Years | 41 (10.2%) | 24 (6.2%) |
| 65 to 74 Years | 40 (11.3%) | 11 (3.9%) |
| 75 Years and over | 0 (0.0%) | 0 (0.0%) |
| Total | 260 (7.1%) | 225 (6.9%) |
Income Above Poverty by Sex and Age in Beaver County
According to the poverty statistics in Beaver County, males aged 12 to 14 years and females aged 12 to 14 years are the age groups that are most secure financially, with 100.0% of males and 100.0% of females in these age groups living above the poverty line.
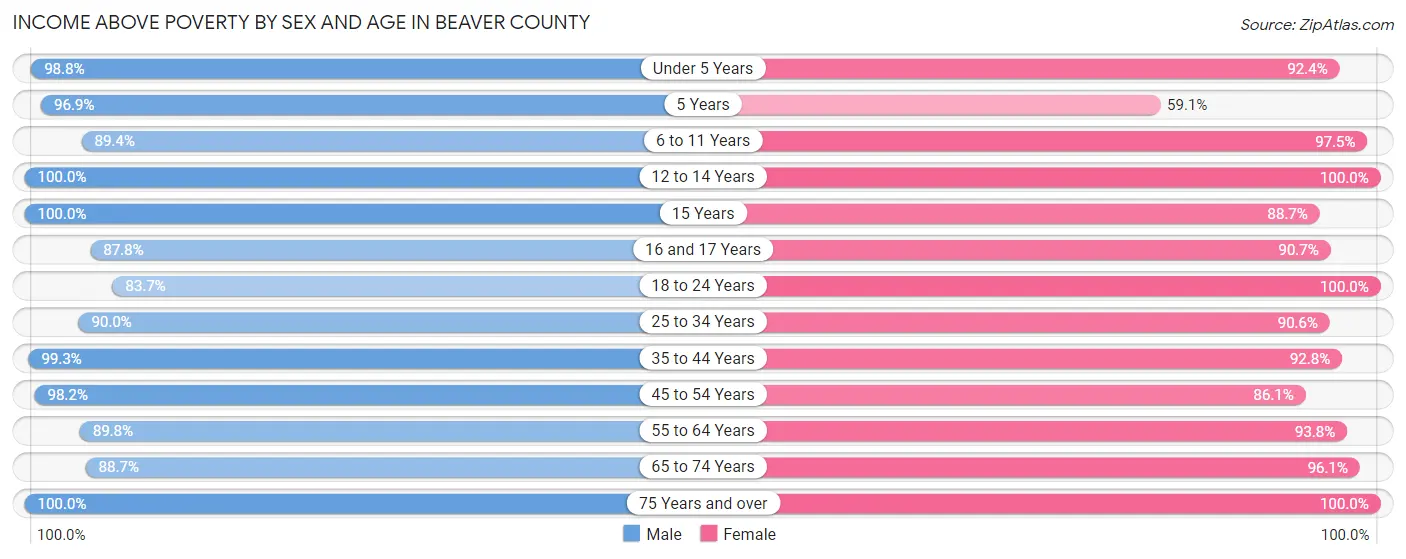
| Age Bracket | Male | Female |
| Under 5 Years | 318 (98.8%) | 230 (92.4%) |
| 5 Years | 95 (96.9%) | 39 (59.1%) |
| 6 to 11 Years | 330 (89.4%) | 317 (97.5%) |
| 12 to 14 Years | 164 (100.0%) | 187 (100.0%) |
| 15 Years | 90 (100.0%) | 47 (88.7%) |
| 16 and 17 Years | 108 (87.8%) | 127 (90.7%) |
| 18 to 24 Years | 354 (83.7%) | 227 (100.0%) |
| 25 to 34 Years | 360 (90.0%) | 336 (90.6%) |
| 35 to 44 Years | 411 (99.3%) | 376 (92.8%) |
| 45 to 54 Years | 318 (98.2%) | 328 (86.1%) |
| 55 to 64 Years | 359 (89.7%) | 362 (93.8%) |
| 65 to 74 Years | 313 (88.7%) | 273 (96.1%) |
| 75 Years and over | 164 (100.0%) | 180 (100.0%) |
| Total | 3,384 (92.9%) | 3,029 (93.1%) |
Income Below Poverty Among Married-Couple Families in Beaver County
The poverty statistics for married-couple families in Beaver County show that 2.6% or 44 of the total 1,694 families live below the poverty line. Families with 3 or 4 children have the highest poverty rate of 12.6%, comprising of 31 families. On the other hand, families with 5 or more children have the lowest poverty rate of 0.0%, which includes 0 families.
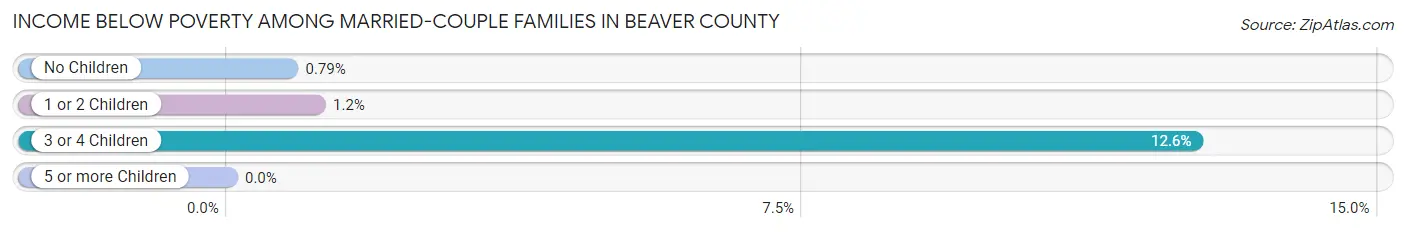
| Children | Above Poverty | Below Poverty |
| No Children | 881 (99.2%) | 7 (0.8%) |
| 1 or 2 Children | 514 (98.9%) | 6 (1.1%) |
| 3 or 4 Children | 215 (87.4%) | 31 (12.6%) |
| 5 or more Children | 40 (100.0%) | 0 (0.0%) |
| Total | 1,650 (97.4%) | 44 (2.6%) |
Income Below Poverty Among Single-Parent Households in Beaver County
According to the poverty data in Beaver County, 7.0% or 8 single-father households and 48.7% or 39 single-mother households are living below the poverty line. Among single-father households, those with 1 or 2 children have the highest poverty rate, with 8 households (11.9%) experiencing poverty. Likewise, among single-mother households, those with 3 or 4 children have the highest poverty rate, with 18 households (100.0%) falling below the poverty line.
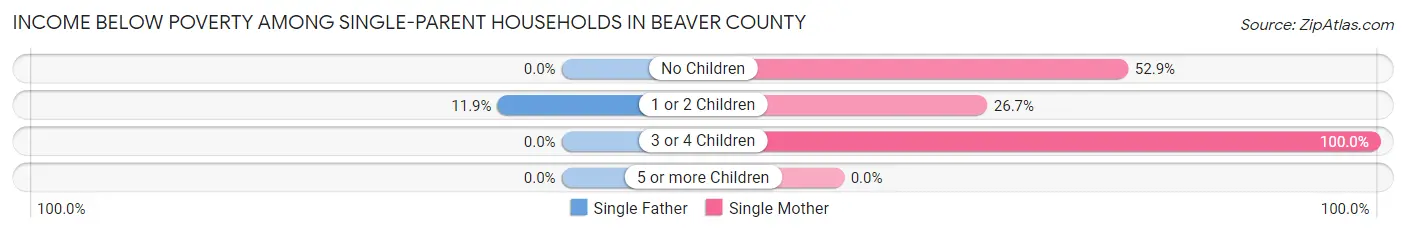
| Children | Single Father | Single Mother |
| No Children | 0 (0.0%) | 9 (52.9%) |
| 1 or 2 Children | 8 (11.9%) | 12 (26.7%) |
| 3 or 4 Children | 0 (0.0%) | 18 (100.0%) |
| 5 or more Children | 0 (0.0%) | 0 (0.0%) |
| Total | 8 (7.0%) | 39 (48.7%) |
Income Below Poverty Among Married-Couple vs Single-Parent Households in Beaver County
The poverty data for Beaver County shows that 44 of the married-couple family households (2.6%) and 47 of the single-parent households (24.2%) are living below the poverty level. Within the married-couple family households, those with 3 or 4 children have the highest poverty rate, with 31 households (12.6%) falling below the poverty line. Among the single-parent households, those with 3 or 4 children have the highest poverty rate, with 18 household (54.5%) living below poverty.
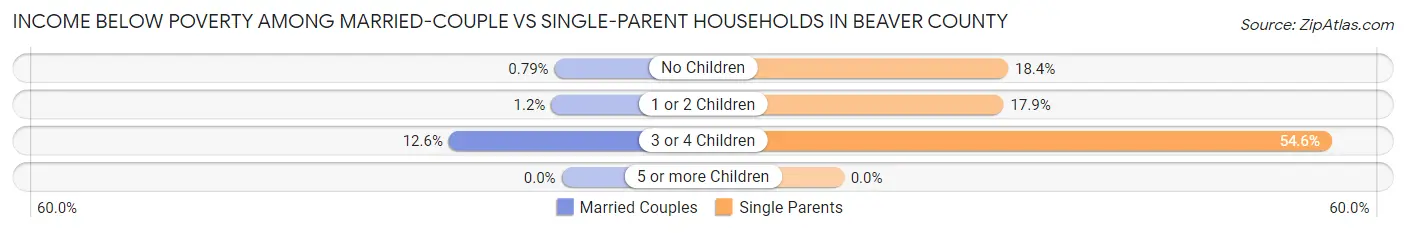
| Children | Married-Couple Families | Single-Parent Households |
| No Children | 7 (0.8%) | 9 (18.4%) |
| 1 or 2 Children | 6 (1.1%) | 20 (17.9%) |
| 3 or 4 Children | 31 (12.6%) | 18 (54.5%) |
| 5 or more Children | 0 (0.0%) | 0 (0.0%) |
| Total | 44 (2.6%) | 47 (24.2%) |
Employment Characteristics in Beaver County
Employment by Class of Employer in Beaver County
Among the 3,023 employed individuals in Beaver County, private company employees (1,778 | 58.8%), local government employees (382 | 12.6%), and self-employed (not incorporated) (308 | 10.2%) make up the most common classes of employment.
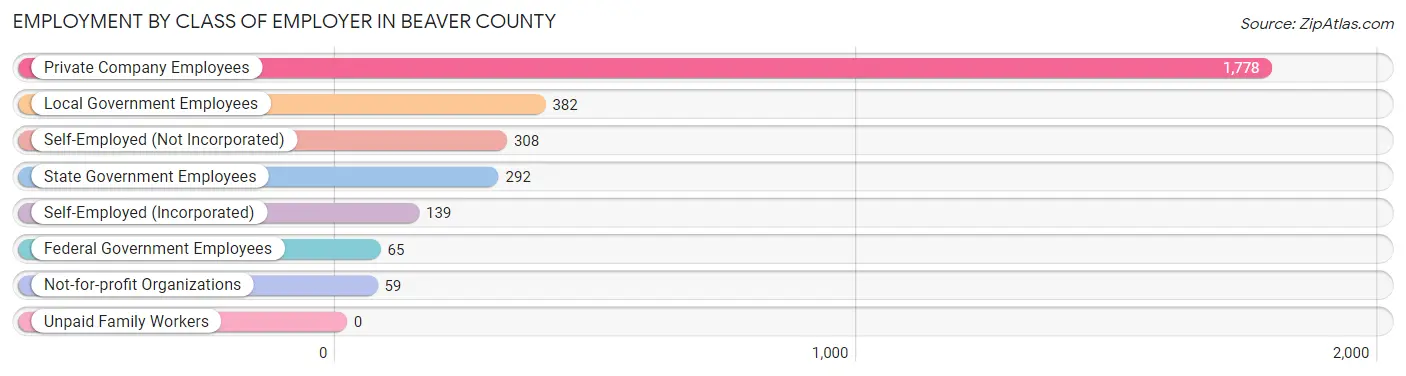
| Employer Class | # Employees | % Employees |
| Private Company Employees | 1,778 | 58.8% |
| Self-Employed (Incorporated) | 139 | 4.6% |
| Self-Employed (Not Incorporated) | 308 | 10.2% |
| Not-for-profit Organizations | 59 | 1.9% |
| Local Government Employees | 382 | 12.6% |
| State Government Employees | 292 | 9.7% |
| Federal Government Employees | 65 | 2.1% |
| Unpaid Family Workers | 0 | 0.0% |
| Total | 3,023 | 100.0% |
Employment Status by Age in Beaver County
According to the labor force statistics for Beaver County, out of the total population over 16 years of age (5,175), 61.5% or 3,183 individuals are in the labor force, with 3.6% or 115 of them unemployed. The age group with the highest labor force participation rate is 45 to 54 years, with 92.4% or 672 individuals in the labor force. Within the labor force, the 20 to 24 years age range has the highest percentage of unemployed individuals, with 20.7% or 62 of them being unemployed.
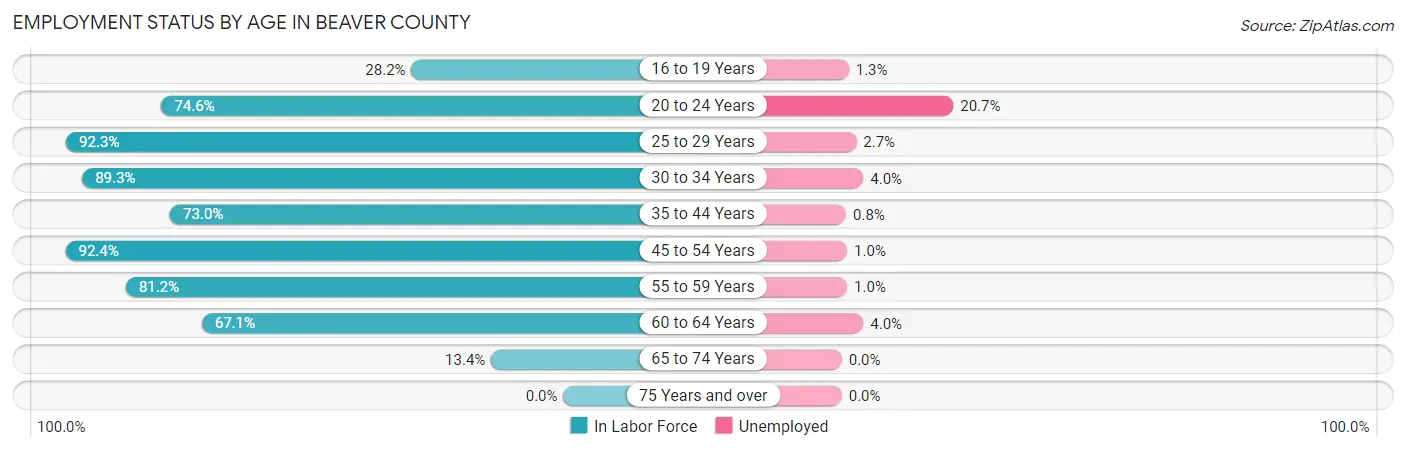
| Age Bracket | In Labor Force | Unemployed |
| 16 to 19 Years | 150 (28.2%) | 2 (1.3%) |
| 20 to 24 Years | 300 (74.6%) | 62 (20.7%) |
| 25 to 29 Years | 298 (92.3%) | 8 (2.7%) |
| 30 to 34 Years | 432 (89.3%) | 17 (4.0%) |
| 35 to 44 Years | 655 (73.0%) | 5 (0.8%) |
| 45 to 54 Years | 672 (92.4%) | 7 (1.0%) |
| 55 to 59 Years | 289 (81.2%) | 3 (1.0%) |
| 60 to 64 Years | 302 (67.1%) | 12 (4.0%) |
| 65 to 74 Years | 86 (13.4%) | 0 (0.0%) |
| 75 Years and over | 0 (0.0%) | 0 (0.0%) |
| Total | 3,183 (61.5%) | 115 (3.6%) |
Employment Status by Educational Attainment in Beaver County
According to labor force statistics for Beaver County, 81.8% of individuals (2,648) out of the total population between 25 and 64 years of age (3,237) are in the labor force, with 2.0% or 53 of them being unemployed. The group with the highest labor force participation rate are those with the educational attainment of bachelor's degree or higher, with 89.7% or 820 individuals in the labor force. Within the labor force, individuals with less than high school education have the highest percentage of unemployment, with 4.7% or 8 of them being unemployed.
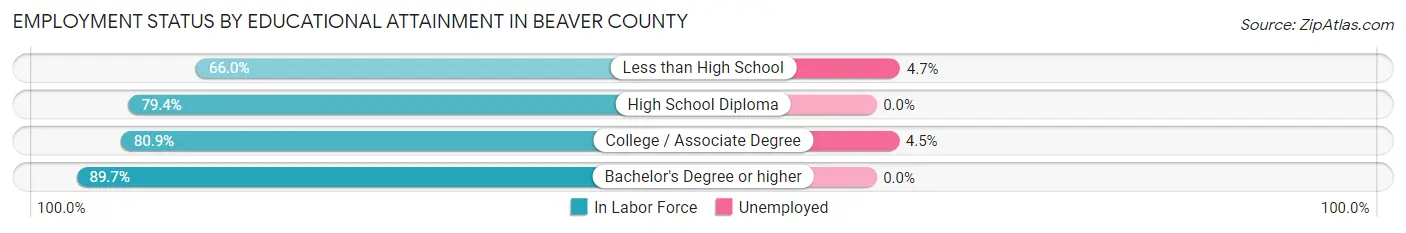
| Educational Attainment | In Labor Force | Unemployed |
| Less than High School | 169 (66.0%) | 12 (4.7%) |
| High School Diploma | 685 (79.4%) | 0 (0.0%) |
| College / Associate Degree | 974 (80.9%) | 54 (4.5%) |
| Bachelor's Degree or higher | 820 (89.7%) | 0 (0.0%) |
| Total | 2,648 (81.8%) | 65 (2.0%) |
Employment Occupations by Sex in Beaver County
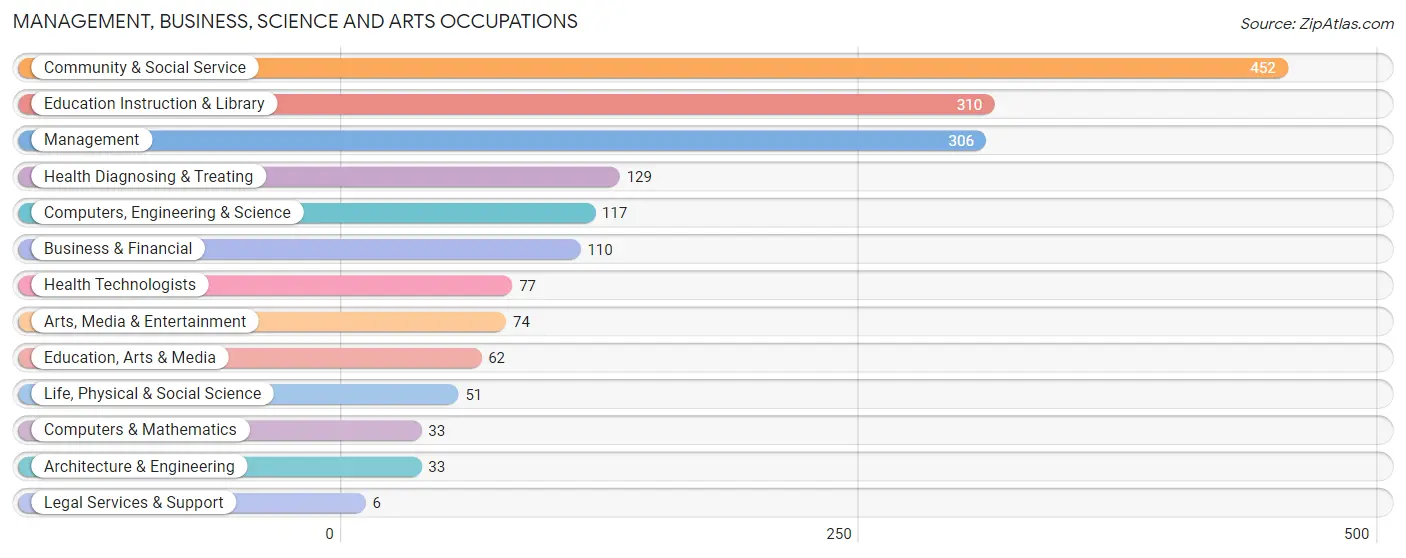
Management, Business, Science and Arts Occupations
The most common Management, Business, Science and Arts occupations in Beaver County are Community & Social Service (452 | 14.7%), Education Instruction & Library (310 | 10.1%), Management (306 | 10.0%), Health Diagnosing & Treating (129 | 4.2%), and Computers, Engineering & Science (117 | 3.8%).
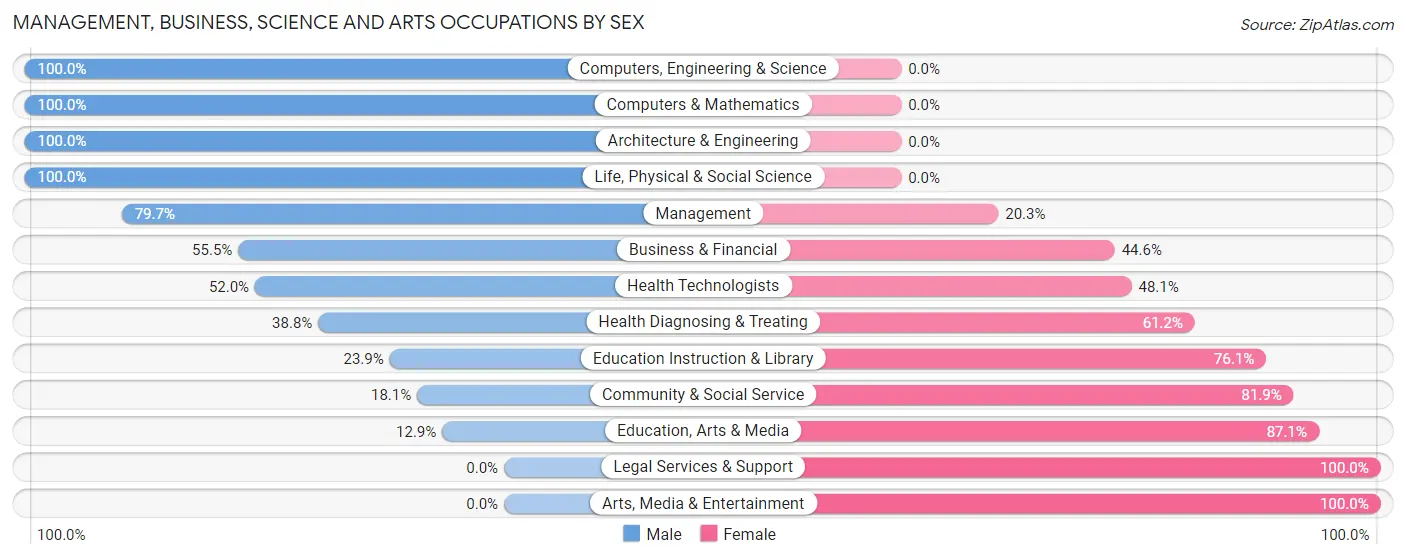
Management, Business, Science and Arts Occupations by Sex
Within the Management, Business, Science and Arts occupations in Beaver County, the most male-oriented occupations are Computers, Engineering & Science (100.0%), Computers & Mathematics (100.0%), and Architecture & Engineering (100.0%), while the most female-oriented occupations are Legal Services & Support (100.0%), Arts, Media & Entertainment (100.0%), and Education, Arts & Media (87.1%).
| Occupation | Male | Female |
| Management | 244 (79.7%) | 62 (20.3%) |
| Business & Financial | 61 (55.4%) | 49 (44.6%) |
| Computers, Engineering & Science | 117 (100.0%) | 0 (0.0%) |
| Computers & Mathematics | 33 (100.0%) | 0 (0.0%) |
| Architecture & Engineering | 33 (100.0%) | 0 (0.0%) |
| Life, Physical & Social Science | 51 (100.0%) | 0 (0.0%) |
| Community & Social Service | 82 (18.1%) | 370 (81.9%) |
| Education, Arts & Media | 8 (12.9%) | 54 (87.1%) |
| Legal Services & Support | 0 (0.0%) | 6 (100.0%) |
| Education Instruction & Library | 74 (23.9%) | 236 (76.1%) |
| Arts, Media & Entertainment | 0 (0.0%) | 74 (100.0%) |
| Health Diagnosing & Treating | 50 (38.8%) | 79 (61.2%) |
| Health Technologists | 40 (51.9%) | 37 (48.0%) |
| Total (Category) | 554 (49.7%) | 560 (50.3%) |
| Total (Overall) | 1,618 (52.8%) | 1,446 (47.2%) |
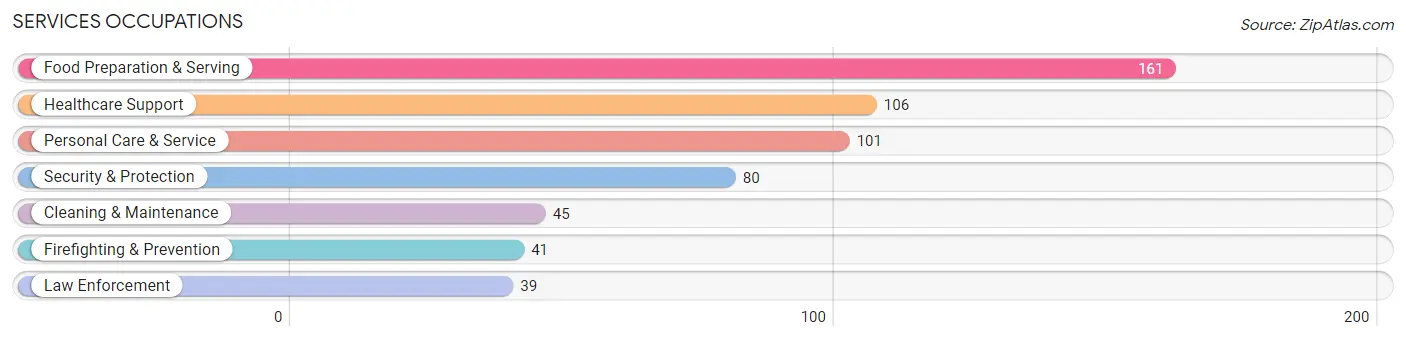
Services Occupations
The most common Services occupations in Beaver County are Food Preparation & Serving (161 | 5.2%), Healthcare Support (106 | 3.5%), Personal Care & Service (101 | 3.3%), Security & Protection (80 | 2.6%), and Cleaning & Maintenance (45 | 1.5%).
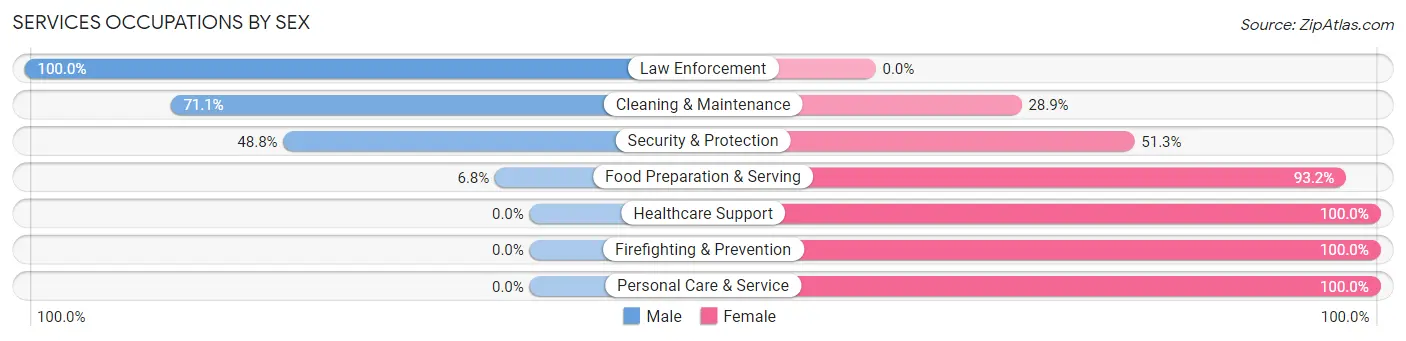
Services Occupations by Sex
Within the Services occupations in Beaver County, the most male-oriented occupations are Law Enforcement (100.0%), Cleaning & Maintenance (71.1%), and Security & Protection (48.7%), while the most female-oriented occupations are Healthcare Support (100.0%), Firefighting & Prevention (100.0%), and Personal Care & Service (100.0%).
| Occupation | Male | Female |
| Healthcare Support | 0 (0.0%) | 106 (100.0%) |
| Security & Protection | 39 (48.7%) | 41 (51.2%) |
| Firefighting & Prevention | 0 (0.0%) | 41 (100.0%) |
| Law Enforcement | 39 (100.0%) | 0 (0.0%) |
| Food Preparation & Serving | 11 (6.8%) | 150 (93.2%) |
| Cleaning & Maintenance | 32 (71.1%) | 13 (28.9%) |
| Personal Care & Service | 0 (0.0%) | 101 (100.0%) |
| Total (Category) | 82 (16.6%) | 411 (83.4%) |
| Total (Overall) | 1,618 (52.8%) | 1,446 (47.2%) |
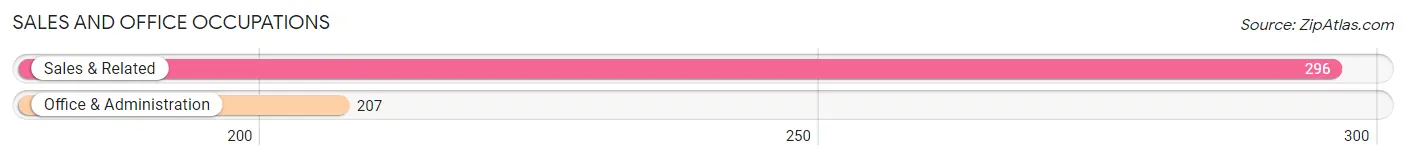
Sales and Office Occupations
The most common Sales and Office occupations in Beaver County are Sales & Related (296 | 9.7%), and Office & Administration (207 | 6.8%).
Sales and Office Occupations by Sex
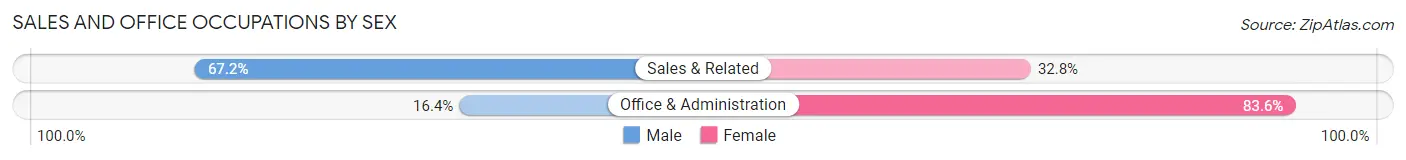
| Occupation | Male | Female |
| Sales & Related | 199 (67.2%) | 97 (32.8%) |
| Office & Administration | 34 (16.4%) | 173 (83.6%) |
| Total (Category) | 233 (46.3%) | 270 (53.7%) |
| Total (Overall) | 1,618 (52.8%) | 1,446 (47.2%) |
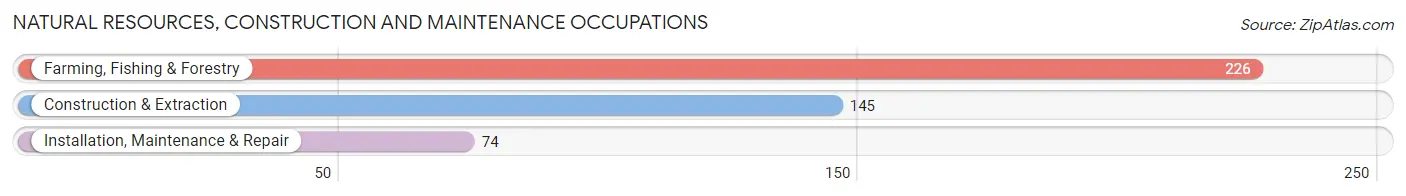
Natural Resources, Construction and Maintenance Occupations
The most common Natural Resources, Construction and Maintenance occupations in Beaver County are Farming, Fishing & Forestry (226 | 7.4%), Construction & Extraction (145 | 4.7%), and Installation, Maintenance & Repair (74 | 2.4%).
Natural Resources, Construction and Maintenance Occupations by Sex
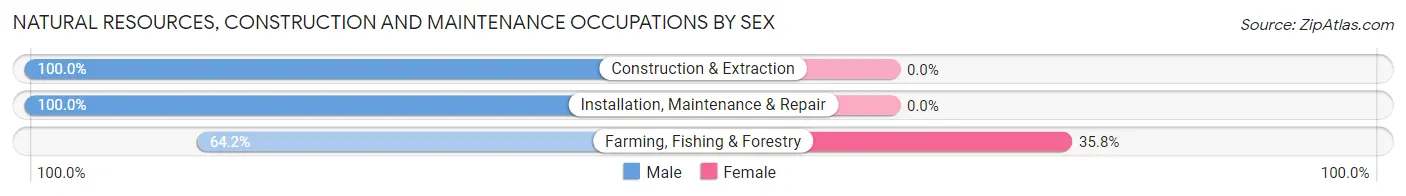
| Occupation | Male | Female |
| Farming, Fishing & Forestry | 145 (64.2%) | 81 (35.8%) |
| Construction & Extraction | 145 (100.0%) | 0 (0.0%) |
| Installation, Maintenance & Repair | 74 (100.0%) | 0 (0.0%) |
| Total (Category) | 364 (81.8%) | 81 (18.2%) |
| Total (Overall) | 1,618 (52.8%) | 1,446 (47.2%) |
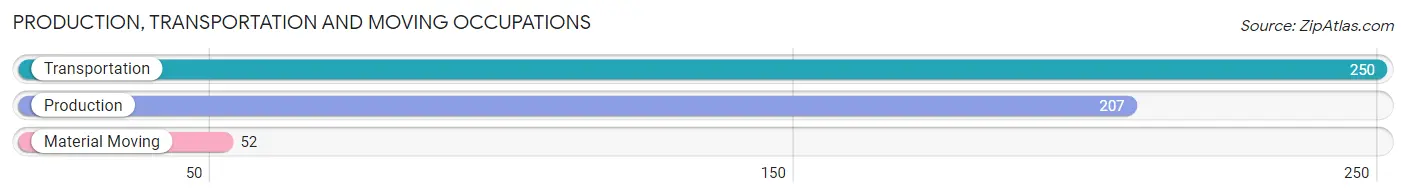
Production, Transportation and Moving Occupations
The most common Production, Transportation and Moving occupations in Beaver County are Transportation (250 | 8.2%), Production (207 | 6.8%), and Material Moving (52 | 1.7%).
Production, Transportation and Moving Occupations by Sex
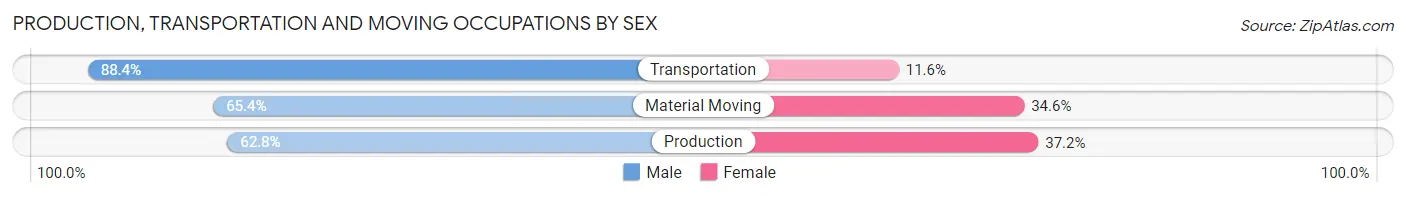
| Occupation | Male | Female |
| Production | 130 (62.8%) | 77 (37.2%) |
| Transportation | 221 (88.4%) | 29 (11.6%) |
| Material Moving | 34 (65.4%) | 18 (34.6%) |
| Total (Category) | 385 (75.6%) | 124 (24.4%) |
| Total (Overall) | 1,618 (52.8%) | 1,446 (47.2%) |
Employment Industries by Sex in Beaver County
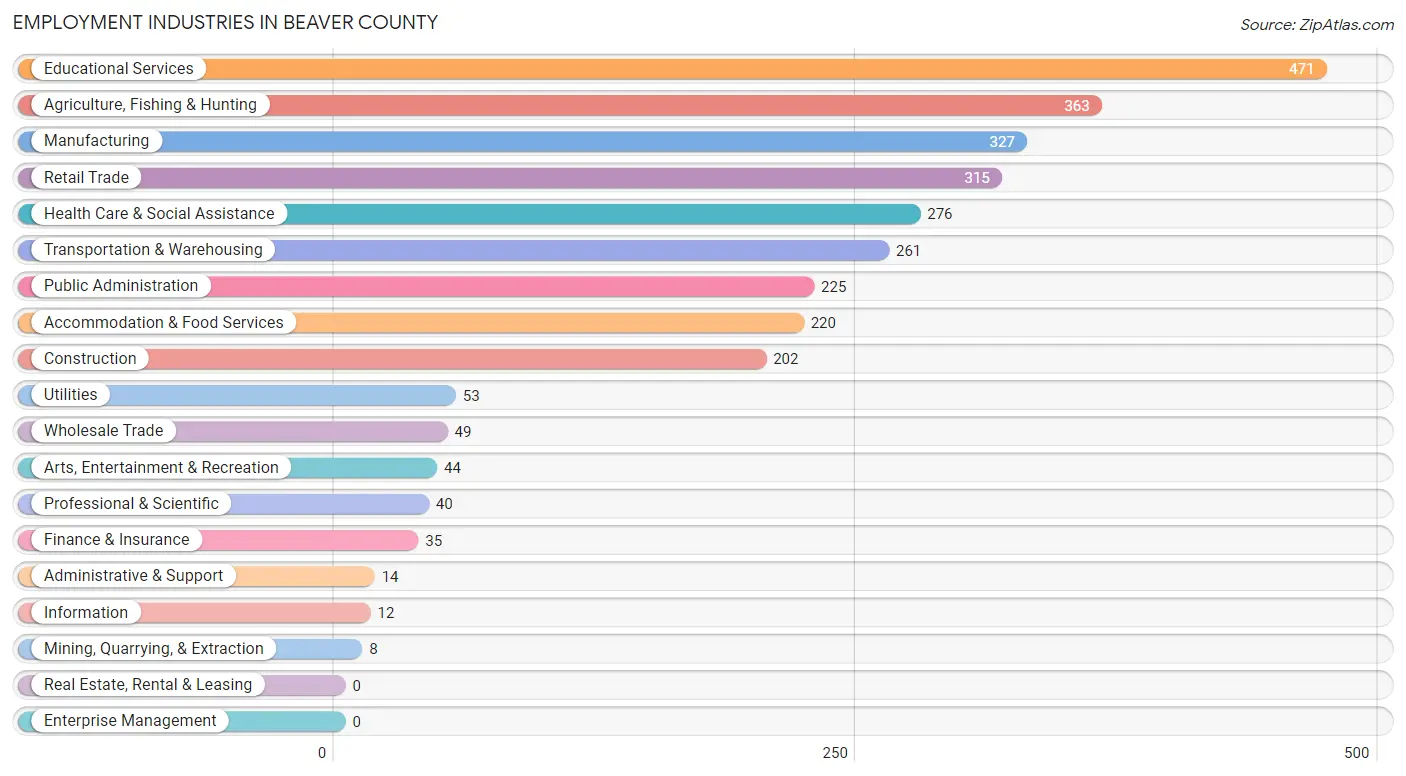
Employment Industries in Beaver County
The major employment industries in Beaver County include Educational Services (471 | 15.4%), Agriculture, Fishing & Hunting (363 | 11.8%), Manufacturing (327 | 10.7%), Retail Trade (315 | 10.3%), and Health Care & Social Assistance (276 | 9.0%).
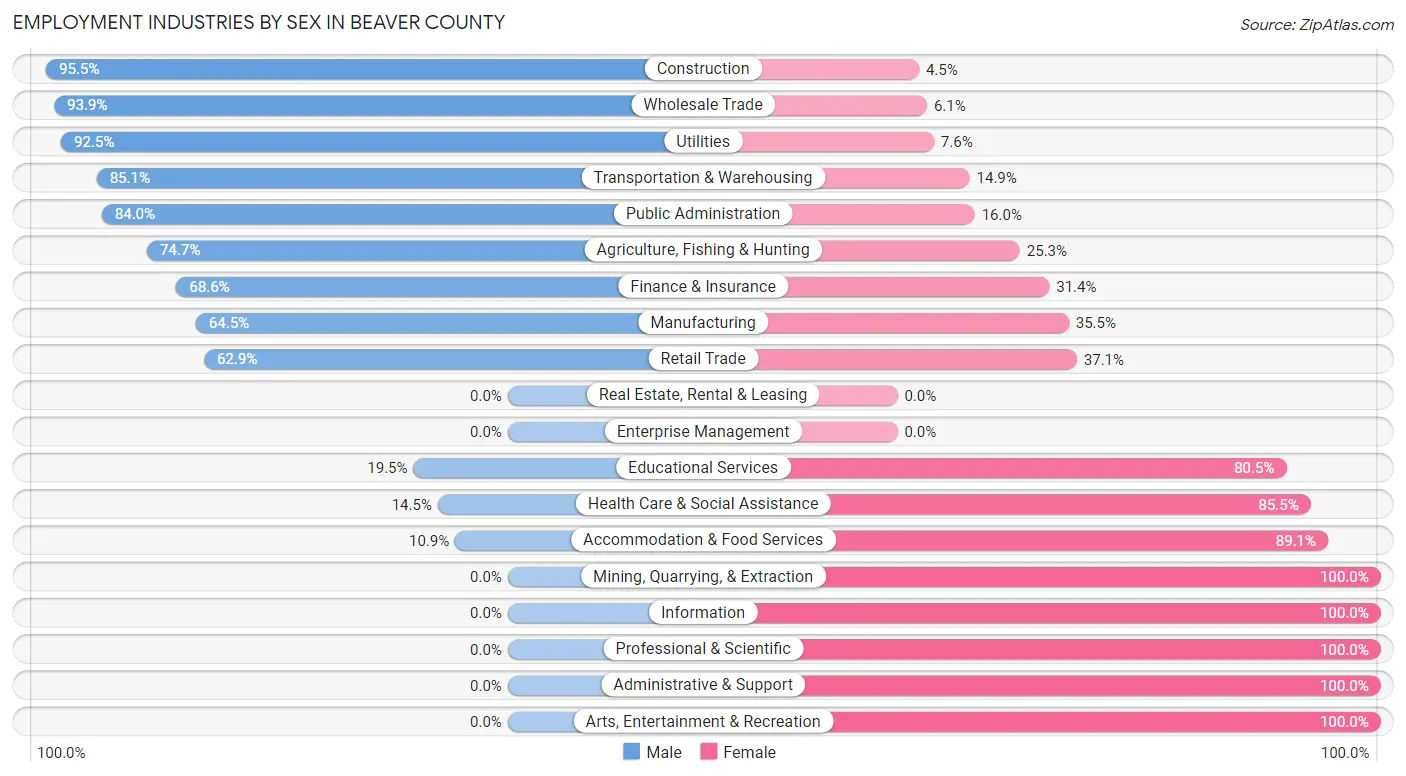
Employment Industries by Sex in Beaver County
The Beaver County industries that see more men than women are Construction (95.5%), Wholesale Trade (93.9%), and Utilities (92.4%), whereas the industries that tend to have a higher number of women are Mining, Quarrying, & Extraction (100.0%), Information (100.0%), and Professional & Scientific (100.0%).
| Industry | Male | Female |
| Agriculture, Fishing & Hunting | 271 (74.7%) | 92 (25.3%) |
| Mining, Quarrying, & Extraction | 0 (0.0%) | 8 (100.0%) |
| Construction | 193 (95.5%) | 9 (4.5%) |
| Manufacturing | 211 (64.5%) | 116 (35.5%) |
| Wholesale Trade | 46 (93.9%) | 3 (6.1%) |
| Retail Trade | 198 (62.9%) | 117 (37.1%) |
| Transportation & Warehousing | 222 (85.1%) | 39 (14.9%) |
| Utilities | 49 (92.4%) | 4 (7.5%) |
| Information | 0 (0.0%) | 12 (100.0%) |
| Finance & Insurance | 24 (68.6%) | 11 (31.4%) |
| Real Estate, Rental & Leasing | 0 (0.0%) | 0 (0.0%) |
| Professional & Scientific | 0 (0.0%) | 40 (100.0%) |
| Enterprise Management | 0 (0.0%) | 0 (0.0%) |
| Administrative & Support | 0 (0.0%) | 14 (100.0%) |
| Educational Services | 92 (19.5%) | 379 (80.5%) |
| Health Care & Social Assistance | 40 (14.5%) | 236 (85.5%) |
| Arts, Entertainment & Recreation | 0 (0.0%) | 44 (100.0%) |
| Accommodation & Food Services | 24 (10.9%) | 196 (89.1%) |
| Public Administration | 189 (84.0%) | 36 (16.0%) |
| Total | 1,618 (52.8%) | 1,446 (47.2%) |
Education in Beaver County
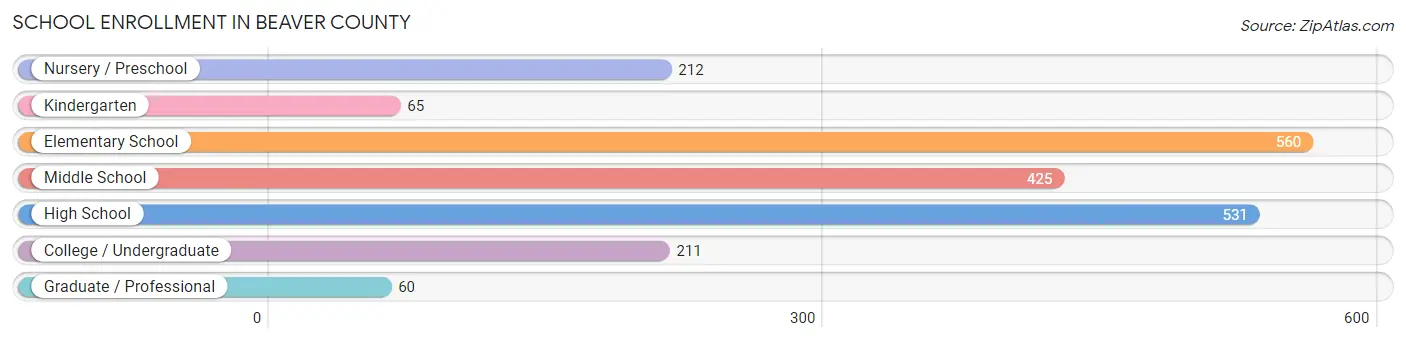
School Enrollment in Beaver County
The most common levels of schooling among the 2,064 students in Beaver County are elementary school (560 | 27.1%), high school (531 | 25.7%), and middle school (425 | 20.6%).
| School Level | # Students | % Students |
| Nursery / Preschool | 212 | 10.3% |
| Kindergarten | 65 | 3.2% |
| Elementary School | 560 | 27.1% |
| Middle School | 425 | 20.6% |
| High School | 531 | 25.7% |
| College / Undergraduate | 211 | 10.2% |
| Graduate / Professional | 60 | 2.9% |
| Total | 2,064 | 100.0% |
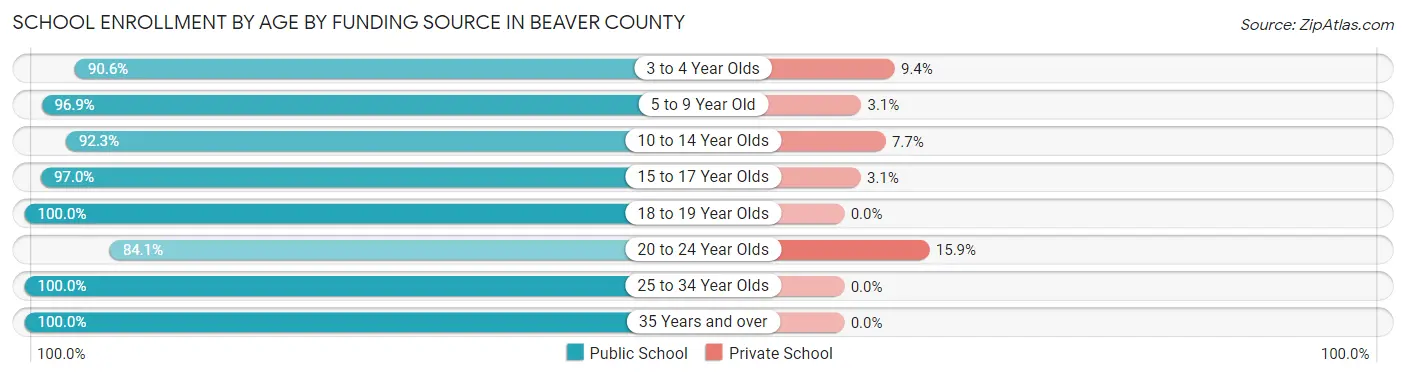
School Enrollment by Age by Funding Source in Beaver County
Out of a total of 2,064 students who are enrolled in schools in Beaver County, 93 (4.5%) attend a private institution, while the remaining 1,971 (95.5%) are enrolled in public schools. The age group of 20 to 24 year olds has the highest likelihood of being enrolled in private schools, with 10 (15.9% in the age bracket) enrolled. Conversely, the age group of 18 to 19 year olds has the lowest likelihood of being enrolled in a private school, with 228 (100.0% in the age bracket) attending a public institution.
| Age Bracket | Public School | Private School |
| 3 to 4 Year Olds | 116 (90.6%) | 12 (9.4%) |
| 5 to 9 Year Old | 648 (96.9%) | 21 (3.1%) |
| 10 to 14 Year Olds | 468 (92.3%) | 39 (7.7%) |
| 15 to 17 Year Olds | 350 (97.0%) | 11 (3.0%) |
| 18 to 19 Year Olds | 228 (100.0%) | 0 (0.0%) |
| 20 to 24 Year Olds | 53 (84.1%) | 10 (15.9%) |
| 25 to 34 Year Olds | 45 (100.0%) | 0 (0.0%) |
| 35 Years and over | 63 (100.0%) | 0 (0.0%) |
| Total | 1,971 (95.5%) | 93 (4.5%) |
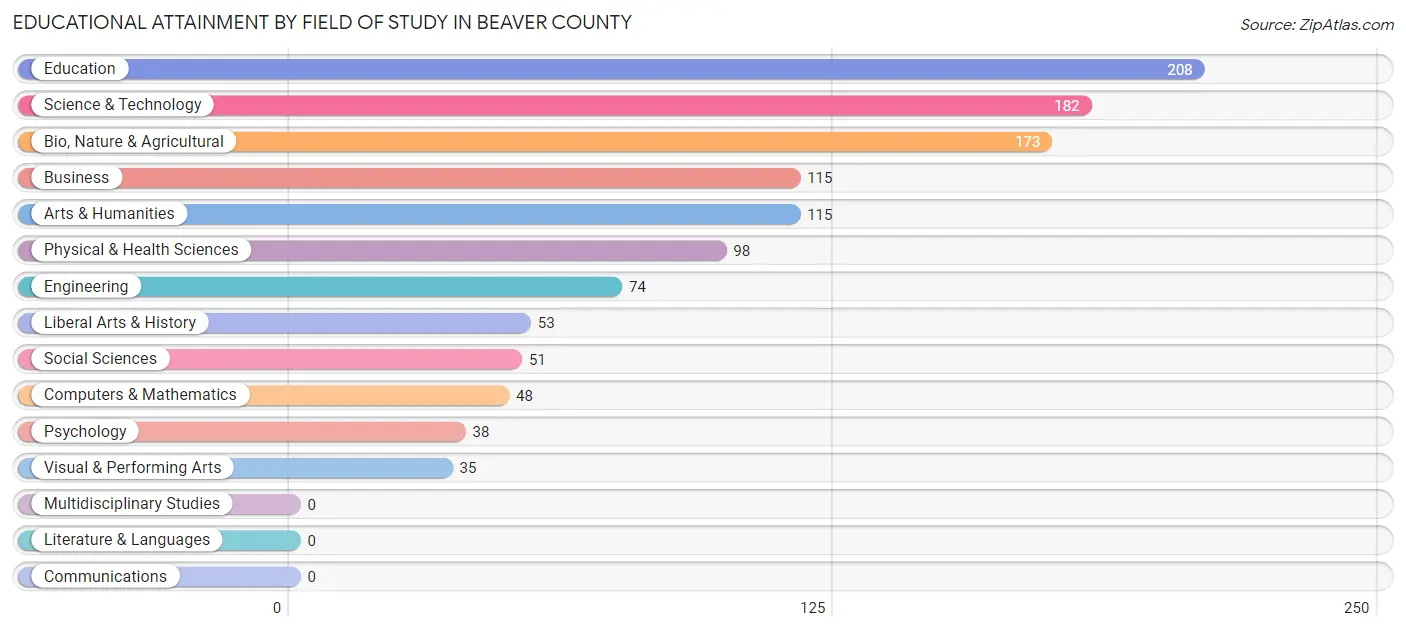
Educational Attainment by Field of Study in Beaver County
Education (208 | 17.5%), science & technology (182 | 15.3%), bio, nature & agricultural (173 | 14.5%), business (115 | 9.7%), and arts & humanities (115 | 9.7%) are the most common fields of study among 1,190 individuals in Beaver County who have obtained a bachelor's degree or higher.
| Field of Study | # Graduates | % Graduates |
| Computers & Mathematics | 48 | 4.0% |
| Bio, Nature & Agricultural | 173 | 14.5% |
| Physical & Health Sciences | 98 | 8.2% |
| Psychology | 38 | 3.2% |
| Social Sciences | 51 | 4.3% |
| Engineering | 74 | 6.2% |
| Multidisciplinary Studies | 0 | 0.0% |
| Science & Technology | 182 | 15.3% |
| Business | 115 | 9.7% |
| Education | 208 | 17.5% |
| Literature & Languages | 0 | 0.0% |
| Liberal Arts & History | 53 | 4.4% |
| Visual & Performing Arts | 35 | 2.9% |
| Communications | 0 | 0.0% |
| Arts & Humanities | 115 | 9.7% |
| Total | 1,190 | 100.0% |
Transportation & Commute in Beaver County
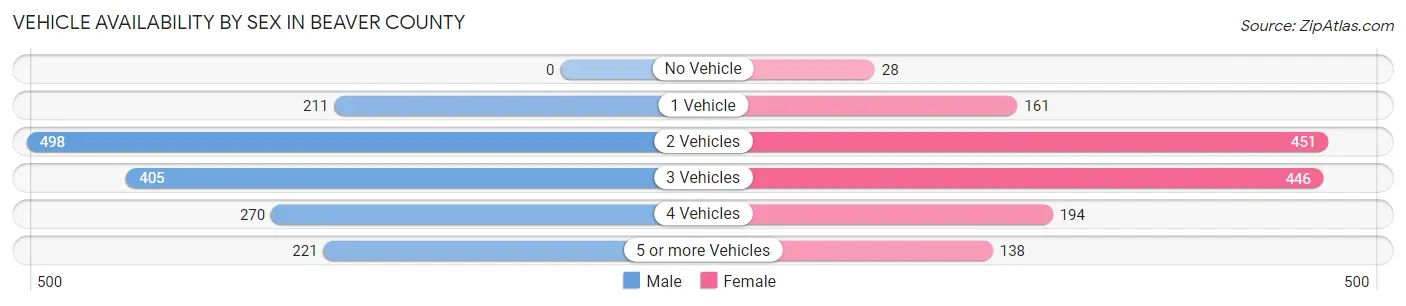
Vehicle Availability by Sex in Beaver County
The most prevalent vehicle ownership categories in Beaver County are males with 2 vehicles (498, accounting for 31.0%) and females with 2 vehicles (451, making up 35.1%).
| Vehicles Available | Male | Female |
| No Vehicle | 0 (0.0%) | 28 (2.0%) |
| 1 Vehicle | 211 (13.2%) | 161 (11.4%) |
| 2 Vehicles | 498 (31.0%) | 451 (31.8%) |
| 3 Vehicles | 405 (25.2%) | 446 (31.5%) |
| 4 Vehicles | 270 (16.8%) | 194 (13.7%) |
| 5 or more Vehicles | 221 (13.8%) | 138 (9.7%) |
| Total | 1,605 (100.0%) | 1,418 (100.0%) |
Commute Time in Beaver County
The most frequently occuring commute durations in Beaver County are less than 5 minutes (821 commuters, 29.8%), 5 to 9 minutes (741 commuters, 26.9%), and 45 to 59 minutes (261 commuters, 9.5%).
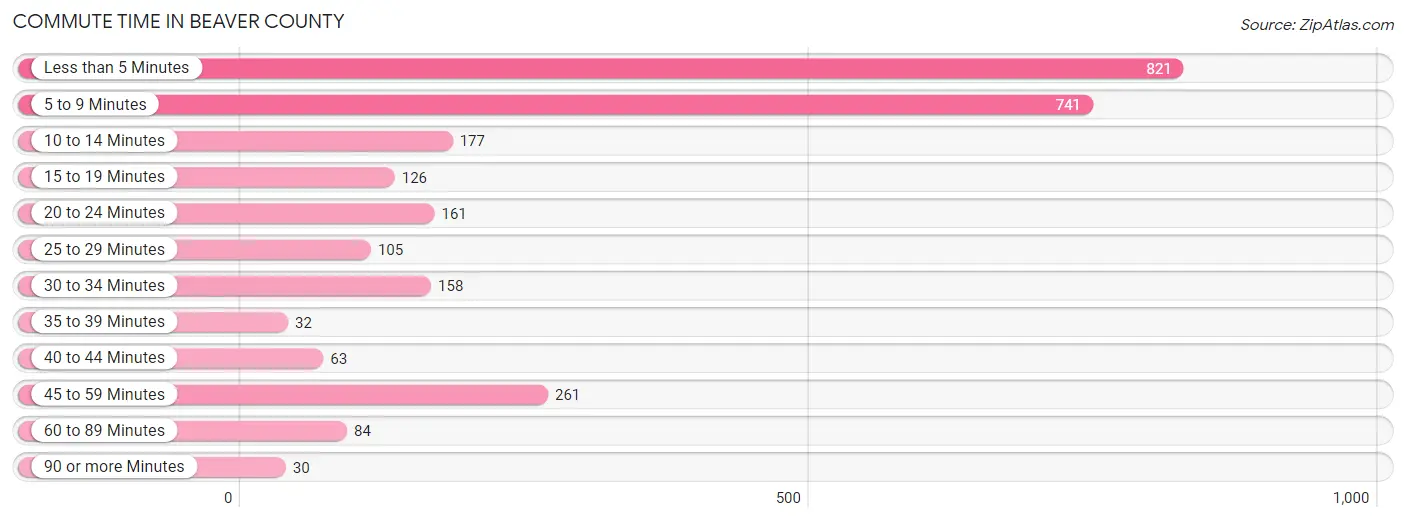
| Commute Time | # Commuters | % Commuters |
| Less than 5 Minutes | 821 | 29.8% |
| 5 to 9 Minutes | 741 | 26.9% |
| 10 to 14 Minutes | 177 | 6.4% |
| 15 to 19 Minutes | 126 | 4.6% |
| 20 to 24 Minutes | 161 | 5.8% |
| 25 to 29 Minutes | 105 | 3.8% |
| 30 to 34 Minutes | 158 | 5.7% |
| 35 to 39 Minutes | 32 | 1.2% |
| 40 to 44 Minutes | 63 | 2.3% |
| 45 to 59 Minutes | 261 | 9.5% |
| 60 to 89 Minutes | 84 | 3.0% |
| 90 or more Minutes | 30 | 1.1% |
Commute Time by Sex in Beaver County
The most common commute times in Beaver County are 5 to 9 minutes (390 commuters, 26.1%) for males and less than 5 minutes (482 commuters, 38.1%) for females.
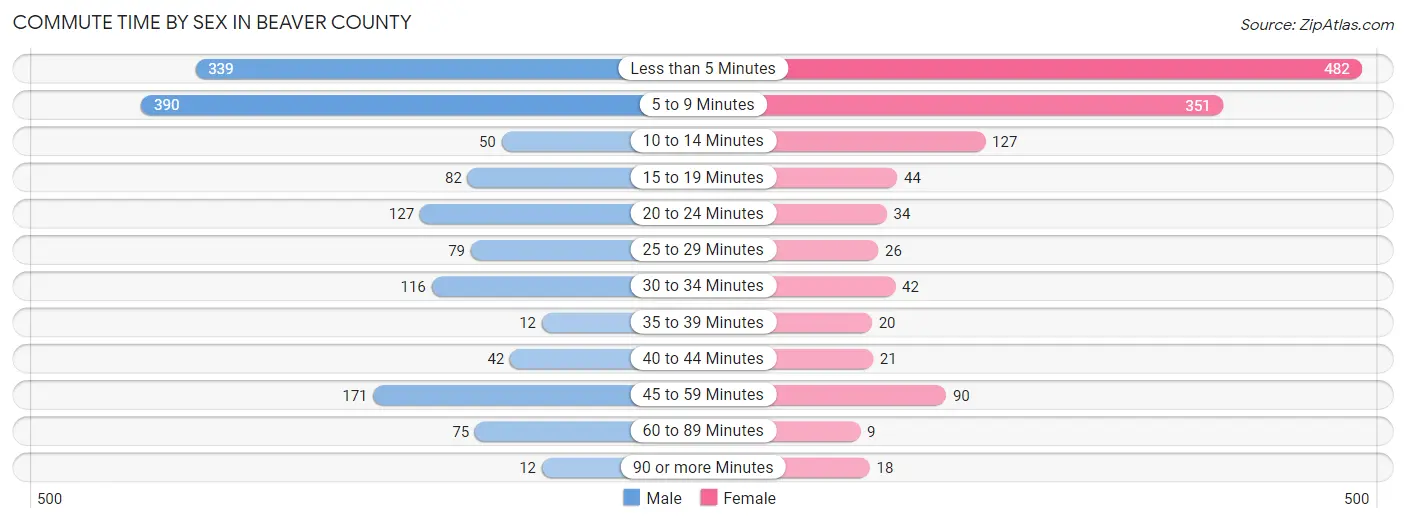
| Commute Time | Male | Female |
| Less than 5 Minutes | 339 (22.7%) | 482 (38.1%) |
| 5 to 9 Minutes | 390 (26.1%) | 351 (27.8%) |
| 10 to 14 Minutes | 50 (3.3%) | 127 (10.1%) |
| 15 to 19 Minutes | 82 (5.5%) | 44 (3.5%) |
| 20 to 24 Minutes | 127 (8.5%) | 34 (2.7%) |
| 25 to 29 Minutes | 79 (5.3%) | 26 (2.1%) |
| 30 to 34 Minutes | 116 (7.8%) | 42 (3.3%) |
| 35 to 39 Minutes | 12 (0.8%) | 20 (1.6%) |
| 40 to 44 Minutes | 42 (2.8%) | 21 (1.7%) |
| 45 to 59 Minutes | 171 (11.4%) | 90 (7.1%) |
| 60 to 89 Minutes | 75 (5.0%) | 9 (0.7%) |
| 90 or more Minutes | 12 (0.8%) | 18 (1.4%) |
Time of Departure to Work by Sex in Beaver County
The most frequent times of departure to work in Beaver County are 7:00 AM to 7:29 AM (322, 21.5%) for males and 7:00 AM to 7:29 AM (237, 18.8%) for females.
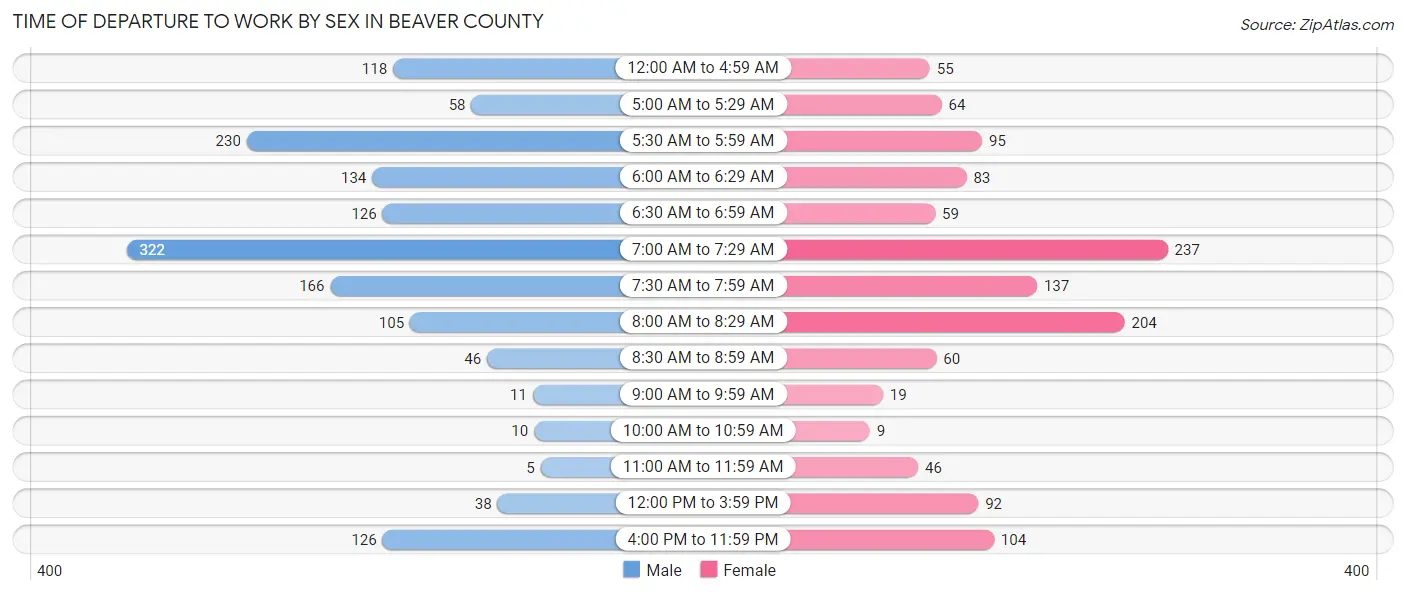
| Time of Departure | Male | Female |
| 12:00 AM to 4:59 AM | 118 (7.9%) | 55 (4.3%) |
| 5:00 AM to 5:29 AM | 58 (3.9%) | 64 (5.1%) |
| 5:30 AM to 5:59 AM | 230 (15.4%) | 95 (7.5%) |
| 6:00 AM to 6:29 AM | 134 (9.0%) | 83 (6.6%) |
| 6:30 AM to 6:59 AM | 126 (8.4%) | 59 (4.7%) |
| 7:00 AM to 7:29 AM | 322 (21.5%) | 237 (18.8%) |
| 7:30 AM to 7:59 AM | 166 (11.1%) | 137 (10.8%) |
| 8:00 AM to 8:29 AM | 105 (7.0%) | 204 (16.1%) |
| 8:30 AM to 8:59 AM | 46 (3.1%) | 60 (4.8%) |
| 9:00 AM to 9:59 AM | 11 (0.7%) | 19 (1.5%) |
| 10:00 AM to 10:59 AM | 10 (0.7%) | 9 (0.7%) |
| 11:00 AM to 11:59 AM | 5 (0.3%) | 46 (3.6%) |
| 12:00 PM to 3:59 PM | 38 (2.5%) | 92 (7.3%) |
| 4:00 PM to 11:59 PM | 126 (8.4%) | 104 (8.2%) |
| Total | 1,495 (100.0%) | 1,264 (100.0%) |
Housing Occupancy in Beaver County
Occupancy by Ownership in Beaver County
Of the total 2,290 dwellings in Beaver County, owner-occupied units account for 1,843 (80.5%), while renter-occupied units make up 447 (19.5%).
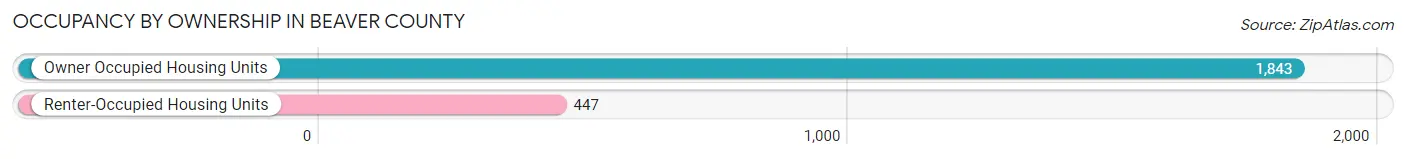
| Occupancy | # Housing Units | % Housing Units |
| Owner Occupied Housing Units | 1,843 | 80.5% |
| Renter-Occupied Housing Units | 447 | 19.5% |
| Total Occupied Housing Units | 2,290 | 100.0% |
Occupancy by Household Size in Beaver County
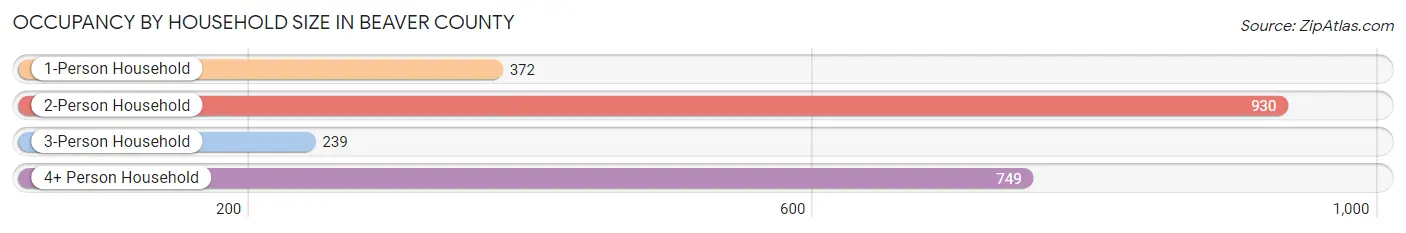
| Household Size | # Housing Units | % Housing Units |
| 1-Person Household | 372 | 16.2% |
| 2-Person Household | 930 | 40.6% |
| 3-Person Household | 239 | 10.4% |
| 4+ Person Household | 749 | 32.7% |
| Total Housing Units | 2,290 | 100.0% |
Occupancy by Ownership by Household Size in Beaver County
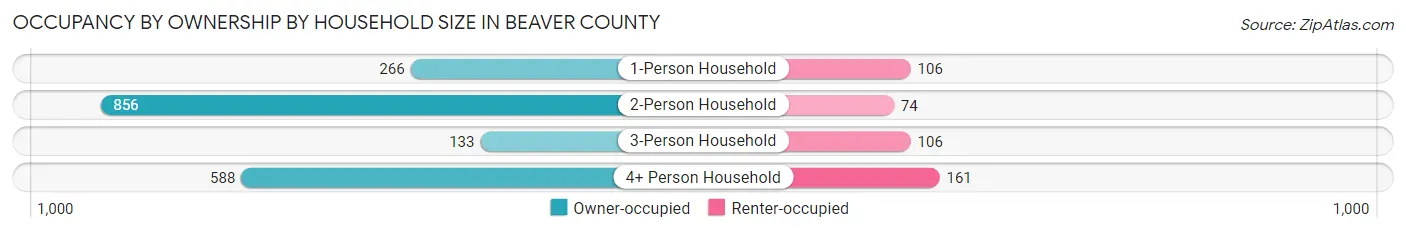
| Household Size | Owner-occupied | Renter-occupied |
| 1-Person Household | 266 (71.5%) | 106 (28.5%) |
| 2-Person Household | 856 (92.0%) | 74 (8.0%) |
| 3-Person Household | 133 (55.6%) | 106 (44.4%) |
| 4+ Person Household | 588 (78.5%) | 161 (21.5%) |
| Total Housing Units | 1,843 (80.5%) | 447 (19.5%) |
Occupancy by Educational Attainment in Beaver County
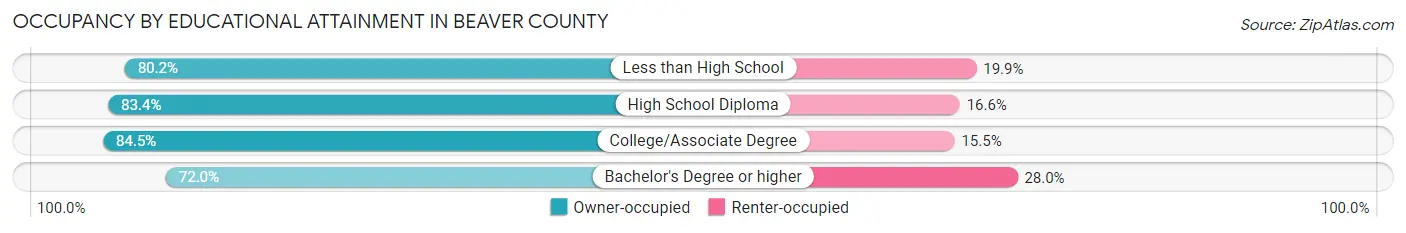
| Household Size | Owner-occupied | Renter-occupied |
| Less than High School | 109 (80.1%) | 27 (19.9%) |
| High School Diploma | 534 (83.4%) | 106 (16.6%) |
| College/Associate Degree | 745 (84.5%) | 137 (15.5%) |
| Bachelor's Degree or higher | 455 (72.0%) | 177 (28.0%) |
Occupancy by Age of Householder in Beaver County
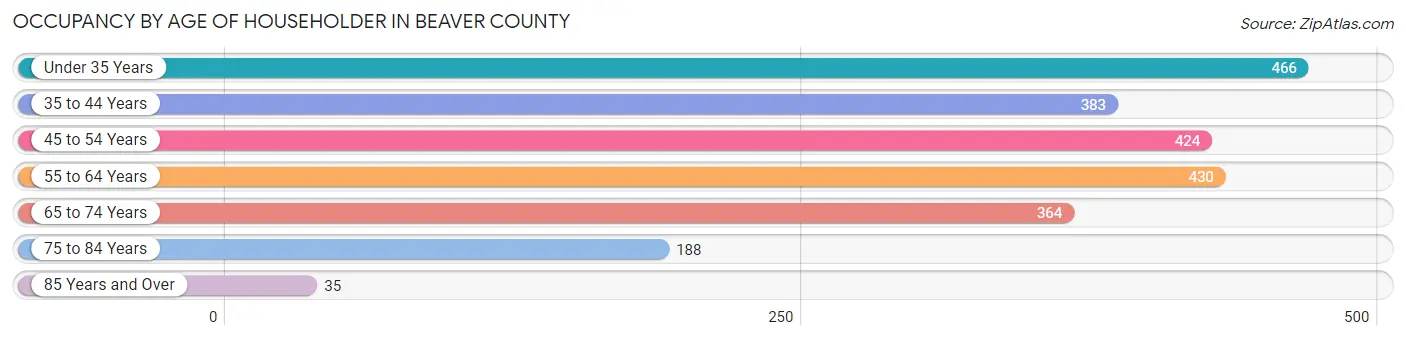
| Age Bracket | # Households | % Households |
| Under 35 Years | 466 | 20.3% |
| 35 to 44 Years | 383 | 16.7% |
| 45 to 54 Years | 424 | 18.5% |
| 55 to 64 Years | 430 | 18.8% |
| 65 to 74 Years | 364 | 15.9% |
| 75 to 84 Years | 188 | 8.2% |
| 85 Years and Over | 35 | 1.5% |
| Total | 2,290 | 100.0% |
Housing Finances in Beaver County
Median Income by Occupancy in Beaver County
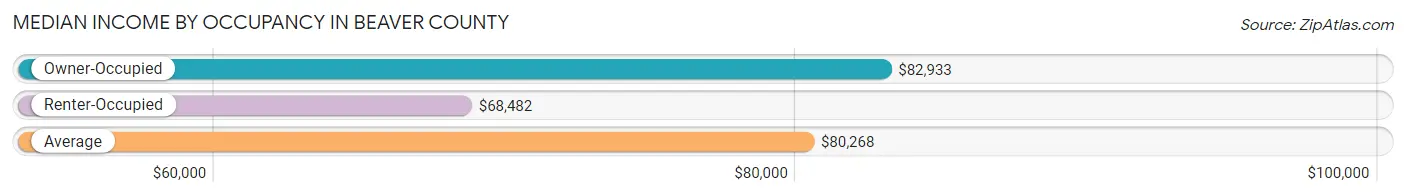
| Occupancy Type | # Households | Median Income |
| Owner-Occupied | 1,843 (80.5%) | $82,933 |
| Renter-Occupied | 447 (19.5%) | $68,482 |
| Average | 2,290 (100.0%) | $80,268 |
Occupancy by Householder Income Bracket in Beaver County
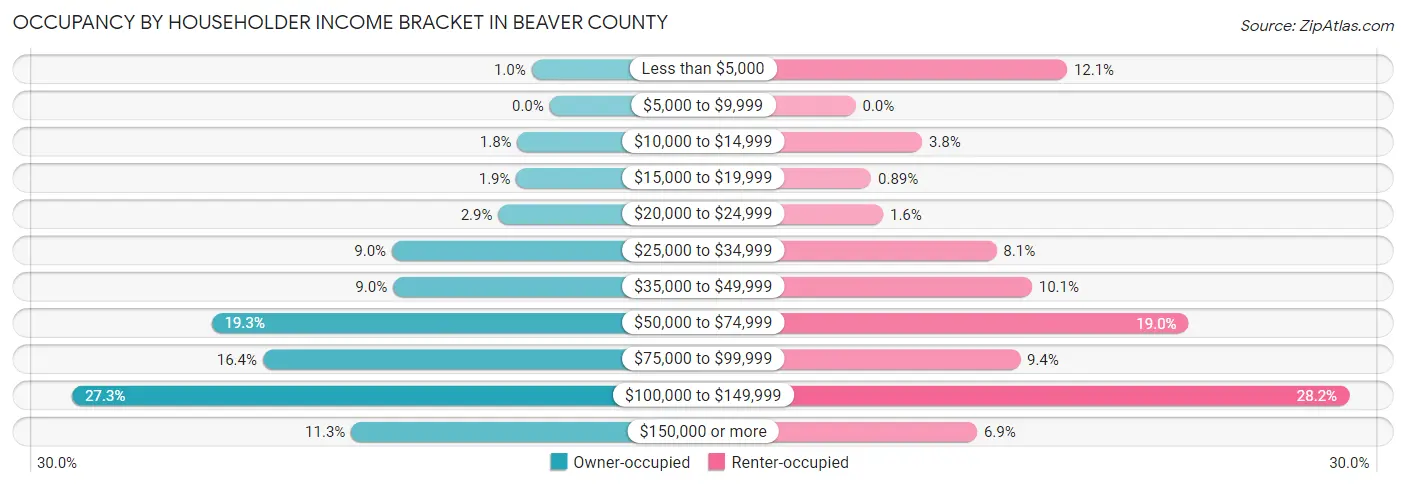
| Income Bracket | Owner-occupied | Renter-occupied |
| Less than $5,000 | 19 (1.0%) | 54 (12.1%) |
| $5,000 to $9,999 | 0 (0.0%) | 0 (0.0%) |
| $10,000 to $14,999 | 34 (1.8%) | 17 (3.8%) |
| $15,000 to $19,999 | 35 (1.9%) | 4 (0.9%) |
| $20,000 to $24,999 | 54 (2.9%) | 7 (1.6%) |
| $25,000 to $34,999 | 166 (9.0%) | 36 (8.1%) |
| $35,000 to $49,999 | 165 (8.9%) | 45 (10.1%) |
| $50,000 to $74,999 | 356 (19.3%) | 85 (19.0%) |
| $75,000 to $99,999 | 302 (16.4%) | 42 (9.4%) |
| $100,000 to $149,999 | 503 (27.3%) | 126 (28.2%) |
| $150,000 or more | 209 (11.3%) | 31 (6.9%) |
| Total | 1,843 (100.0%) | 447 (100.0%) |
Monthly Housing Cost Tiers in Beaver County
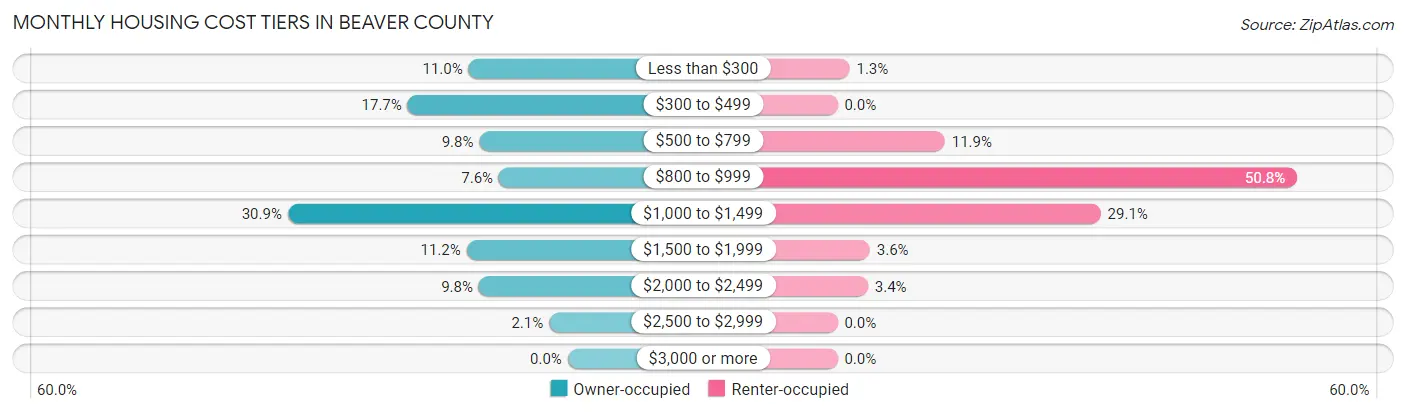
| Monthly Cost | Owner-occupied | Renter-occupied |
| Less than $300 | 202 (11.0%) | 6 (1.3%) |
| $300 to $499 | 326 (17.7%) | 0 (0.0%) |
| $500 to $799 | 180 (9.8%) | 53 (11.9%) |
| $800 to $999 | 140 (7.6%) | 227 (50.8%) |
| $1,000 to $1,499 | 570 (30.9%) | 130 (29.1%) |
| $1,500 to $1,999 | 206 (11.2%) | 16 (3.6%) |
| $2,000 to $2,499 | 181 (9.8%) | 15 (3.4%) |
| $2,500 to $2,999 | 38 (2.1%) | 0 (0.0%) |
| $3,000 or more | 0 (0.0%) | 0 (0.0%) |
| Total | 1,843 (100.0%) | 447 (100.0%) |
Physical Housing Characteristics in Beaver County
Housing Structures in Beaver County
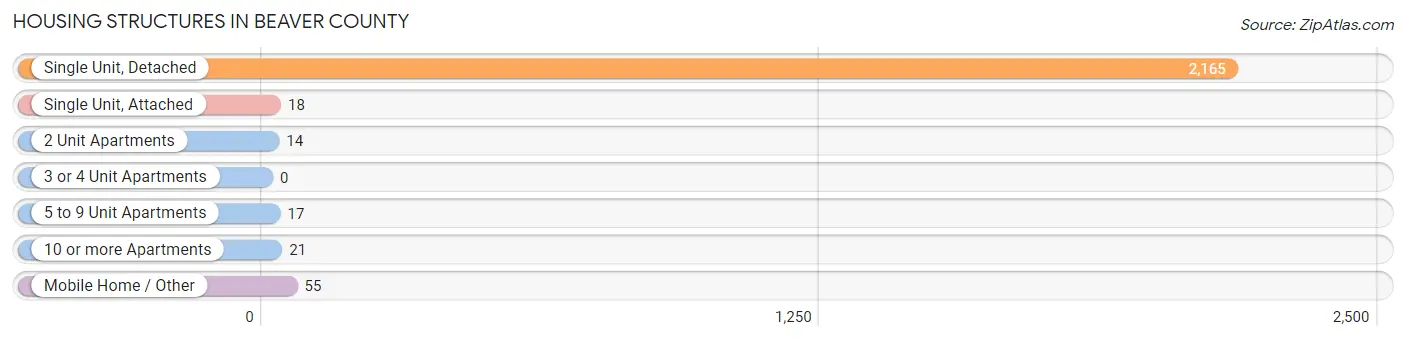
| Structure Type | # Housing Units | % Housing Units |
| Single Unit, Detached | 2,165 | 94.5% |
| Single Unit, Attached | 18 | 0.8% |
| 2 Unit Apartments | 14 | 0.6% |
| 3 or 4 Unit Apartments | 0 | 0.0% |
| 5 to 9 Unit Apartments | 17 | 0.7% |
| 10 or more Apartments | 21 | 0.9% |
| Mobile Home / Other | 55 | 2.4% |
| Total | 2,290 | 100.0% |
Housing Structures by Occupancy in Beaver County
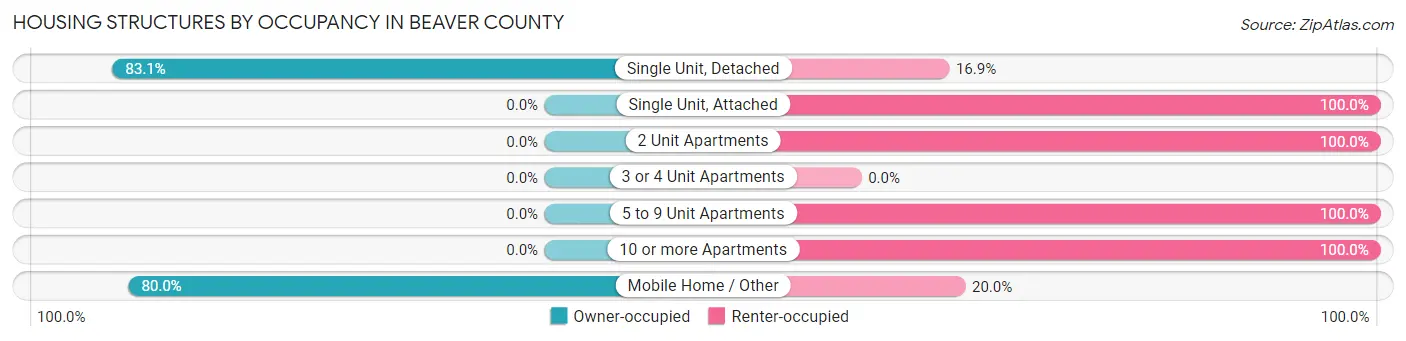
| Structure Type | Owner-occupied | Renter-occupied |
| Single Unit, Detached | 1,799 (83.1%) | 366 (16.9%) |
| Single Unit, Attached | 0 (0.0%) | 18 (100.0%) |
| 2 Unit Apartments | 0 (0.0%) | 14 (100.0%) |
| 3 or 4 Unit Apartments | 0 (0.0%) | 0 (0.0%) |
| 5 to 9 Unit Apartments | 0 (0.0%) | 17 (100.0%) |
| 10 or more Apartments | 0 (0.0%) | 21 (100.0%) |
| Mobile Home / Other | 44 (80.0%) | 11 (20.0%) |
| Total | 1,843 (80.5%) | 447 (19.5%) |
Housing Structures by Number of Rooms in Beaver County
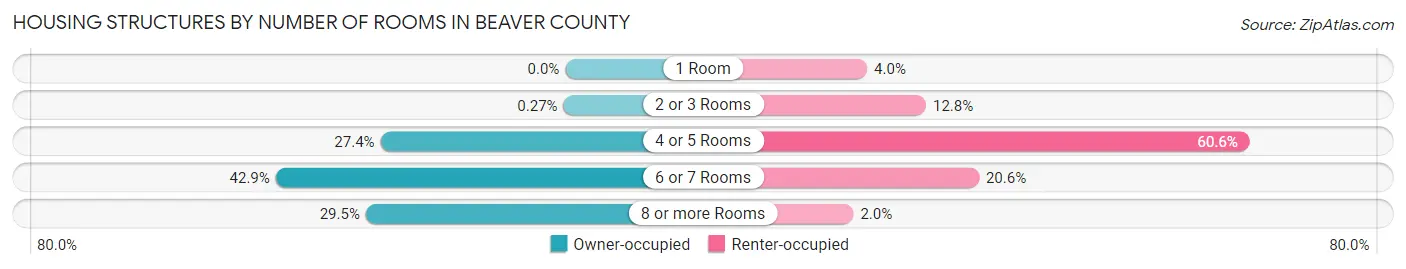
| Number of Rooms | Owner-occupied | Renter-occupied |
| 1 Room | 0 (0.0%) | 18 (4.0%) |
| 2 or 3 Rooms | 5 (0.3%) | 57 (12.8%) |
| 4 or 5 Rooms | 504 (27.4%) | 271 (60.6%) |
| 6 or 7 Rooms | 790 (42.9%) | 92 (20.6%) |
| 8 or more Rooms | 544 (29.5%) | 9 (2.0%) |
| Total | 1,843 (100.0%) | 447 (100.0%) |
Housing Structure by Heating Type in Beaver County
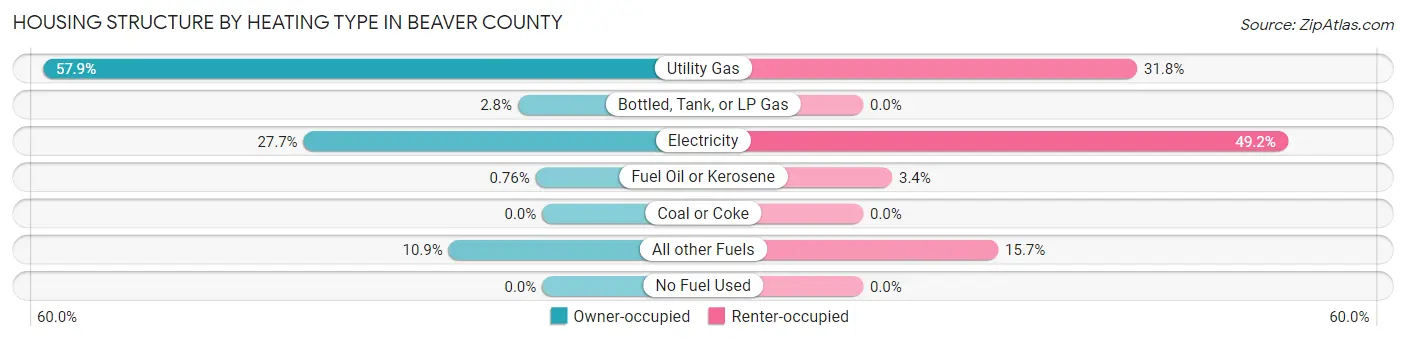
| Heating Type | Owner-occupied | Renter-occupied |
| Utility Gas | 1,067 (57.9%) | 142 (31.8%) |
| Bottled, Tank, or LP Gas | 52 (2.8%) | 0 (0.0%) |
| Electricity | 510 (27.7%) | 220 (49.2%) |
| Fuel Oil or Kerosene | 14 (0.8%) | 15 (3.4%) |
| Coal or Coke | 0 (0.0%) | 0 (0.0%) |
| All other Fuels | 200 (10.8%) | 70 (15.7%) |
| No Fuel Used | 0 (0.0%) | 0 (0.0%) |
| Total | 1,843 (100.0%) | 447 (100.0%) |
Household Vehicle Usage in Beaver County
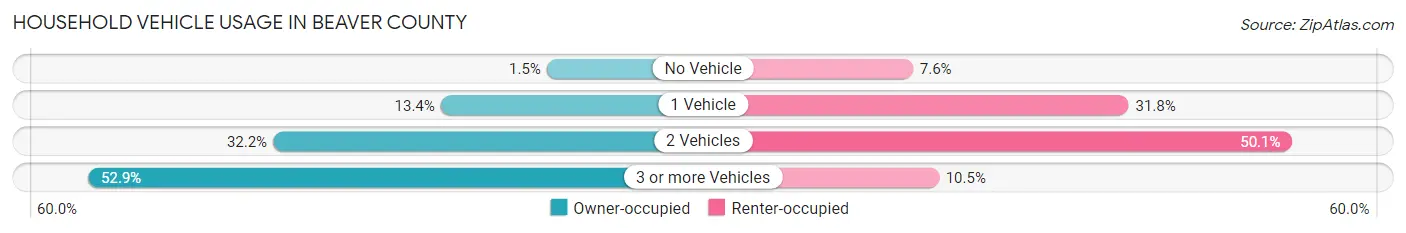
| Vehicles per Household | Owner-occupied | Renter-occupied |
| No Vehicle | 28 (1.5%) | 34 (7.6%) |
| 1 Vehicle | 247 (13.4%) | 142 (31.8%) |
| 2 Vehicles | 593 (32.2%) | 224 (50.1%) |
| 3 or more Vehicles | 975 (52.9%) | 47 (10.5%) |
| Total | 1,843 (100.0%) | 447 (100.0%) |
Real Estate & Mortgages in Beaver County
Real Estate and Mortgage Overview in Beaver County
| Characteristic | Without Mortgage | With Mortgage |
| Housing Units | 570 | 1,273 |
| Median Property Value | $271,700 | $244,100 |
| Median Household Income | $46,667 | $197 |
| Monthly Housing Costs | $335 | $0 |
| Real Estate Taxes | $937 | $0 |
Property Value by Mortgage Status in Beaver County
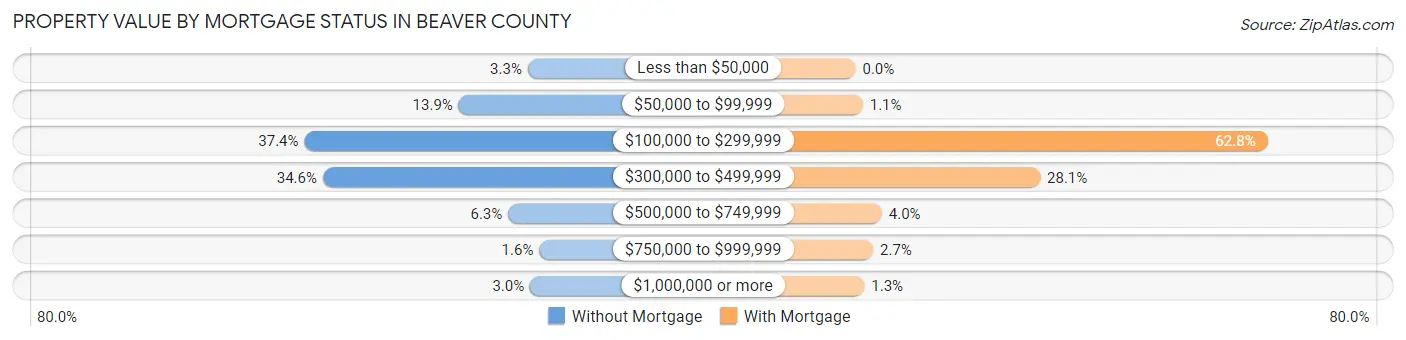
| Property Value | Without Mortgage | With Mortgage |
| Less than $50,000 | 19 (3.3%) | 0 (0.0%) |
| $50,000 to $99,999 | 79 (13.9%) | 14 (1.1%) |
| $100,000 to $299,999 | 213 (37.4%) | 799 (62.8%) |
| $300,000 to $499,999 | 197 (34.6%) | 358 (28.1%) |
| $500,000 to $749,999 | 36 (6.3%) | 51 (4.0%) |
| $750,000 to $999,999 | 9 (1.6%) | 34 (2.7%) |
| $1,000,000 or more | 17 (3.0%) | 17 (1.3%) |
| Total | 570 (100.0%) | 1,273 (100.0%) |
Household Income by Mortgage Status in Beaver County
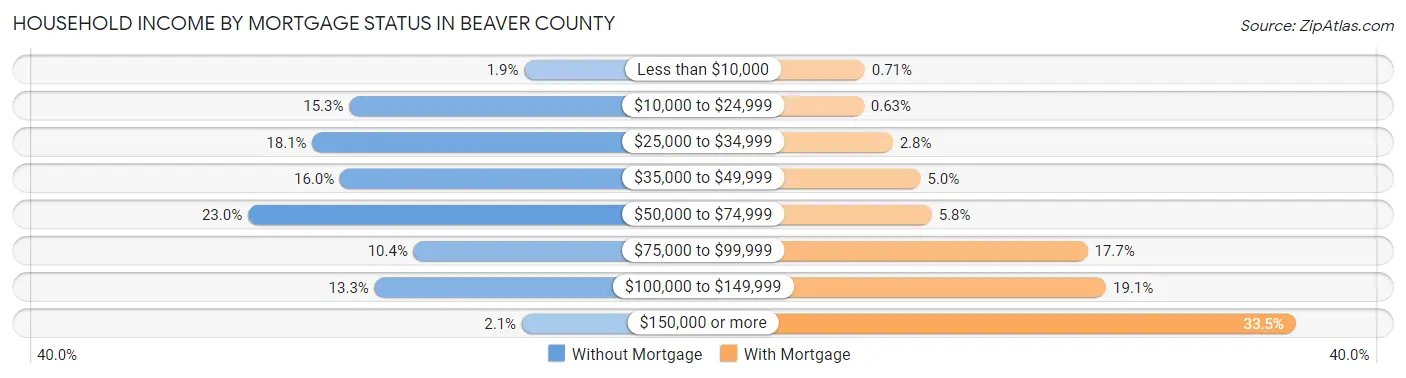
| Household Income | Without Mortgage | With Mortgage |
| Less than $10,000 | 11 (1.9%) | 9 (0.7%) |
| $10,000 to $24,999 | 87 (15.3%) | 8 (0.6%) |
| $25,000 to $34,999 | 103 (18.1%) | 36 (2.8%) |
| $35,000 to $49,999 | 91 (16.0%) | 63 (5.0%) |
| $50,000 to $74,999 | 131 (23.0%) | 74 (5.8%) |
| $75,000 to $99,999 | 59 (10.3%) | 225 (17.7%) |
| $100,000 to $149,999 | 76 (13.3%) | 243 (19.1%) |
| $150,000 or more | 12 (2.1%) | 427 (33.5%) |
| Total | 570 (100.0%) | 1,273 (100.0%) |
Property Value to Household Income Ratio in Beaver County
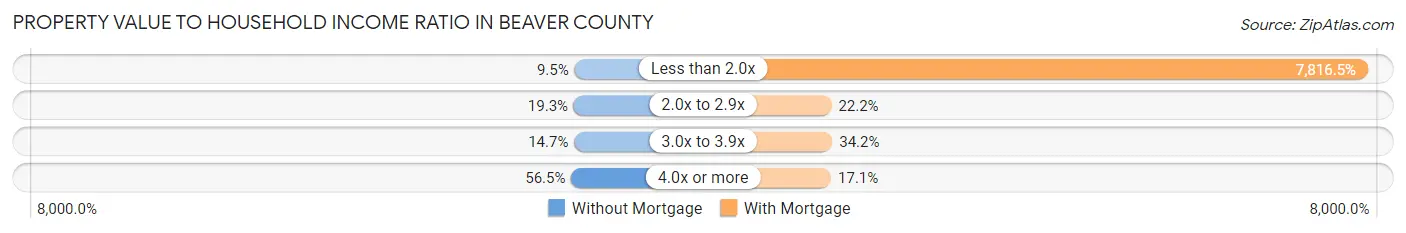
| Value-to-Income Ratio | Without Mortgage | With Mortgage |
| Less than 2.0x | 54 (9.5%) | 99,504 (7,816.5%) |
| 2.0x to 2.9x | 110 (19.3%) | 283 (22.2%) |
| 3.0x to 3.9x | 84 (14.7%) | 435 (34.2%) |
| 4.0x or more | 322 (56.5%) | 217 (17.1%) |
| Total | 570 (100.0%) | 1,273 (100.0%) |
Real Estate Taxes by Mortgage Status in Beaver County
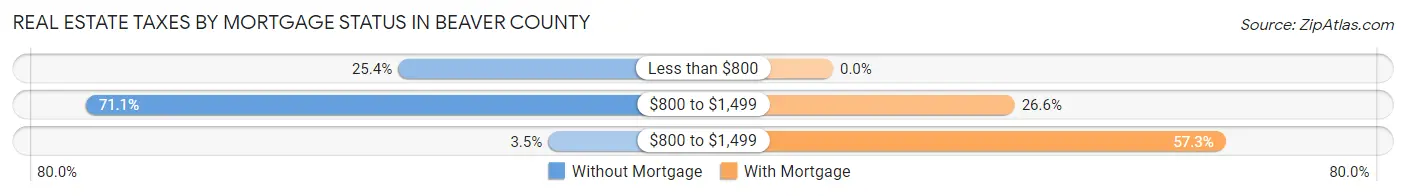
| Property Taxes | Without Mortgage | With Mortgage |
| Less than $800 | 145 (25.4%) | 0 (0.0%) |
| $800 to $1,499 | 405 (71.1%) | 338 (26.6%) |
| $800 to $1,499 | 20 (3.5%) | 730 (57.3%) |
| Total | 570 (100.0%) | 1,273 (100.0%) |
Health & Disability in Beaver County
Health Insurance Coverage by Age in Beaver County
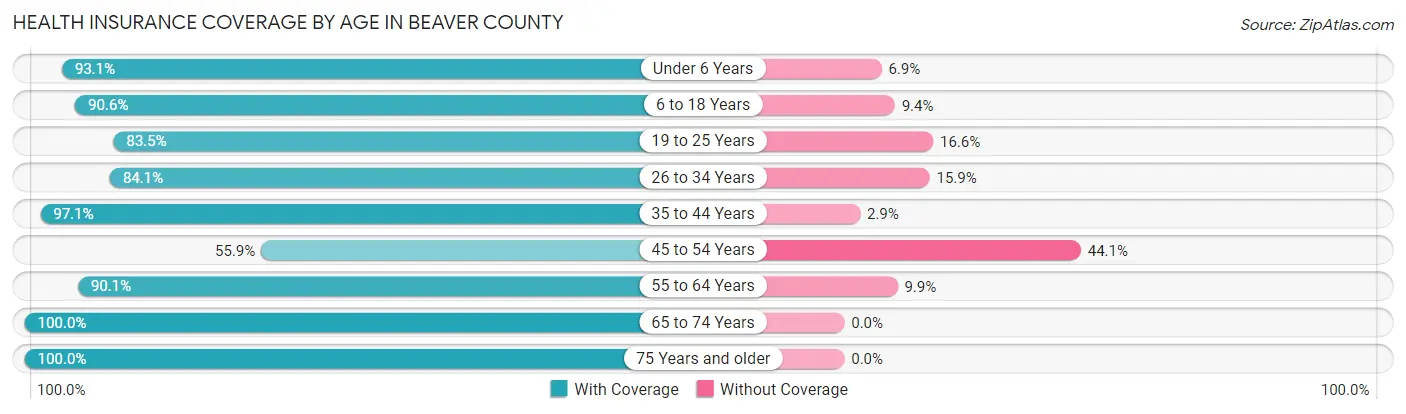
| Age Bracket | With Coverage | Without Coverage |
| Under 6 Years | 684 (93.1%) | 51 (6.9%) |
| 6 to 18 Years | 1,453 (90.6%) | 151 (9.4%) |
| 19 to 25 Years | 459 (83.5%) | 91 (16.6%) |
| 26 to 34 Years | 603 (84.1%) | 114 (15.9%) |
| 35 to 44 Years | 795 (97.1%) | 24 (2.9%) |
| 45 to 54 Years | 394 (55.9%) | 311 (44.1%) |
| 55 to 64 Years | 708 (90.1%) | 78 (9.9%) |
| 65 to 74 Years | 637 (100.0%) | 0 (0.0%) |
| 75 Years and older | 344 (100.0%) | 0 (0.0%) |
| Total | 6,077 (88.1%) | 820 (11.9%) |
Health Insurance Coverage by Citizenship Status in Beaver County
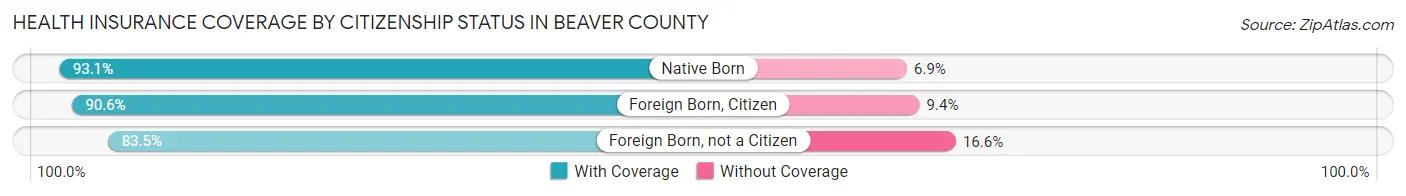
| Citizenship Status | With Coverage | Without Coverage |
| Native Born | 684 (93.1%) | 51 (6.9%) |
| Foreign Born, Citizen | 1,453 (90.6%) | 151 (9.4%) |
| Foreign Born, not a Citizen | 459 (83.5%) | 91 (16.6%) |
Health Insurance Coverage by Household Income in Beaver County
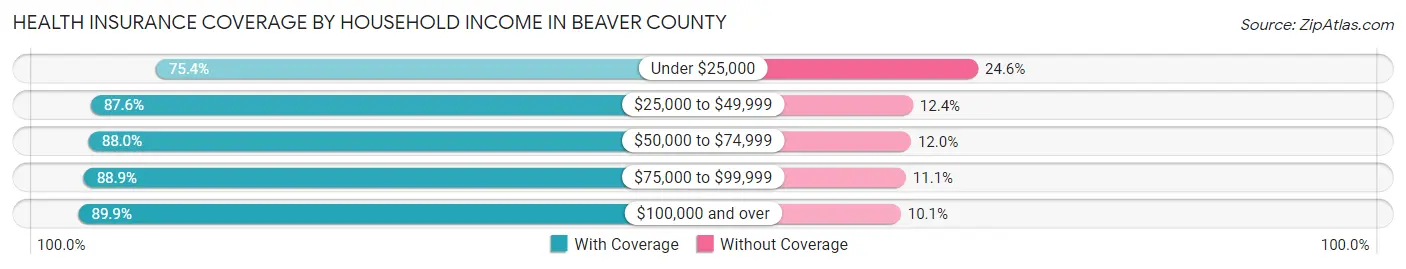
| Household Income | With Coverage | Without Coverage |
| Under $25,000 | 331 (75.4%) | 108 (24.6%) |
| $25,000 to $49,999 | 707 (87.6%) | 100 (12.4%) |
| $50,000 to $74,999 | 1,228 (88.0%) | 168 (12.0%) |
| $75,000 to $99,999 | 1,156 (88.9%) | 144 (11.1%) |
| $100,000 and over | 2,655 (89.9%) | 299 (10.1%) |
Public vs Private Health Insurance Coverage by Age in Beaver County
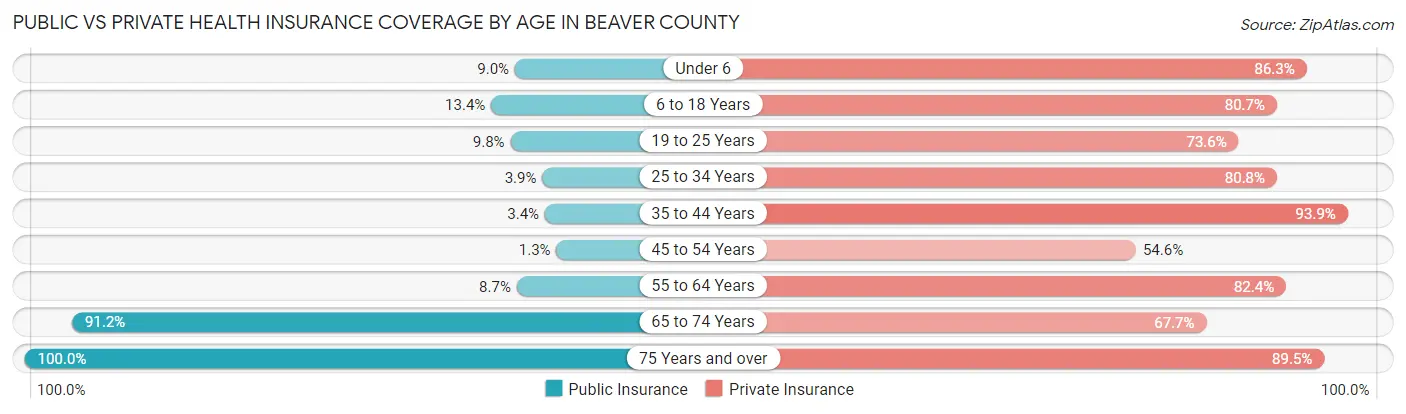
| Age Bracket | Public Insurance | Private Insurance |
| Under 6 | 66 (9.0%) | 634 (86.3%) |
| 6 to 18 Years | 215 (13.4%) | 1,295 (80.7%) |
| 19 to 25 Years | 54 (9.8%) | 405 (73.6%) |
| 25 to 34 Years | 28 (3.9%) | 579 (80.7%) |
| 35 to 44 Years | 28 (3.4%) | 769 (93.9%) |
| 45 to 54 Years | 9 (1.3%) | 385 (54.6%) |
| 55 to 64 Years | 68 (8.6%) | 648 (82.4%) |
| 65 to 74 Years | 581 (91.2%) | 431 (67.7%) |
| 75 Years and over | 344 (100.0%) | 308 (89.5%) |
| Total | 1,393 (20.2%) | 5,454 (79.1%) |
Disability Status by Sex by Age in Beaver County
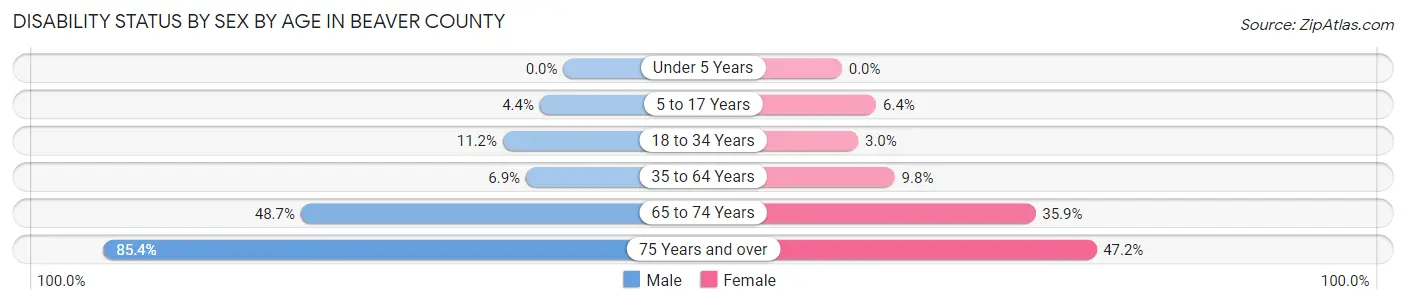
| Age Bracket | Male | Female |
| Under 5 Years | 0 (0.0%) | 0 (0.0%) |
| 5 to 17 Years | 37 (4.4%) | 49 (6.4%) |
| 18 to 34 Years | 92 (11.2%) | 18 (3.0%) |
| 35 to 64 Years | 79 (6.9%) | 115 (9.8%) |
| 65 to 74 Years | 172 (48.7%) | 102 (35.9%) |
| 75 Years and over | 140 (85.4%) | 85 (47.2%) |
Disability Class by Sex by Age in Beaver County
Disability Class: Hearing Difficulty
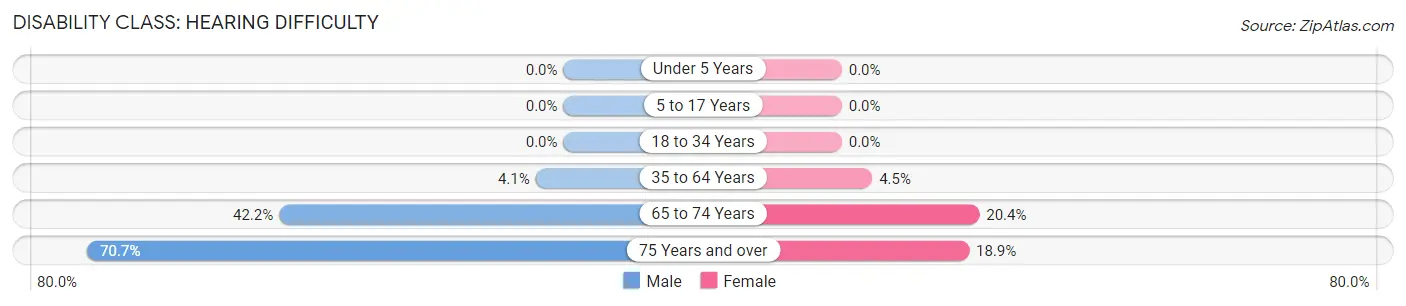
| Age Bracket | Male | Female |
| Under 5 Years | 0 (0.0%) | 0 (0.0%) |
| 5 to 17 Years | 0 (0.0%) | 0 (0.0%) |
| 18 to 34 Years | 0 (0.0%) | 0 (0.0%) |
| 35 to 64 Years | 47 (4.1%) | 53 (4.5%) |
| 65 to 74 Years | 149 (42.2%) | 58 (20.4%) |
| 75 Years and over | 116 (70.7%) | 34 (18.9%) |
Disability Class: Vision Difficulty
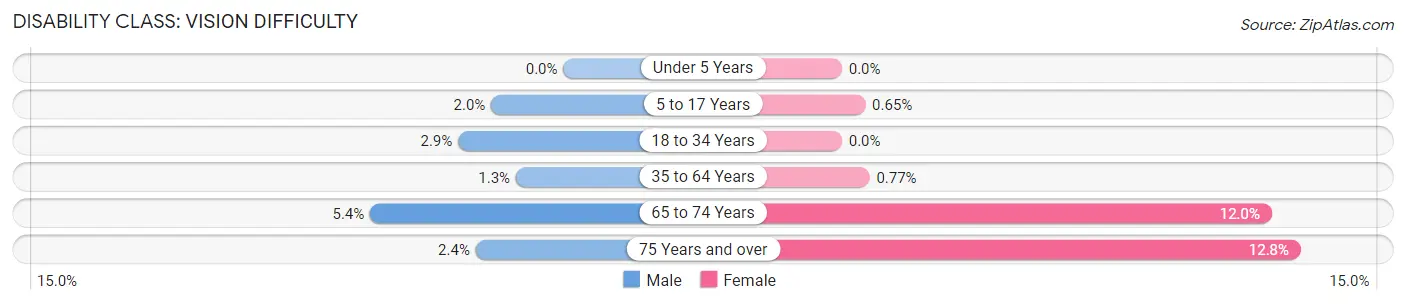
| Age Bracket | Male | Female |
| Under 5 Years | 0 (0.0%) | 0 (0.0%) |
| 5 to 17 Years | 17 (2.0%) | 5 (0.6%) |
| 18 to 34 Years | 24 (2.9%) | 0 (0.0%) |
| 35 to 64 Years | 15 (1.3%) | 9 (0.8%) |
| 65 to 74 Years | 19 (5.4%) | 34 (12.0%) |
| 75 Years and over | 4 (2.4%) | 23 (12.8%) |
Disability Class: Cognitive Difficulty
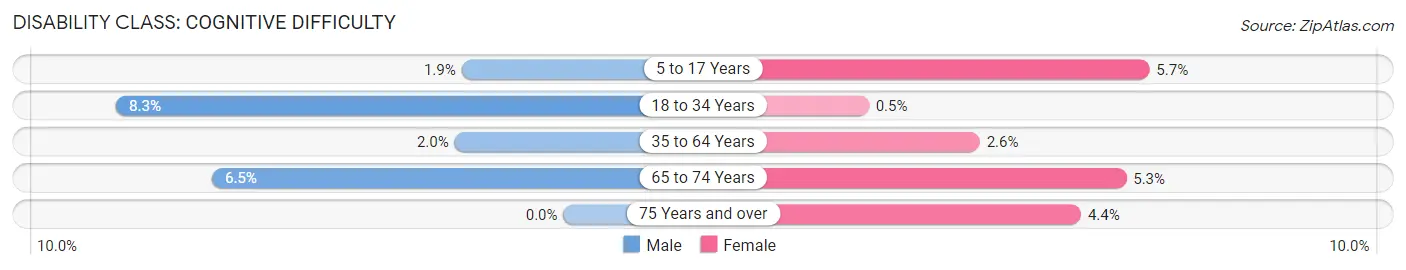
| Age Bracket | Male | Female |
| 5 to 17 Years | 16 (1.9%) | 44 (5.7%) |
| 18 to 34 Years | 68 (8.3%) | 3 (0.5%) |
| 35 to 64 Years | 23 (2.0%) | 30 (2.6%) |
| 65 to 74 Years | 23 (6.5%) | 15 (5.3%) |
| 75 Years and over | 0 (0.0%) | 8 (4.4%) |
Disability Class: Ambulatory Difficulty
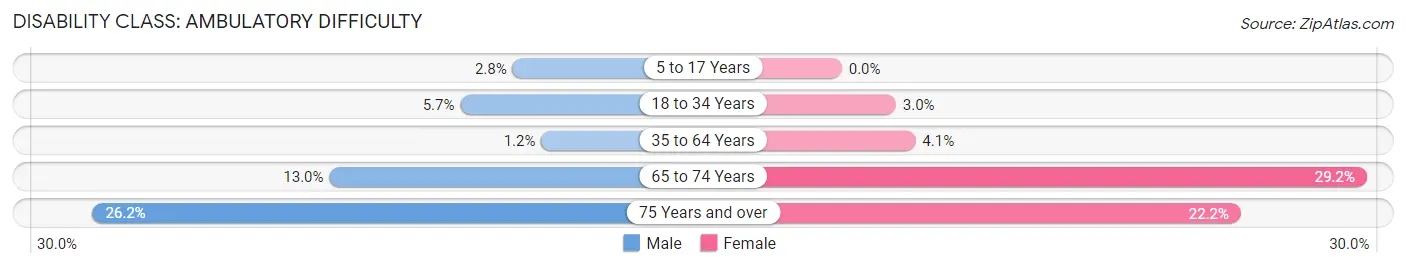
| Age Bracket | Male | Female |
| 5 to 17 Years | 24 (2.8%) | 0 (0.0%) |
| 18 to 34 Years | 47 (5.7%) | 18 (3.0%) |
| 35 to 64 Years | 14 (1.2%) | 48 (4.1%) |
| 65 to 74 Years | 46 (13.0%) | 83 (29.2%) |
| 75 Years and over | 43 (26.2%) | 40 (22.2%) |
Disability Class: Self-Care Difficulty
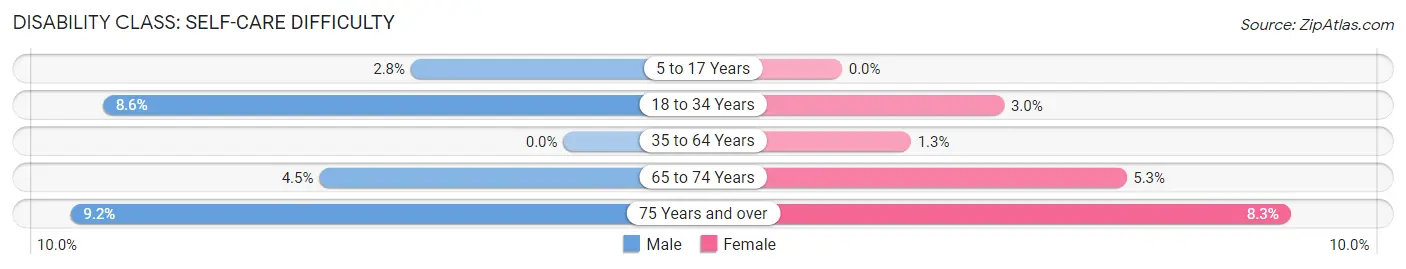
| Age Bracket | Male | Female |
| 5 to 17 Years | 24 (2.8%) | 0 (0.0%) |
| 18 to 34 Years | 70 (8.6%) | 18 (3.0%) |
| 35 to 64 Years | 0 (0.0%) | 15 (1.3%) |
| 65 to 74 Years | 16 (4.5%) | 15 (5.3%) |
| 75 Years and over | 15 (9.1%) | 15 (8.3%) |
Technology Access in Beaver County
Computing Device Access in Beaver County
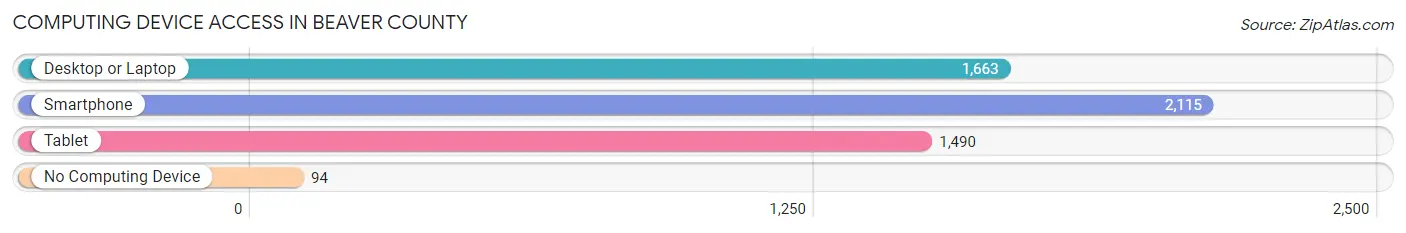
| Device Type | # Households | % Households |
| Desktop or Laptop | 1,663 | 72.6% |
| Smartphone | 2,115 | 92.4% |
| Tablet | 1,490 | 65.1% |
| No Computing Device | 94 | 4.1% |
| Total | 2,290 | 100.0% |
Internet Access in Beaver County
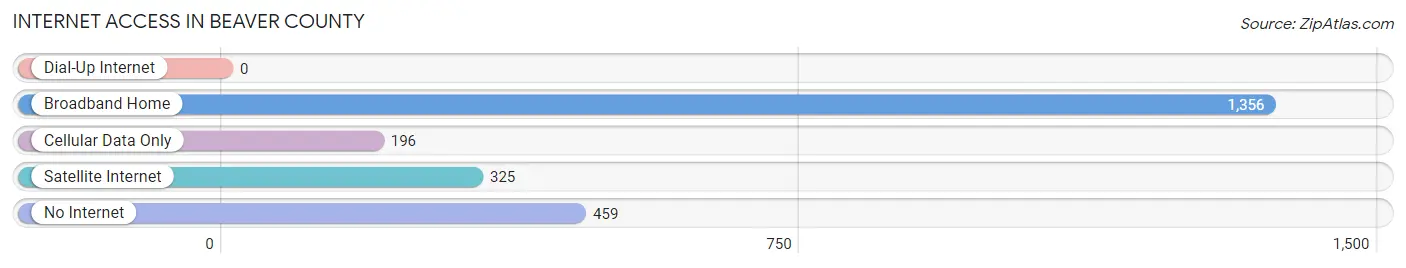
| Internet Type | # Households | % Households |
| Dial-Up Internet | 0 | 0.0% |
| Broadband Home | 1,356 | 59.2% |
| Cellular Data Only | 196 | 8.6% |
| Satellite Internet | 325 | 14.2% |
| No Internet | 459 | 20.0% |
| Total | 2,290 | 100.0% |
Beaver County Summary
Beaver County is located in the southwestern corner of Utah, and is bordered by Iron County to the north, Washington County to the east, and the Arizona state line to the south and west. The county seat is Beaver, and the largest city is Milford. The county has a total area of 2,592 square miles, of which 2,588 square miles is land and 4 square miles is water.
Geography
Beaver County is located in the Great Basin region of the United States, and is characterized by its high desert terrain. The county is home to the Tushar Mountains, which are part of the larger Wasatch Range. The highest point in the county is 11,322 feet at Delano Peak in the Tushar Mountains. The county is also home to the Beaver River, which flows through the county from east to west.
The climate of Beaver County is semi-arid, with hot summers and cold winters. The average annual precipitation is 8.5 inches, with most of the precipitation occurring in the winter months.
Economy
The economy of Beaver County is largely based on agriculture and mining. The county is home to several large cattle ranches, and is also a major producer of hay, alfalfa, and other crops. Mining is also an important part of the county’s economy, with copper, gold, and silver being mined in the area.
The county is also home to several manufacturing companies, including a large paper mill in Milford. Tourism is also an important part of the county’s economy, with visitors coming to the area to enjoy the scenic beauty of the Tushar Mountains and the nearby national parks.
Demographics
As of the 2010 census, the population of Beaver County was 6,629. The population is largely white (94.3%), with small percentages of Native American (2.2%), Hispanic (1.7%), and African American (0.7%) residents. The median household income in the county is $41,945, and the median age is 37.
Conclusion
Beaver County is a rural county located in the southwestern corner of Utah. The county is characterized by its high desert terrain and its agricultural and mining economy. The population of the county is largely white, and the median household income is $41,945. The county is home to several large cattle ranches, and is also a major producer of hay, alfalfa, and other crops. Mining is also an important part of the county’s economy, with copper, gold, and silver being mined in the area. Tourism is also an important part of the county’s economy, with visitors coming to the area to enjoy the scenic beauty of the Tushar Mountains and the nearby national parks.
Common Questions
What is the Total Population of Beaver County?
Total Population of Beaver County is 7,102.
What is the Total Male Population of Beaver County?
Total Male Population of Beaver County is 3,814.
What is the Total Female Population of Beaver County?
Total Female Population of Beaver County is 3,288.
What is the Ratio of Males per 100 Females in Beaver County?
There are 116.00 Males per 100 Females in Beaver County.
What is the Ratio of Females per 100 Males in Beaver County?
There are 86.21 Females per 100 Males in Beaver County.
What is the Median Population Age in Beaver County?
Median Population Age in Beaver County is 33.8 Years.
What is the Average Family Size in Beaver County
Average Family Size in Beaver County is 3.4 People.
What is the Average Household Size in Beaver County
Average Household Size in Beaver County is 3.0 People.
What is Per Capita Income in Beaver County?
Per Capita income in Beaver County is $28,176.
What is the Median Family Income in Beaver County?
Median Family Income in Beaver County is $86,524.
What is the Median Household income in Beaver County?
Median Household Income in Beaver County is $80,268.
What is Income or Wage Gap in Beaver County?
Income or Wage Gap in Beaver County is 53.9%.
Women in Beaver County earn 46.1 cents for every dollar earned by a man.
What is Inequality or Gini Index in Beaver County?
Inequality or Gini Index in Beaver County is 0.33.
How Large is the Labor Force in Beaver County?
There are 3,183 People in the Labor Forcein in Beaver County.
What is the Percentage of People in the Labor Force in Beaver County?
61.5% of People are in the Labor Force in Beaver County.
What is the Unemployment Rate in Beaver County?
Unemployment Rate in Beaver County is 3.6%.