Boulder, UT
Boulder Map
Boulder Overview
352
TOTAL POPULATION
123
MALE POPULATION
229
FEMALE POPULATION
53.71
MALES / 100 FEMALES
186.18
FEMALES / 100 MALES
42.6
MEDIAN AGE
3.0
AVG FAMILY SIZE
2.4
AVG HOUSEHOLD SIZE
$29,328
PER CAPITA INCOME
$56,875
AVG FAMILY INCOME
$49,148
AVG HOUSEHOLD INCOME
0.51
INEQUALITY / GINI INDEX
126
LABOR FORCE [ PEOPLE ]
45.3%
PERCENT IN LABOR FORCE
10.3%
UNEMPLOYMENT RATE
Boulder Zip Codes
Boulder Area Codes
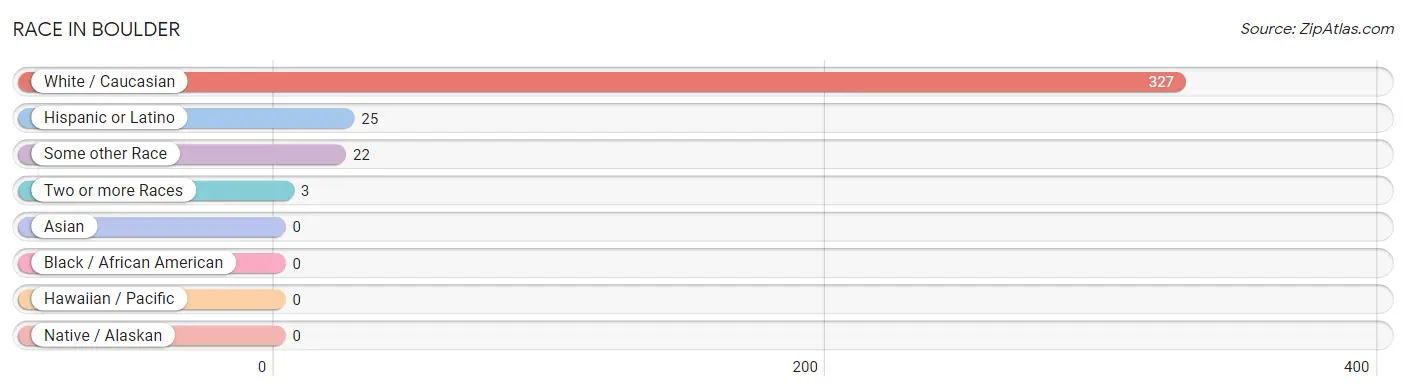
Race in Boulder
The most populous races in Boulder are White / Caucasian (327 | 92.9%), Hispanic or Latino (25 | 7.1%), and Some other Race (22 | 6.2%).
| Race | # Population | % Population |
| Asian | 0 | 0.0% |
| Black / African American | 0 | 0.0% |
| Hawaiian / Pacific | 0 | 0.0% |
| Hispanic or Latino | 25 | 7.1% |
| Native / Alaskan | 0 | 0.0% |
| White / Caucasian | 327 | 92.9% |
| Two or more Races | 3 | 0.9% |
| Some other Race | 22 | 6.2% |
| Total | 352 | 100.0% |
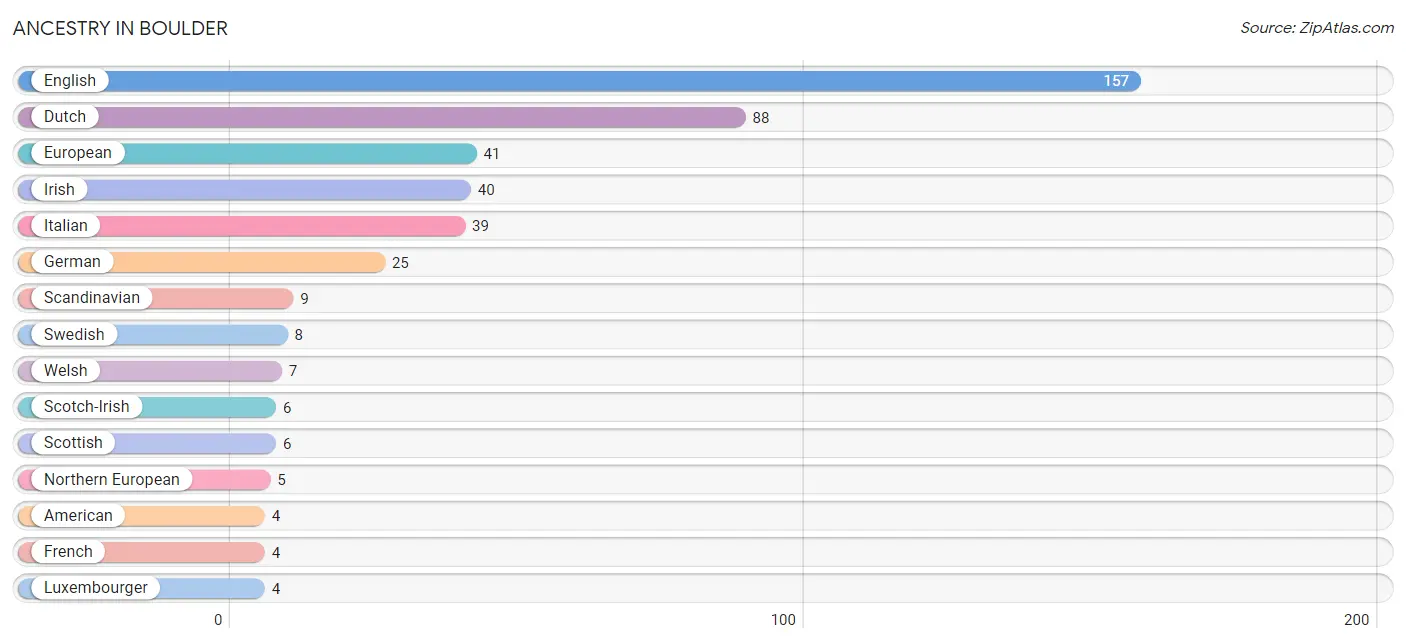
Ancestry in Boulder
The most populous ancestries reported in Boulder are English (157 | 44.6%), Dutch (88 | 25.0%), European (41 | 11.7%), Irish (40 | 11.4%), and Italian (39 | 11.1%), together accounting for 103.7% of all Boulder residents.
| Ancestry | # Population | % Population |
| American | 4 | 1.1% |
| Dutch | 88 | 25.0% |
| English | 157 | 44.6% |
| European | 41 | 11.7% |
| French | 4 | 1.1% |
| German | 25 | 7.1% |
| Irish | 40 | 11.4% |
| Italian | 39 | 11.1% |
| Luxembourger | 4 | 1.1% |
| Mexican | 3 | 0.9% |
| Northern European | 5 | 1.4% |
| Polish | 3 | 0.9% |
| Scandinavian | 9 | 2.6% |
| Scotch-Irish | 6 | 1.7% |
| Scottish | 6 | 1.7% |
| Slovene | 3 | 0.9% |
| Swedish | 8 | 2.3% |
| Welsh | 7 | 2.0% | View All 18 Rows |
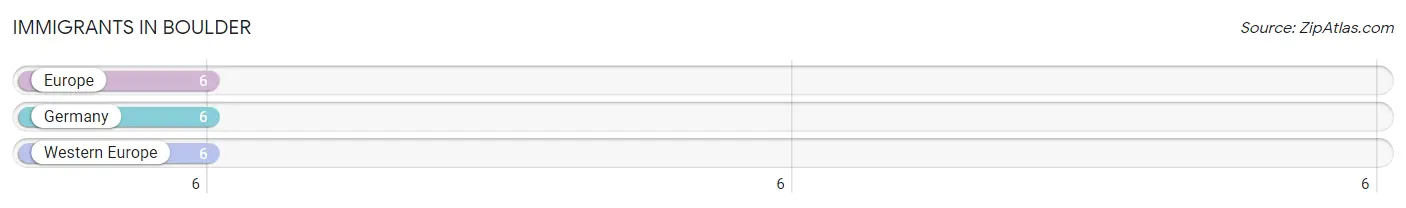
Immigrants in Boulder
The most numerous immigrant groups reported in Boulder came from Europe (6 | 1.7%), Germany (6 | 1.7%), and Western Europe (6 | 1.7%), together accounting for 5.1% of all Boulder residents.
| Immigration Origin | # Population | % Population |
| Europe | 6 | 1.7% |
| Germany | 6 | 1.7% |
| Western Europe | 6 | 1.7% | View All 3 Rows |
Sex and Age in Boulder
Sex and Age in Boulder
The most populous age groups in Boulder are 65 to 69 Years (31 | 25.2%) for men and 5 to 9 Years (38 | 16.6%) for women.
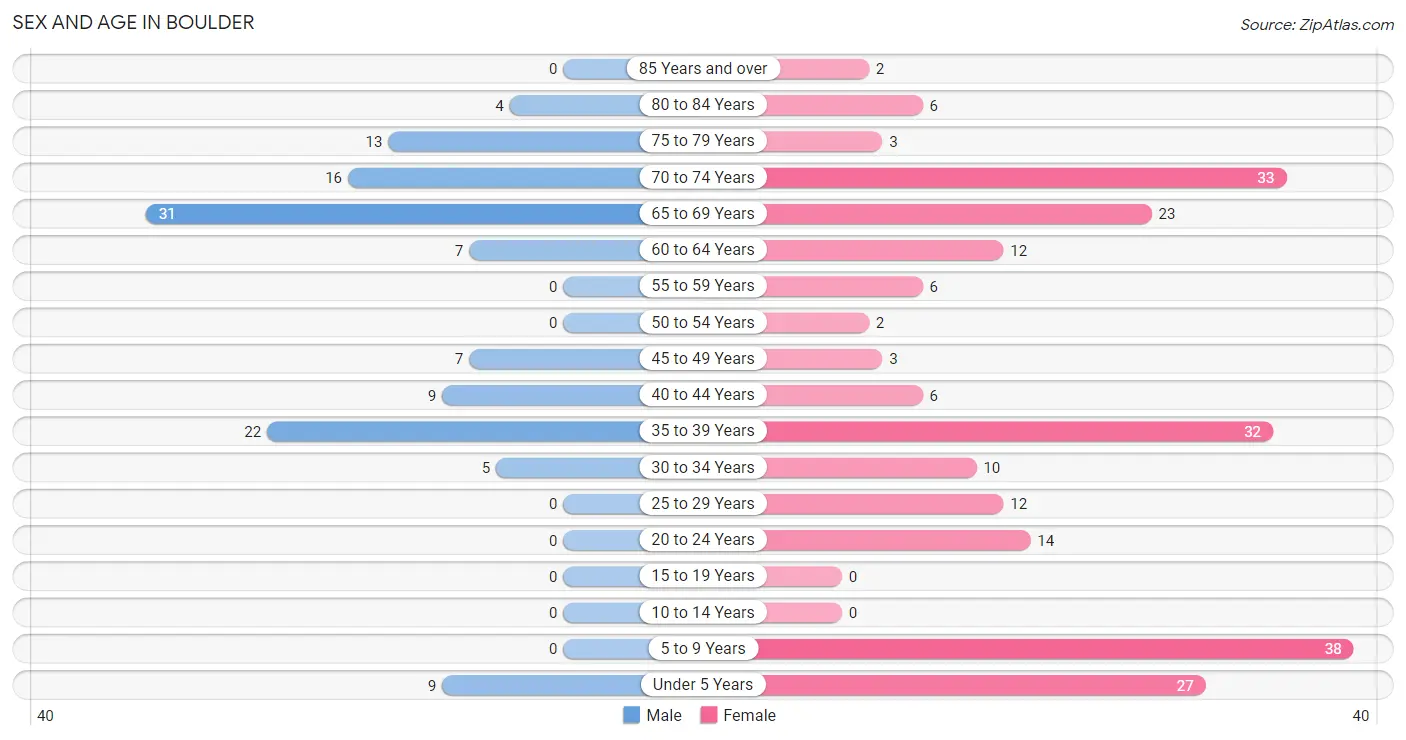
| Age Bracket | Male | Female |
| Under 5 Years | 9 (7.3%) | 27 (11.8%) |
| 5 to 9 Years | 0 (0.0%) | 38 (16.6%) |
| 10 to 14 Years | 0 (0.0%) | 0 (0.0%) |
| 15 to 19 Years | 0 (0.0%) | 0 (0.0%) |
| 20 to 24 Years | 0 (0.0%) | 14 (6.1%) |
| 25 to 29 Years | 0 (0.0%) | 12 (5.2%) |
| 30 to 34 Years | 5 (4.1%) | 10 (4.4%) |
| 35 to 39 Years | 22 (17.9%) | 32 (14.0%) |
| 40 to 44 Years | 9 (7.3%) | 6 (2.6%) |
| 45 to 49 Years | 7 (5.7%) | 3 (1.3%) |
| 50 to 54 Years | 0 (0.0%) | 2 (0.9%) |
| 55 to 59 Years | 0 (0.0%) | 6 (2.6%) |
| 60 to 64 Years | 7 (5.7%) | 12 (5.2%) |
| 65 to 69 Years | 31 (25.2%) | 23 (10.0%) |
| 70 to 74 Years | 16 (13.0%) | 33 (14.4%) |
| 75 to 79 Years | 13 (10.6%) | 3 (1.3%) |
| 80 to 84 Years | 4 (3.3%) | 6 (2.6%) |
| 85 Years and over | 0 (0.0%) | 2 (0.9%) |
| Total | 123 (100.0%) | 229 (100.0%) |
Families and Households in Boulder
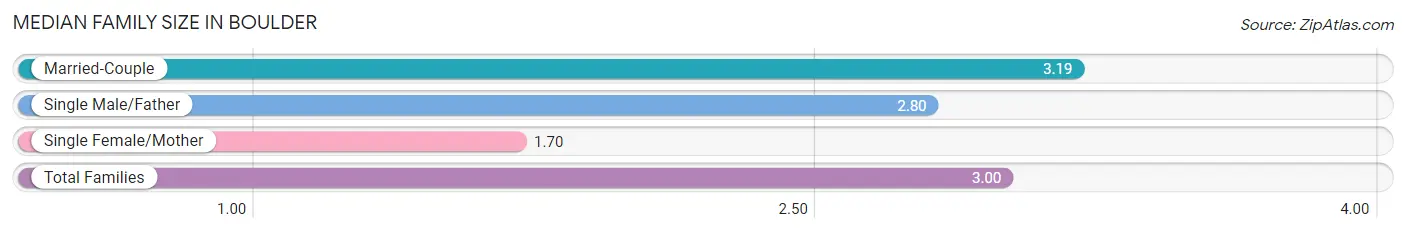
Median Family Size in Boulder
The median family size in Boulder is 3.00 persons per family, with married-couple families (74 | 83.2%) accounting for the largest median family size of 3.19 persons per family. On the other hand, single female/mother families (10 | 11.2%) represent the smallest median family size with 1.70 persons per family.
| Family Type | # Families | Family Size |
| Married-Couple | 74 (83.2%) | 3.19 |
| Single Male/Father | 5 (5.6%) | 2.80 |
| Single Female/Mother | 10 (11.2%) | 1.70 |
| Total Families | 89 (100.0%) | 3.00 |
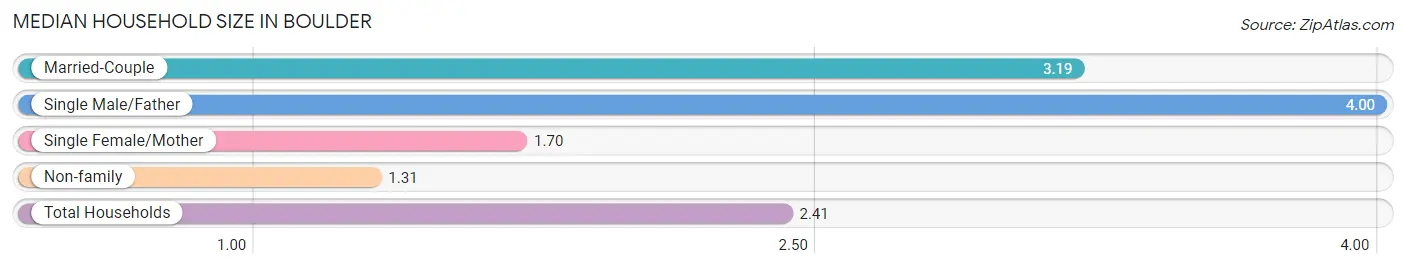
Median Household Size in Boulder
The median household size in Boulder is 2.41 persons per household, with single male/father households (5 | 3.5%) accounting for the largest median household size of 4 persons per household. non-family households (54 | 37.8%) represent the smallest median household size with 1.31 persons per household.
| Household Type | # Households | Household Size |
| Married-Couple | 74 (51.7%) | 3.19 |
| Single Male/Father | 5 (3.5%) | 4.00 |
| Single Female/Mother | 10 (7.0%) | 1.70 |
| Non-family | 54 (37.8%) | 1.31 |
| Total Households | 143 (100.0%) | 2.41 |
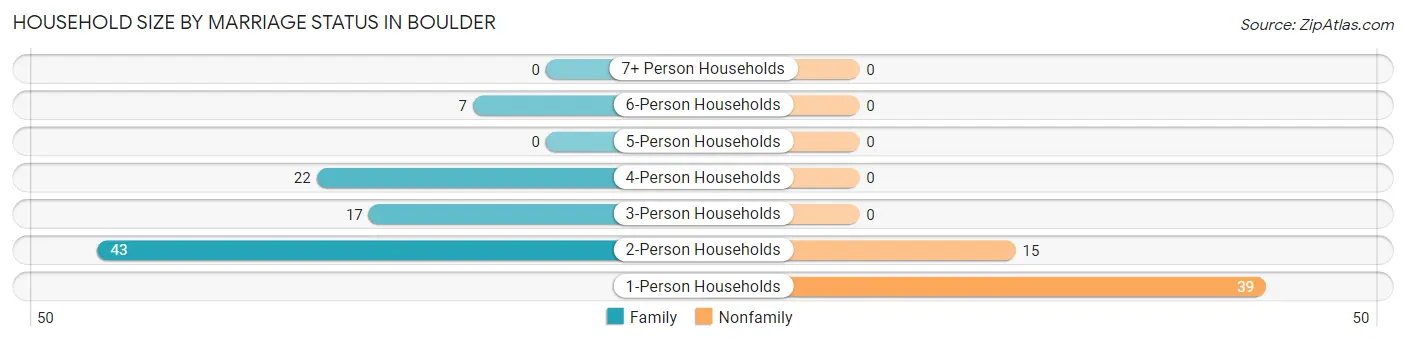
Household Size by Marriage Status in Boulder
Out of a total of 143 households in Boulder, 89 (62.2%) are family households, while 54 (37.8%) are nonfamily households. The most numerous type of family households are 2-person households, comprising 43, and the most common type of nonfamily households are 1-person households, comprising 39.
| Household Size | Family Households | Nonfamily Households |
| 1-Person Households | - | 39 (27.3%) |
| 2-Person Households | 43 (30.1%) | 15 (10.5%) |
| 3-Person Households | 17 (11.9%) | 0 (0.0%) |
| 4-Person Households | 22 (15.4%) | 0 (0.0%) |
| 5-Person Households | 0 (0.0%) | 0 (0.0%) |
| 6-Person Households | 7 (4.9%) | 0 (0.0%) |
| 7+ Person Households | 0 (0.0%) | 0 (0.0%) |
| Total | 89 (62.2%) | 54 (37.8%) |
Female Fertility in Boulder
Fertility by Age in Boulder
| Age Bracket | Women with Births | Births / 1,000 Women |
| 15 to 19 years | 0 (0.0%) | 0.0 |
| 20 to 34 years | 0 (0.0%) | 0.0 |
| 35 to 50 years | 0 (0.0%) | 0.0 |
| Total | 0 (0.0%) | 0.0 |
Fertility by Age by Marriage Status in Boulder
| Age Bracket | Married | Unmarried |
| 15 to 19 years | 0 (0.0%) | 0 (0.0%) |
| 20 to 34 years | 0 (0.0%) | 0 (0.0%) |
| 35 to 50 years | 0 (0.0%) | 0 (0.0%) |
| Total | 0 (0.0%) | 0 (0.0%) |
Fertility by Education in Boulder
| Educational Attainment | Women with Births | Births / 1,000 Women |
| Less than High School | 0 (0.0%) | 0.0 |
| High School Diploma | 0 (0.0%) | 0.0 |
| College or Associate's Degree | 0 (0.0%) | 0.0 |
| Bachelor's Degree | 0 (0.0%) | 0.0 |
| Graduate Degree | 0 (0.0%) | 0.0 |
| Total | 0 (0.0%) | 0.0 |
Fertility by Education by Marriage Status in Boulder
| Educational Attainment | Married | Unmarried |
| Less than High School | 0 (0.0%) | 0 (0.0%) |
| High School Diploma | 0 (0.0%) | 0 (0.0%) |
| College or Associate's Degree | 0 (0.0%) | 0 (0.0%) |
| Bachelor's Degree | 0 (0.0%) | 0 (0.0%) |
| Graduate Degree | 0 (0.0%) | 0 (0.0%) |
| Total | 0 (0.0%) | 0 (0.0%) |
Income in Boulder
Income Overview in Boulder
Per Capita Income in Boulder is $29,328, while median incomes of families and households are $56,875 and $49,148 respectively.
| Characteristic | Number | Measure |
| Per Capita Income | 352 | $29,328 |
| Median Family Income | 89 | $56,875 |
| Mean Family Income | 89 | $92,437 |
| Median Household Income | 143 | $49,148 |
| Mean Household Income | 143 | $73,143 |
| Income Deficit | 89 | $0 |
| Wage / Income Gap (%) | 352 | 0.00% |
| Wage / Income Gap ($) | 352 | 100.00¢ per $1 |
| Gini / Inequality Index | 352 | 0.51 |
Earnings by Sex in Boulder
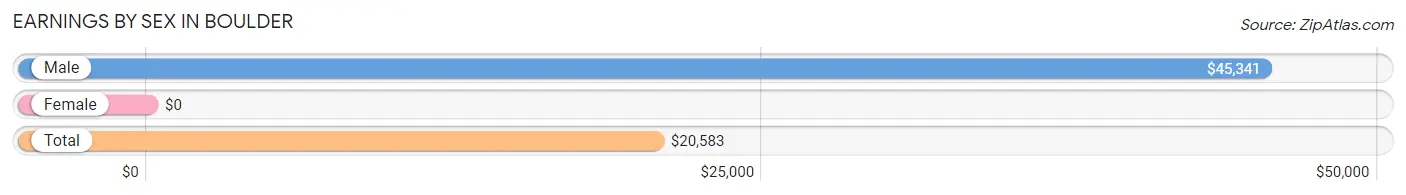
| Sex | Number | Average Earnings |
| Male | 60 (34.3%) | $45,341 |
| Female | 115 (65.7%) | $0 |
| Total | 175 (100.0%) | $20,583 |
Earnings by Sex by Income Bracket in Boulder
The most common earnings brackets in Boulder are $45,000 to $49,999 for men (22 | 36.7%) and $2,500 to $4,999 for women (32 | 27.8%).
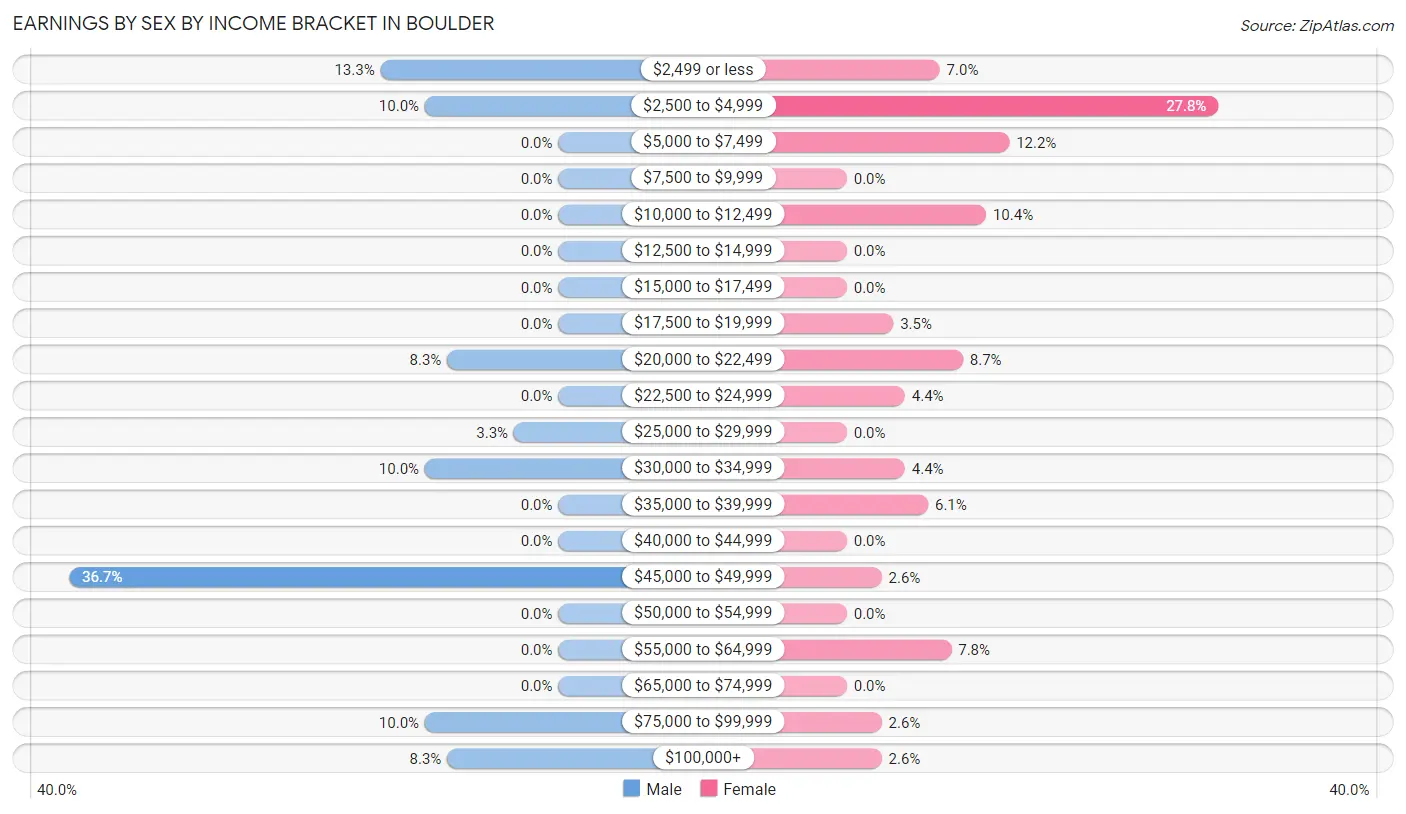
| Income | Male | Female |
| $2,499 or less | 8 (13.3%) | 8 (7.0%) |
| $2,500 to $4,999 | 6 (10.0%) | 32 (27.8%) |
| $5,000 to $7,499 | 0 (0.0%) | 14 (12.2%) |
| $7,500 to $9,999 | 0 (0.0%) | 0 (0.0%) |
| $10,000 to $12,499 | 0 (0.0%) | 12 (10.4%) |
| $12,500 to $14,999 | 0 (0.0%) | 0 (0.0%) |
| $15,000 to $17,499 | 0 (0.0%) | 0 (0.0%) |
| $17,500 to $19,999 | 0 (0.0%) | 4 (3.5%) |
| $20,000 to $22,499 | 5 (8.3%) | 10 (8.7%) |
| $22,500 to $24,999 | 0 (0.0%) | 5 (4.3%) |
| $25,000 to $29,999 | 2 (3.3%) | 0 (0.0%) |
| $30,000 to $34,999 | 6 (10.0%) | 5 (4.3%) |
| $35,000 to $39,999 | 0 (0.0%) | 7 (6.1%) |
| $40,000 to $44,999 | 0 (0.0%) | 0 (0.0%) |
| $45,000 to $49,999 | 22 (36.7%) | 3 (2.6%) |
| $50,000 to $54,999 | 0 (0.0%) | 0 (0.0%) |
| $55,000 to $64,999 | 0 (0.0%) | 9 (7.8%) |
| $65,000 to $74,999 | 0 (0.0%) | 0 (0.0%) |
| $75,000 to $99,999 | 6 (10.0%) | 3 (2.6%) |
| $100,000+ | 5 (8.3%) | 3 (2.6%) |
| Total | 60 (100.0%) | 115 (100.0%) |
Earnings by Sex by Educational Attainment in Boulder
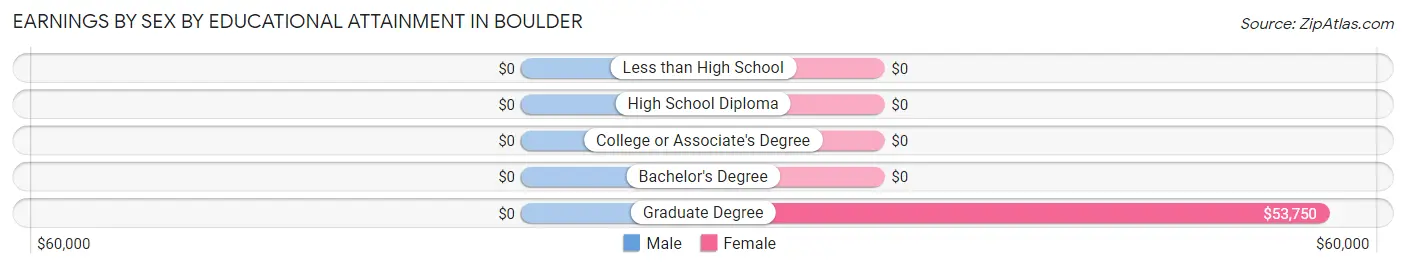
| Educational Attainment | Male Income | Female Income |
| Less than High School | - | - |
| High School Diploma | - | - |
| College or Associate's Degree | - | - |
| Bachelor's Degree | - | - |
| Graduate Degree | - | - |
| Total | $45,341 | $0 |
Family Income in Boulder
Family Income Brackets in Boulder
According to the Boulder family income data, there are 25 families falling into the $35,000 to $49,999 income range, which is the most common income bracket and makes up 28.1% of all families.
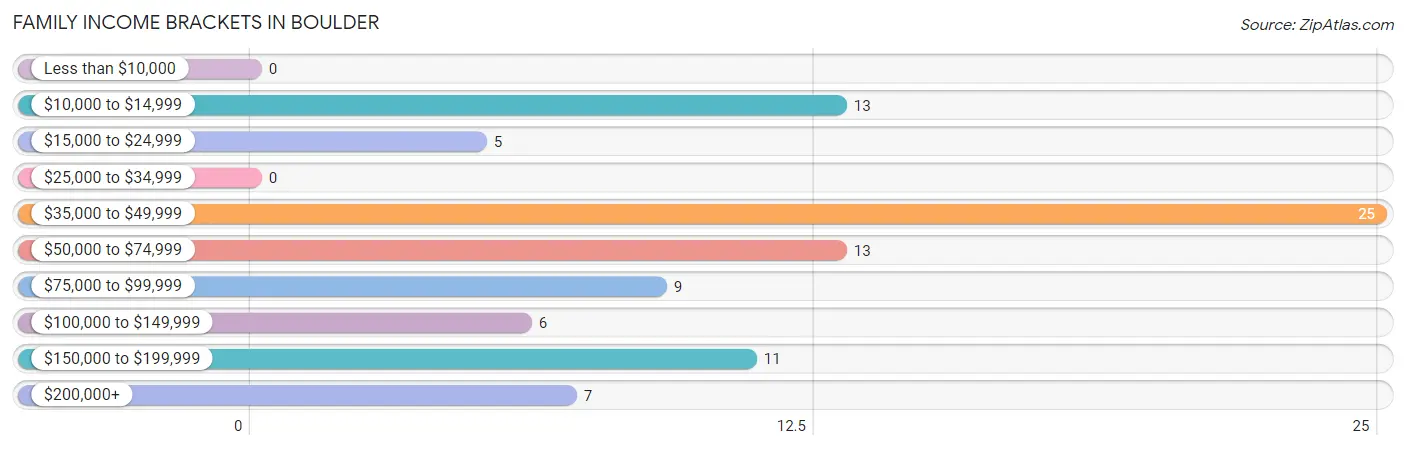
| Income Bracket | # Families | % Families |
| Less than $10,000 | 0 | 0.0% |
| $10,000 to $14,999 | 13 | 14.6% |
| $15,000 to $24,999 | 5 | 5.6% |
| $25,000 to $34,999 | 0 | 0.0% |
| $35,000 to $49,999 | 25 | 28.1% |
| $50,000 to $74,999 | 13 | 14.6% |
| $75,000 to $99,999 | 9 | 10.1% |
| $100,000 to $149,999 | 6 | 6.7% |
| $150,000 to $199,999 | 11 | 12.4% |
| $200,000+ | 7 | 7.9% |
Family Income by Famaliy Size in Boulder
2-person families (48 | 53.9%) account for the highest median family income in Boulder with $93,750 per family, while 2-person families (48 | 53.9%) have the highest median income of $46,875 per family member.
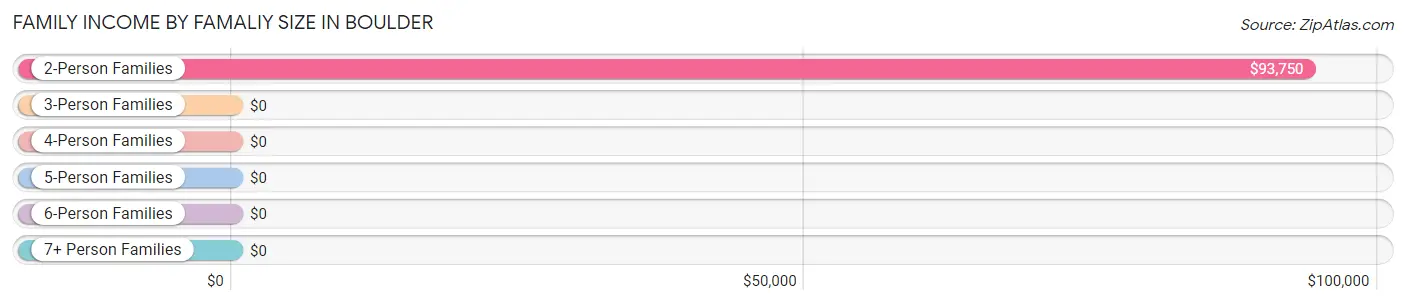
| Income Bracket | # Families | Median Income |
| 2-Person Families | 48 (53.9%) | $93,750 |
| 3-Person Families | 12 (13.5%) | $0 |
| 4-Person Families | 22 (24.7%) | $0 |
| 5-Person Families | 0 (0.0%) | $0 |
| 6-Person Families | 7 (7.9%) | $0 |
| 7+ Person Families | 0 (0.0%) | $0 |
| Total | 89 (100.0%) | $56,875 |
Family Income by Number of Earners in Boulder
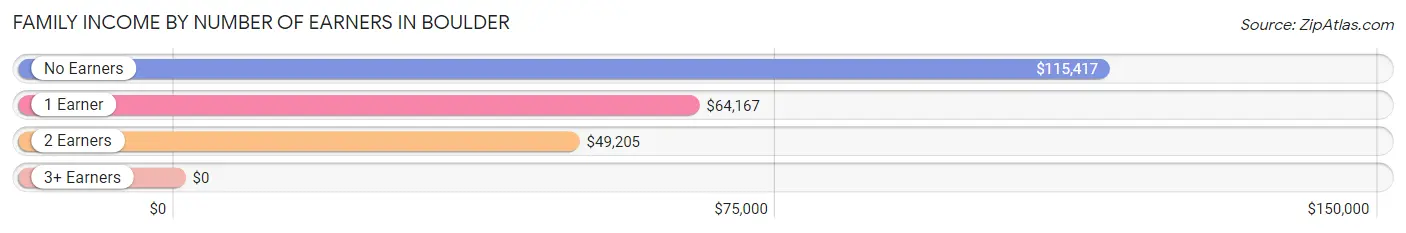
| Number of Earners | # Families | Median Income |
| No Earners | 11 (12.4%) | $115,417 |
| 1 Earner | 38 (42.7%) | $64,167 |
| 2 Earners | 40 (44.9%) | $49,205 |
| 3+ Earners | 0 (0.0%) | $0 |
| Total | 89 (100.0%) | $56,875 |
Household Income in Boulder
Household Income Brackets in Boulder
With 31 households falling in the category, the $35,000 to $49,999 income range is the most frequent in Boulder, accounting for 21.7% of all households. In contrast, only 6 households (4.2%) fall into the $100,000 to $149,999 income bracket, making it the least populous group.
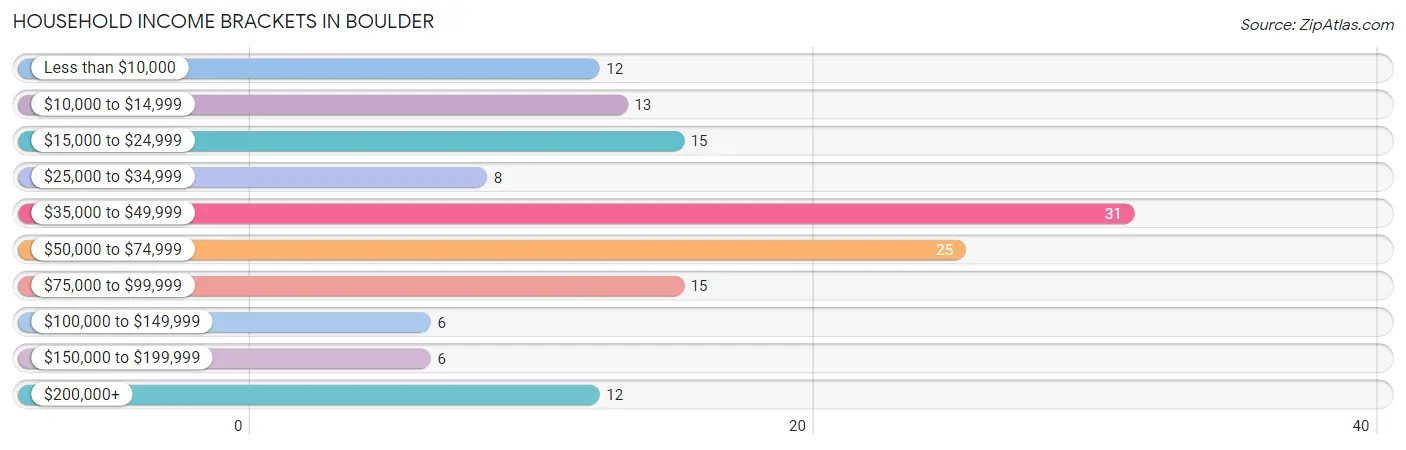
| Income Bracket | # Households | % Households |
| Less than $10,000 | 12 | 8.4% |
| $10,000 to $14,999 | 13 | 9.1% |
| $15,000 to $24,999 | 15 | 10.5% |
| $25,000 to $34,999 | 8 | 5.6% |
| $35,000 to $49,999 | 31 | 21.7% |
| $50,000 to $74,999 | 25 | 17.5% |
| $75,000 to $99,999 | 15 | 10.5% |
| $100,000 to $149,999 | 6 | 4.2% |
| $150,000 to $199,999 | 6 | 4.2% |
| $200,000+ | 12 | 8.4% |
Household Income by Householder Age in Boulder
The median household income in Boulder is $49,148, with the highest median household income of $50,000 found in the 65+ years age bracket for the primary householder. A total of 82 households (57.3%) fall into this category. Meanwhile, the 15 to 24 years age bracket for the primary householder has the lowest median household income of $0, with 3 households (2.1%) in this group.
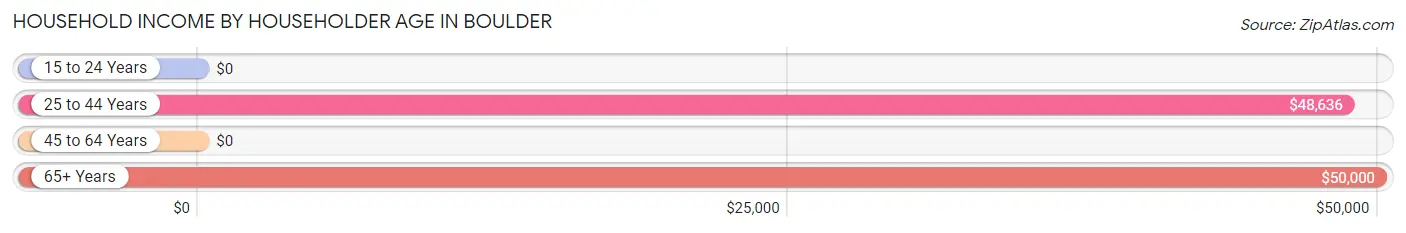
| Income Bracket | # Households | Median Income |
| 15 to 24 Years | 3 (2.1%) | $0 |
| 25 to 44 Years | 34 (23.8%) | $48,636 |
| 45 to 64 Years | 24 (16.8%) | $0 |
| 65+ Years | 82 (57.3%) | $50,000 |
| Total | 143 (100.0%) | $49,148 |
Poverty in Boulder
Income Below Poverty by Sex and Age in Boulder
With 17.9% poverty level for males and 9.2% for females among the residents of Boulder, 65 to 74 year old males and 45 to 54 year old females are the most vulnerable to poverty, with 15 males (31.9%) and 2 females (40.0%) in their respective age groups living below the poverty level.
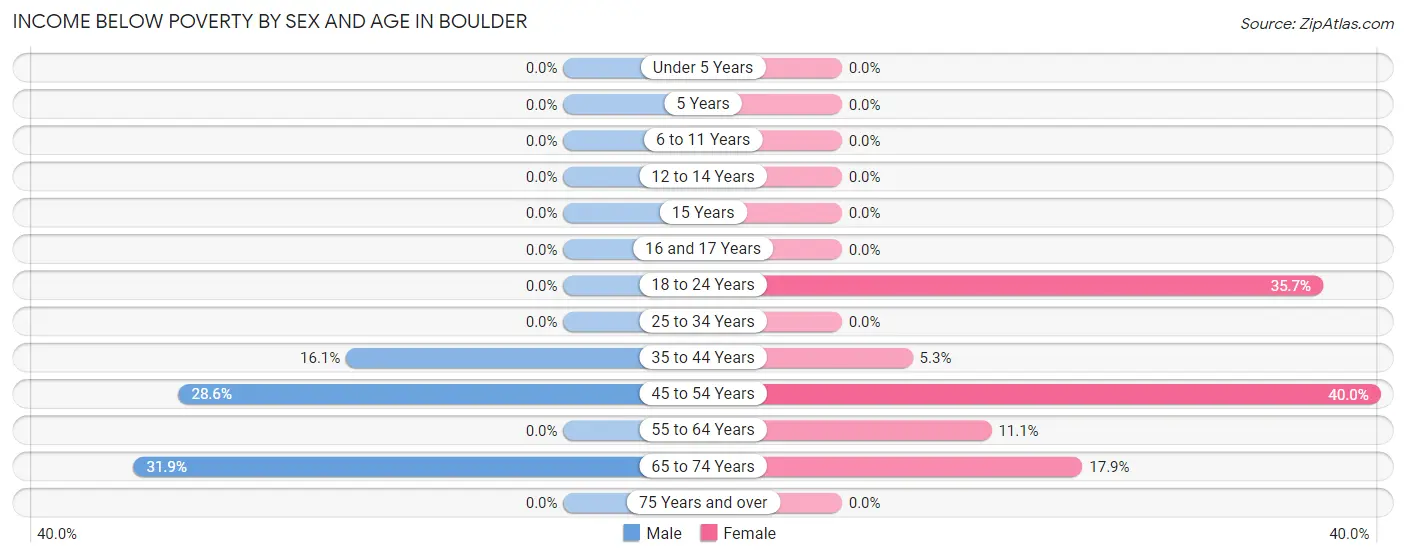
| Age Bracket | Male | Female |
| Under 5 Years | 0 (0.0%) | 0 (0.0%) |
| 5 Years | 0 (0.0%) | 0 (0.0%) |
| 6 to 11 Years | 0 (0.0%) | 0 (0.0%) |
| 12 to 14 Years | 0 (0.0%) | 0 (0.0%) |
| 15 Years | 0 (0.0%) | 0 (0.0%) |
| 16 and 17 Years | 0 (0.0%) | 0 (0.0%) |
| 18 to 24 Years | 0 (0.0%) | 5 (35.7%) |
| 25 to 34 Years | 0 (0.0%) | 0 (0.0%) |
| 35 to 44 Years | 5 (16.1%) | 2 (5.3%) |
| 45 to 54 Years | 2 (28.6%) | 2 (40.0%) |
| 55 to 64 Years | 0 (0.0%) | 2 (11.1%) |
| 65 to 74 Years | 15 (31.9%) | 10 (17.9%) |
| 75 Years and over | 0 (0.0%) | 0 (0.0%) |
| Total | 22 (17.9%) | 21 (9.2%) |
Income Above Poverty by Sex and Age in Boulder
According to the poverty statistics in Boulder, males aged under 5 years and females aged under 5 years are the age groups that are most secure financially, with 100.0% of males and 100.0% of females in these age groups living above the poverty line.
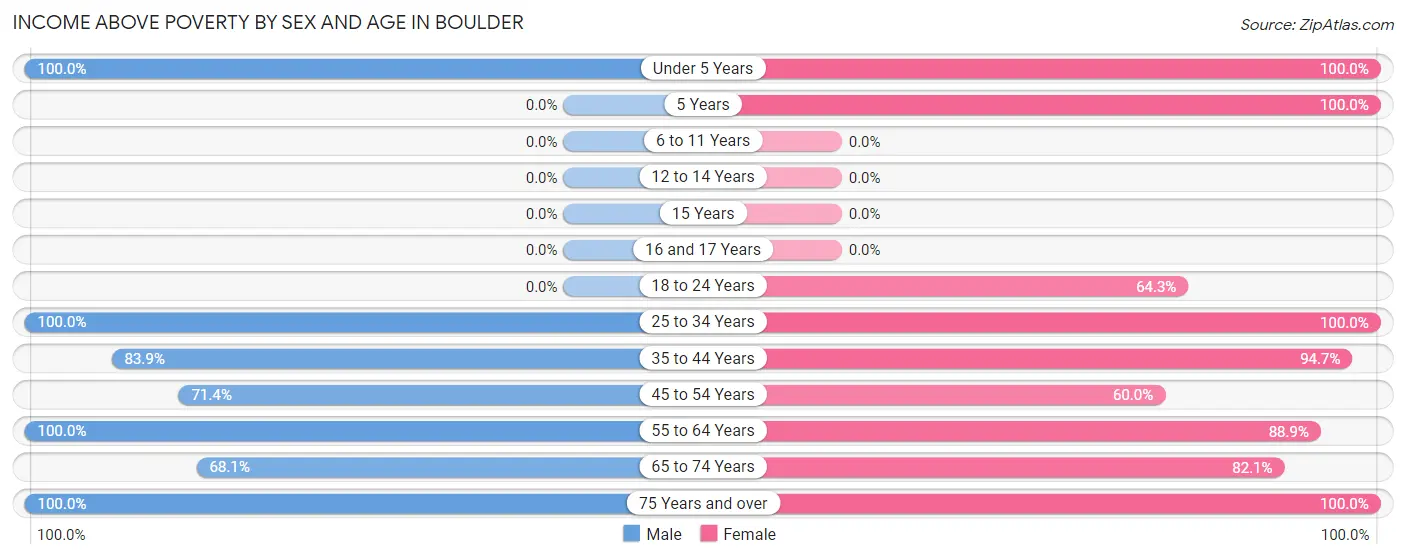
| Age Bracket | Male | Female |
| Under 5 Years | 9 (100.0%) | 27 (100.0%) |
| 5 Years | 0 (0.0%) | 38 (100.0%) |
| 6 to 11 Years | 0 (0.0%) | 0 (0.0%) |
| 12 to 14 Years | 0 (0.0%) | 0 (0.0%) |
| 15 Years | 0 (0.0%) | 0 (0.0%) |
| 16 and 17 Years | 0 (0.0%) | 0 (0.0%) |
| 18 to 24 Years | 0 (0.0%) | 9 (64.3%) |
| 25 to 34 Years | 5 (100.0%) | 22 (100.0%) |
| 35 to 44 Years | 26 (83.9%) | 36 (94.7%) |
| 45 to 54 Years | 5 (71.4%) | 3 (60.0%) |
| 55 to 64 Years | 7 (100.0%) | 16 (88.9%) |
| 65 to 74 Years | 32 (68.1%) | 46 (82.1%) |
| 75 Years and over | 17 (100.0%) | 11 (100.0%) |
| Total | 101 (82.1%) | 208 (90.8%) |
Income Below Poverty Among Married-Couple Families in Boulder
The poverty statistics for married-couple families in Boulder show that 4.1% or 3 of the total 74 families live below the poverty line. Families with no children have the highest poverty rate of 6.7%, comprising of 3 families. On the other hand, families with 1 or 2 children have the lowest poverty rate of 0.0%, which includes 0 families.
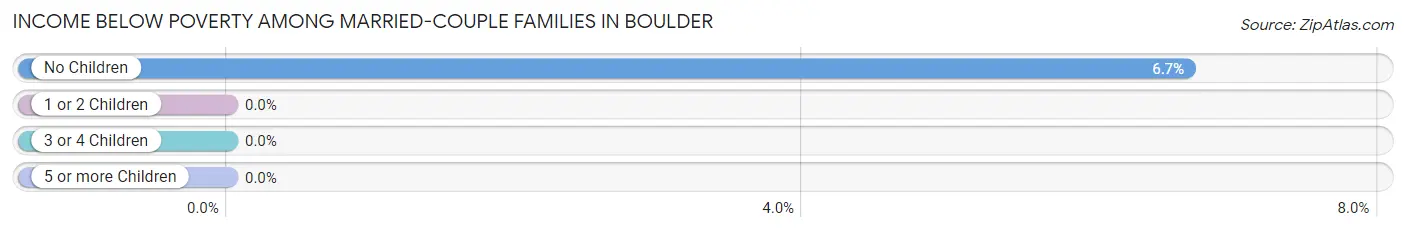
| Children | Above Poverty | Below Poverty |
| No Children | 42 (93.3%) | 3 (6.7%) |
| 1 or 2 Children | 29 (100.0%) | 0 (0.0%) |
| 3 or 4 Children | 0 (0.0%) | 0 (0.0%) |
| 5 or more Children | 0 (0.0%) | 0 (0.0%) |
| Total | 71 (96.0%) | 3 (4.1%) |
Income Below Poverty Among Single-Parent Households in Boulder
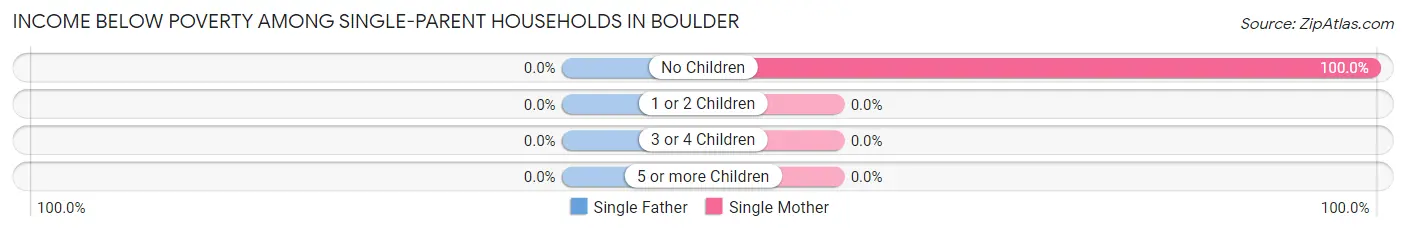
| Children | Single Father | Single Mother |
| No Children | 0 (0.0%) | 10 (100.0%) |
| 1 or 2 Children | 0 (0.0%) | 0 (0.0%) |
| 3 or 4 Children | 0 (0.0%) | 0 (0.0%) |
| 5 or more Children | 0 (0.0%) | 0 (0.0%) |
| Total | 0 (0.0%) | 10 (100.0%) |
Income Below Poverty Among Married-Couple vs Single-Parent Households in Boulder
The poverty data for Boulder shows that 3 of the married-couple family households (4.1%) and 10 of the single-parent households (66.7%) are living below the poverty level. Within the married-couple family households, those with no children have the highest poverty rate, with 3 households (6.7%) falling below the poverty line. Among the single-parent households, those with no children have the highest poverty rate, with 10 household (100.0%) living below poverty.
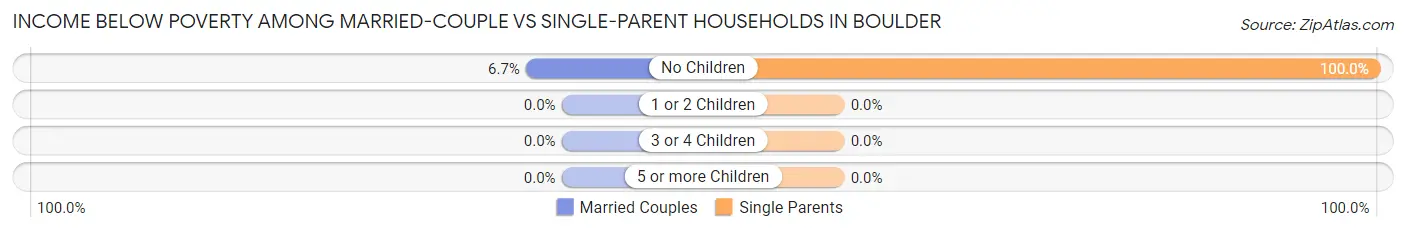
| Children | Married-Couple Families | Single-Parent Households |
| No Children | 3 (6.7%) | 10 (100.0%) |
| 1 or 2 Children | 0 (0.0%) | 0 (0.0%) |
| 3 or 4 Children | 0 (0.0%) | 0 (0.0%) |
| 5 or more Children | 0 (0.0%) | 0 (0.0%) |
| Total | 3 (4.1%) | 10 (66.7%) |
Employment Characteristics in Boulder
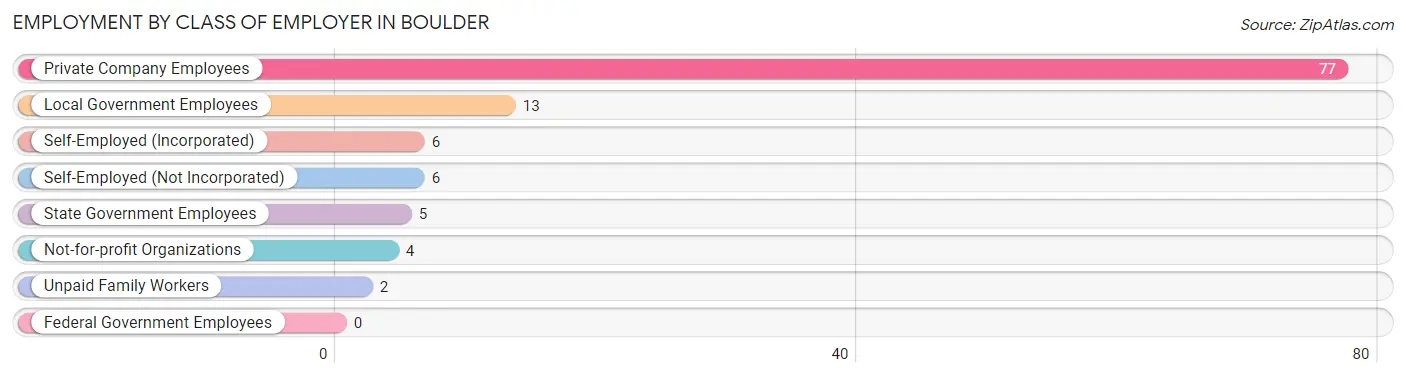
Employment by Class of Employer in Boulder
Among the 113 employed individuals in Boulder, private company employees (77 | 68.1%), local government employees (13 | 11.5%), and self-employed (incorporated) (6 | 5.3%) make up the most common classes of employment.
| Employer Class | # Employees | % Employees |
| Private Company Employees | 77 | 68.1% |
| Self-Employed (Incorporated) | 6 | 5.3% |
| Self-Employed (Not Incorporated) | 6 | 5.3% |
| Not-for-profit Organizations | 4 | 3.5% |
| Local Government Employees | 13 | 11.5% |
| State Government Employees | 5 | 4.4% |
| Federal Government Employees | 0 | 0.0% |
| Unpaid Family Workers | 2 | 1.8% |
| Total | 113 | 100.0% |
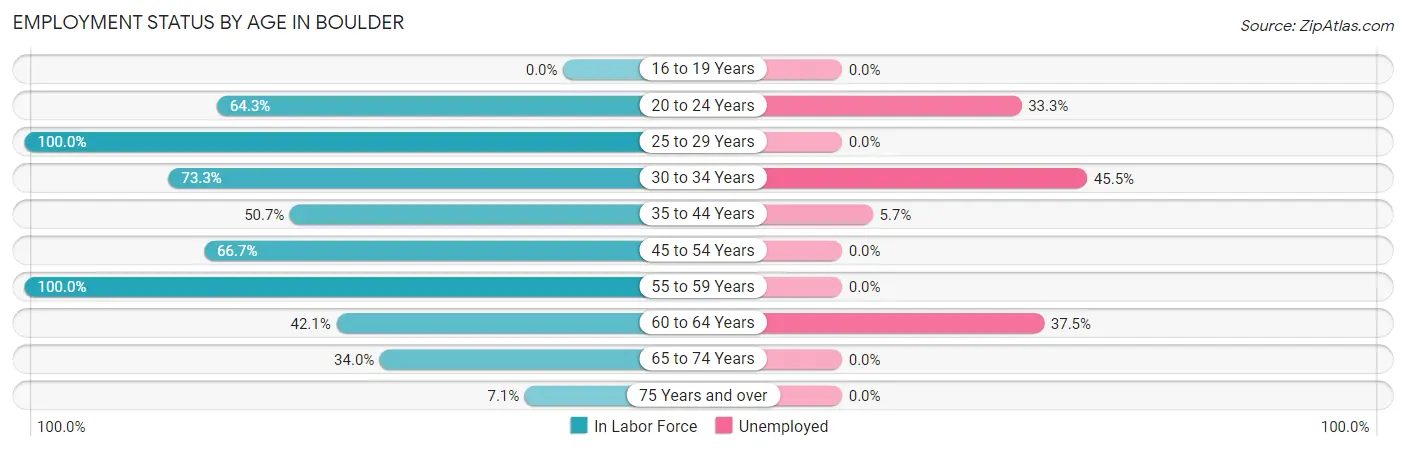
Employment Status by Age in Boulder
According to the labor force statistics for Boulder, out of the total population over 16 years of age (278), 45.3% or 126 individuals are in the labor force, with 10.3% or 13 of them unemployed. The age group with the highest labor force participation rate is 25 to 29 years, with 100.0% or 12 individuals in the labor force. Within the labor force, the 30 to 34 years age range has the highest percentage of unemployed individuals, with 45.5% or 5 of them being unemployed.
| Age Bracket | In Labor Force | Unemployed |
| 16 to 19 Years | 0 (0.0%) | 0 (0.0%) |
| 20 to 24 Years | 9 (64.3%) | 3 (33.3%) |
| 25 to 29 Years | 12 (100.0%) | 0 (0.0%) |
| 30 to 34 Years | 11 (73.3%) | 5 (45.5%) |
| 35 to 44 Years | 35 (50.7%) | 2 (5.7%) |
| 45 to 54 Years | 8 (66.7%) | 0 (0.0%) |
| 55 to 59 Years | 6 (100.0%) | 0 (0.0%) |
| 60 to 64 Years | 8 (42.1%) | 3 (37.5%) |
| 65 to 74 Years | 35 (34.0%) | 0 (0.0%) |
| 75 Years and over | 2 (7.1%) | 0 (0.0%) |
| Total | 126 (45.3%) | 13 (10.3%) |
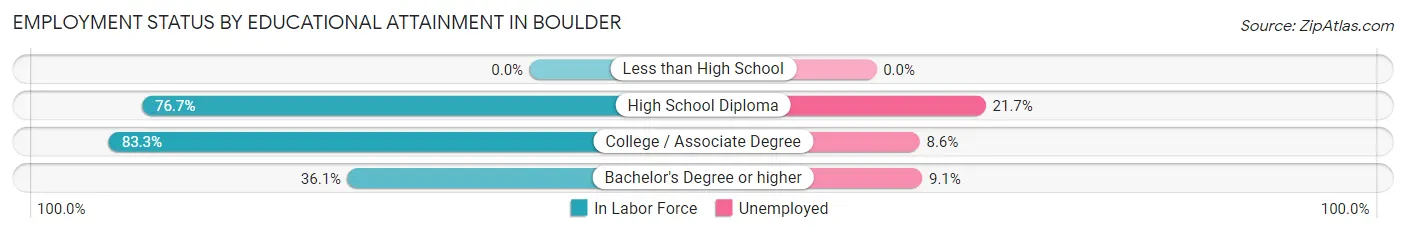
Employment Status by Educational Attainment in Boulder
According to labor force statistics for Boulder, 60.2% of individuals (80) out of the total population between 25 and 64 years of age (133) are in the labor force, with 12.5% or 10 of them being unemployed. The group with the highest labor force participation rate are those with the educational attainment of college / associate degree, with 83.3% or 35 individuals in the labor force. Within the labor force, individuals with high school diploma education have the highest percentage of unemployment, with 21.7% or 5 of them being unemployed.
| Educational Attainment | In Labor Force | Unemployed |
| Less than High School | 0 (0.0%) | 0 (0.0%) |
| High School Diploma | 23 (76.7%) | 7 (21.7%) |
| College / Associate Degree | 35 (83.3%) | 4 (8.6%) |
| Bachelor's Degree or higher | 22 (36.1%) | 6 (9.1%) |
| Total | 80 (60.2%) | 17 (12.5%) |
Employment Occupations by Sex in Boulder
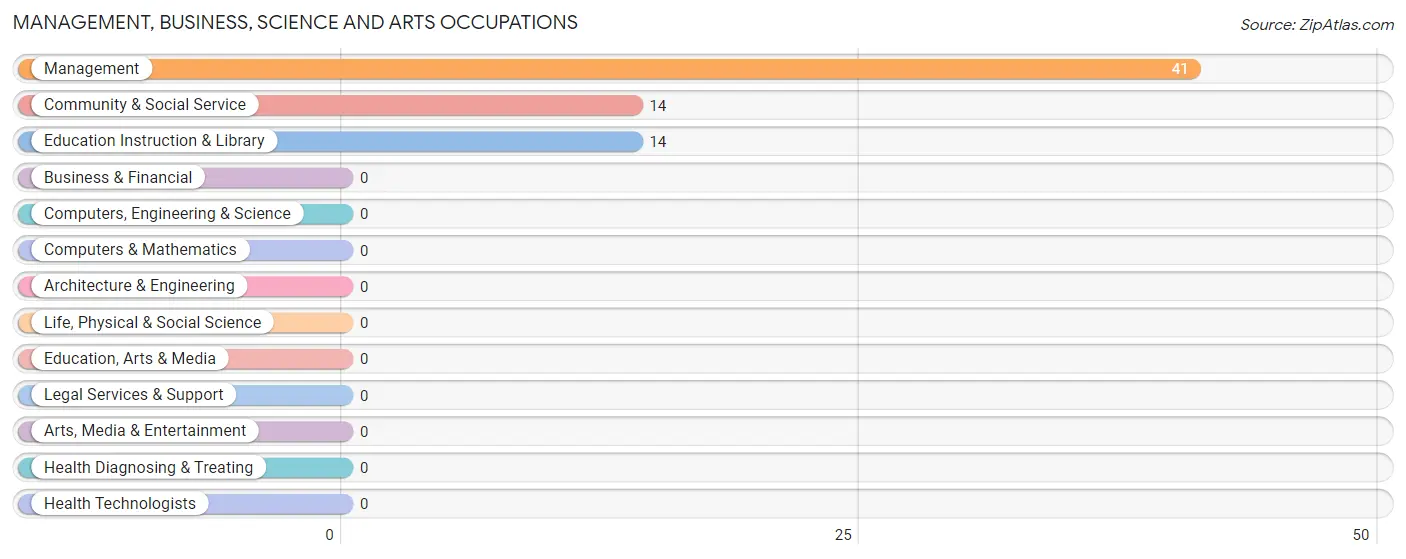
Management, Business, Science and Arts Occupations
The most common Management, Business, Science and Arts occupations in Boulder are Management (41 | 36.3%), Community & Social Service (14 | 12.4%), and Education Instruction & Library (14 | 12.4%).
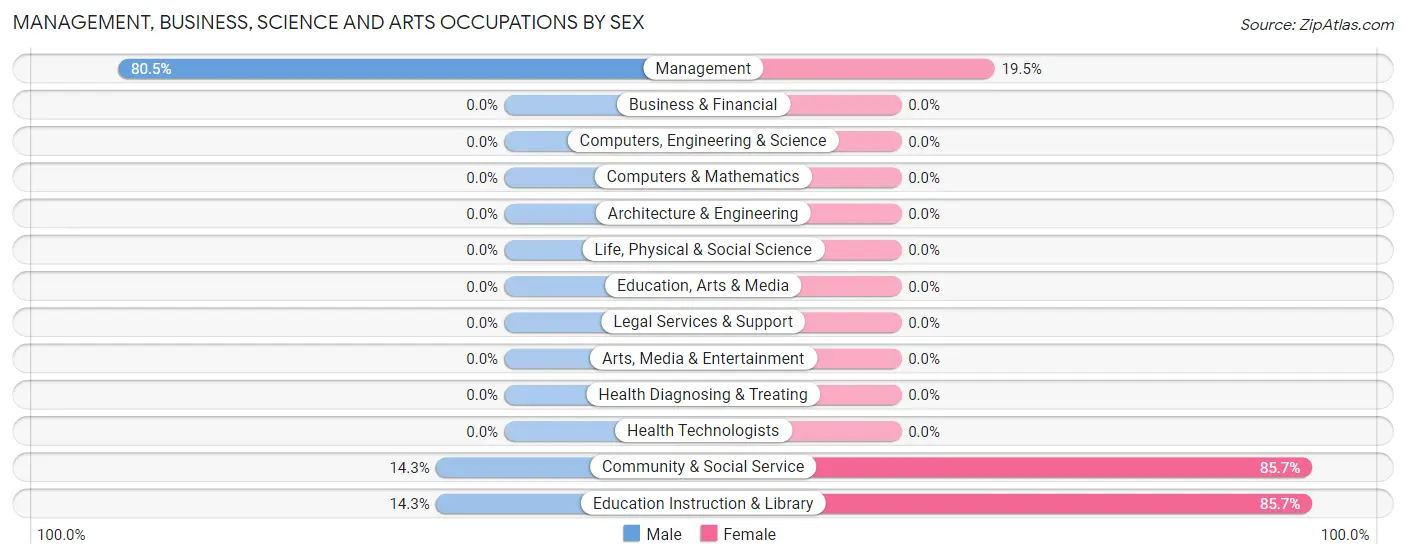
Management, Business, Science and Arts Occupations by Sex
Within the Management, Business, Science and Arts occupations in Boulder, the most male-oriented occupations are Management (80.5%), Community & Social Service (14.3%), and Education Instruction & Library (14.3%), while the most female-oriented occupations are Community & Social Service (85.7%), Education Instruction & Library (85.7%), and Management (19.5%).
| Occupation | Male | Female |
| Management | 33 (80.5%) | 8 (19.5%) |
| Business & Financial | 0 (0.0%) | 0 (0.0%) |
| Computers, Engineering & Science | 0 (0.0%) | 0 (0.0%) |
| Computers & Mathematics | 0 (0.0%) | 0 (0.0%) |
| Architecture & Engineering | 0 (0.0%) | 0 (0.0%) |
| Life, Physical & Social Science | 0 (0.0%) | 0 (0.0%) |
| Community & Social Service | 2 (14.3%) | 12 (85.7%) |
| Education, Arts & Media | 0 (0.0%) | 0 (0.0%) |
| Legal Services & Support | 0 (0.0%) | 0 (0.0%) |
| Education Instruction & Library | 2 (14.3%) | 12 (85.7%) |
| Arts, Media & Entertainment | 0 (0.0%) | 0 (0.0%) |
| Health Diagnosing & Treating | 0 (0.0%) | 0 (0.0%) |
| Health Technologists | 0 (0.0%) | 0 (0.0%) |
| Total (Category) | 35 (63.6%) | 20 (36.4%) |
| Total (Overall) | 44 (38.9%) | 69 (61.1%) |
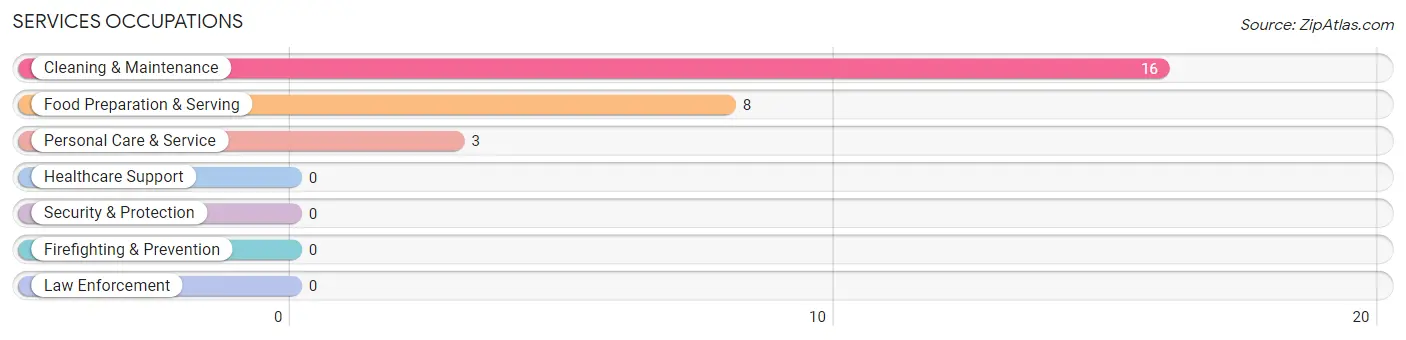
Services Occupations
The most common Services occupations in Boulder are Cleaning & Maintenance (16 | 14.2%), Food Preparation & Serving (8 | 7.1%), and Personal Care & Service (3 | 2.6%).
Services Occupations by Sex
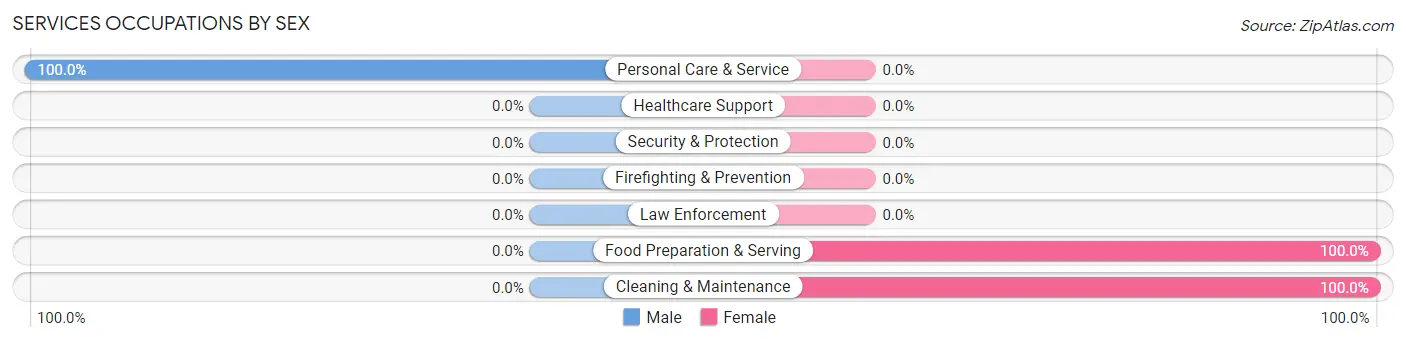
| Occupation | Male | Female |
| Healthcare Support | 0 (0.0%) | 0 (0.0%) |
| Security & Protection | 0 (0.0%) | 0 (0.0%) |
| Firefighting & Prevention | 0 (0.0%) | 0 (0.0%) |
| Law Enforcement | 0 (0.0%) | 0 (0.0%) |
| Food Preparation & Serving | 0 (0.0%) | 8 (100.0%) |
| Cleaning & Maintenance | 0 (0.0%) | 16 (100.0%) |
| Personal Care & Service | 3 (100.0%) | 0 (0.0%) |
| Total (Category) | 3 (11.1%) | 24 (88.9%) |
| Total (Overall) | 44 (38.9%) | 69 (61.1%) |
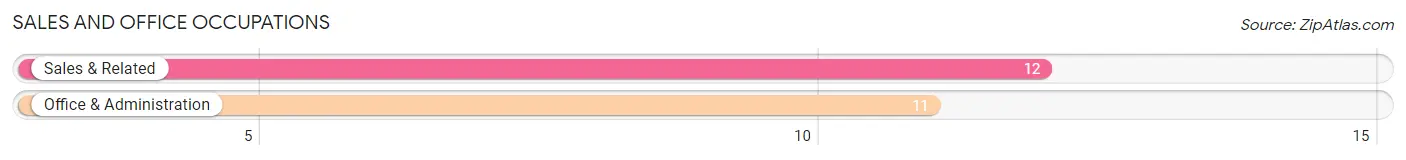
Sales and Office Occupations
The most common Sales and Office occupations in Boulder are Sales & Related (12 | 10.6%), and Office & Administration (11 | 9.7%).
Sales and Office Occupations by Sex
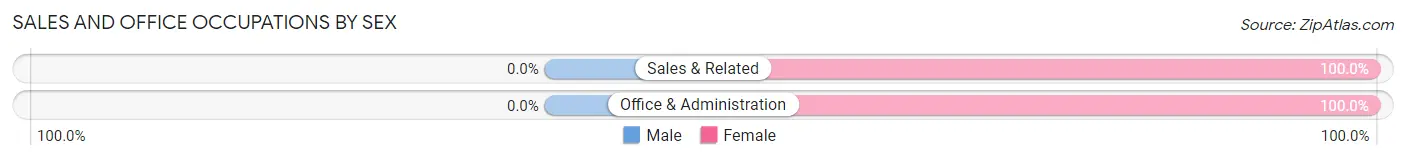
| Occupation | Male | Female |
| Sales & Related | 0 (0.0%) | 12 (100.0%) |
| Office & Administration | 0 (0.0%) | 11 (100.0%) |
| Total (Category) | 0 (0.0%) | 23 (100.0%) |
| Total (Overall) | 44 (38.9%) | 69 (61.1%) |
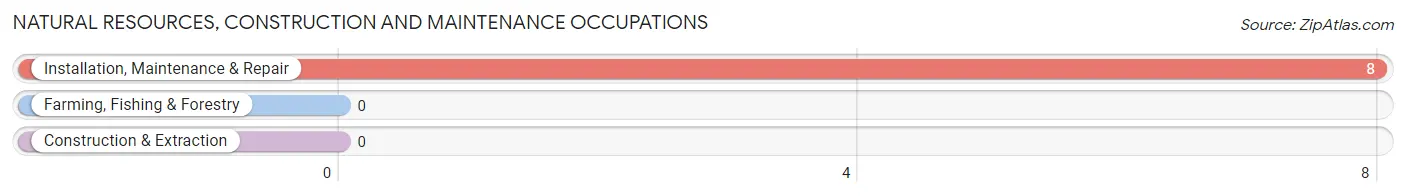
Natural Resources, Construction and Maintenance Occupations
The most common Natural Resources, Construction and Maintenance occupations in Boulder are , and Installation, Maintenance & Repair (8 | 7.1%).
Natural Resources, Construction and Maintenance Occupations by Sex
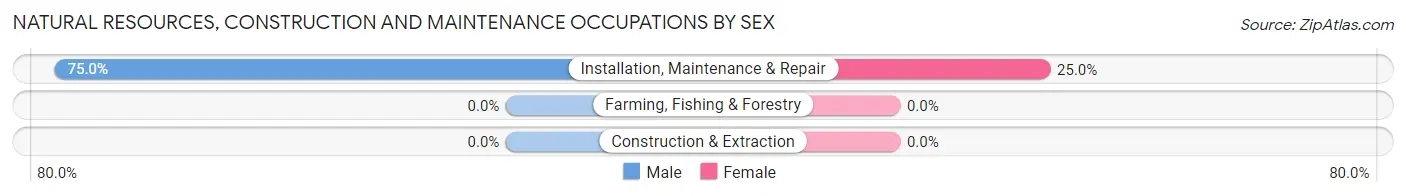
| Occupation | Male | Female |
| Farming, Fishing & Forestry | 0 (0.0%) | 0 (0.0%) |
| Construction & Extraction | 0 (0.0%) | 0 (0.0%) |
| Installation, Maintenance & Repair | 6 (75.0%) | 2 (25.0%) |
| Total (Category) | 6 (75.0%) | 2 (25.0%) |
| Total (Overall) | 44 (38.9%) | 69 (61.1%) |
Production, Transportation and Moving Occupations
Production, Transportation and Moving Occupations by Sex
| Occupation | Male | Female |
| Production | 0 (0.0%) | 0 (0.0%) |
| Transportation | 0 (0.0%) | 0 (0.0%) |
| Material Moving | 0 (0.0%) | 0 (0.0%) |
| Total (Category) | 0 (0.0%) | 0 (0.0%) |
| Total (Overall) | 44 (38.9%) | 69 (61.1%) |
Employment Industries by Sex in Boulder
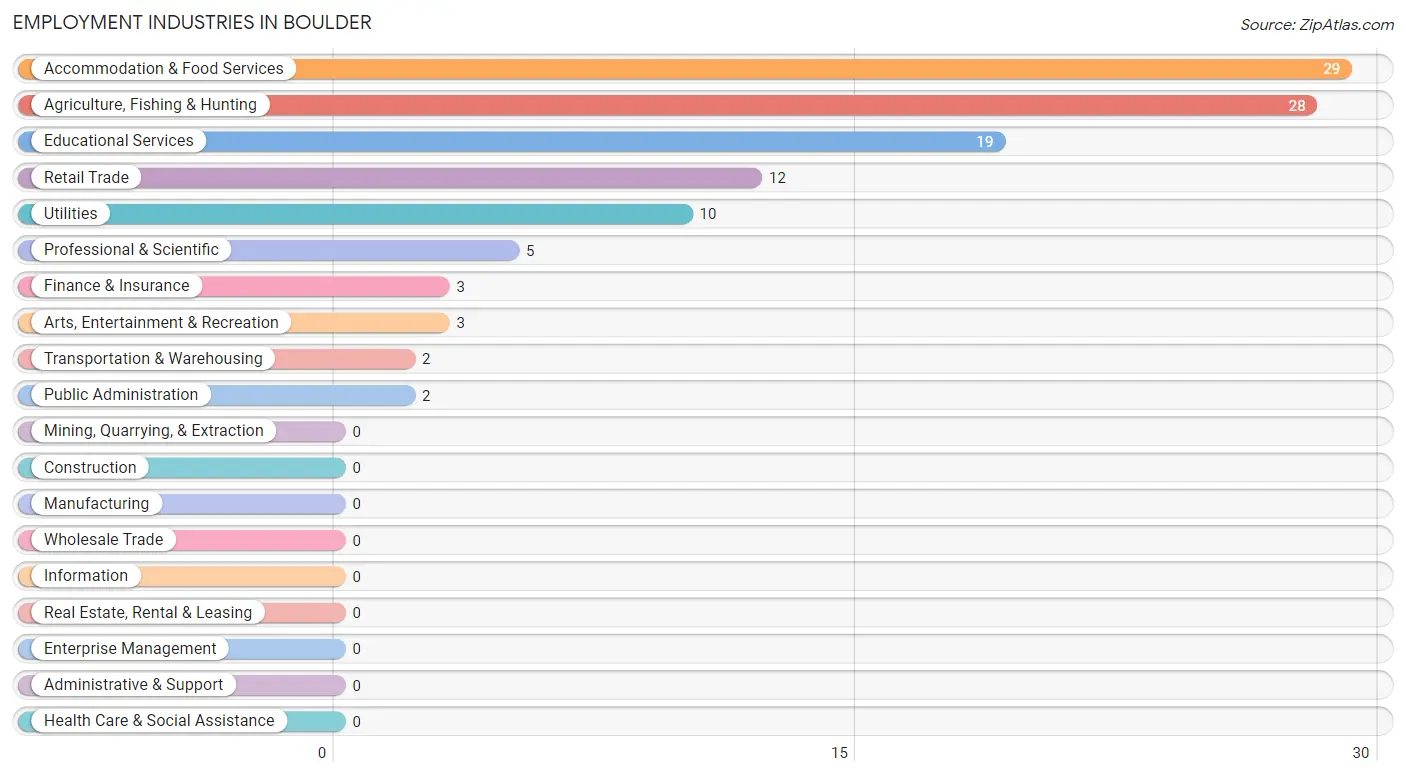
Employment Industries in Boulder
The major employment industries in Boulder include Accommodation & Food Services (29 | 25.7%), Agriculture, Fishing & Hunting (28 | 24.8%), Educational Services (19 | 16.8%), Retail Trade (12 | 10.6%), and Utilities (10 | 8.8%).
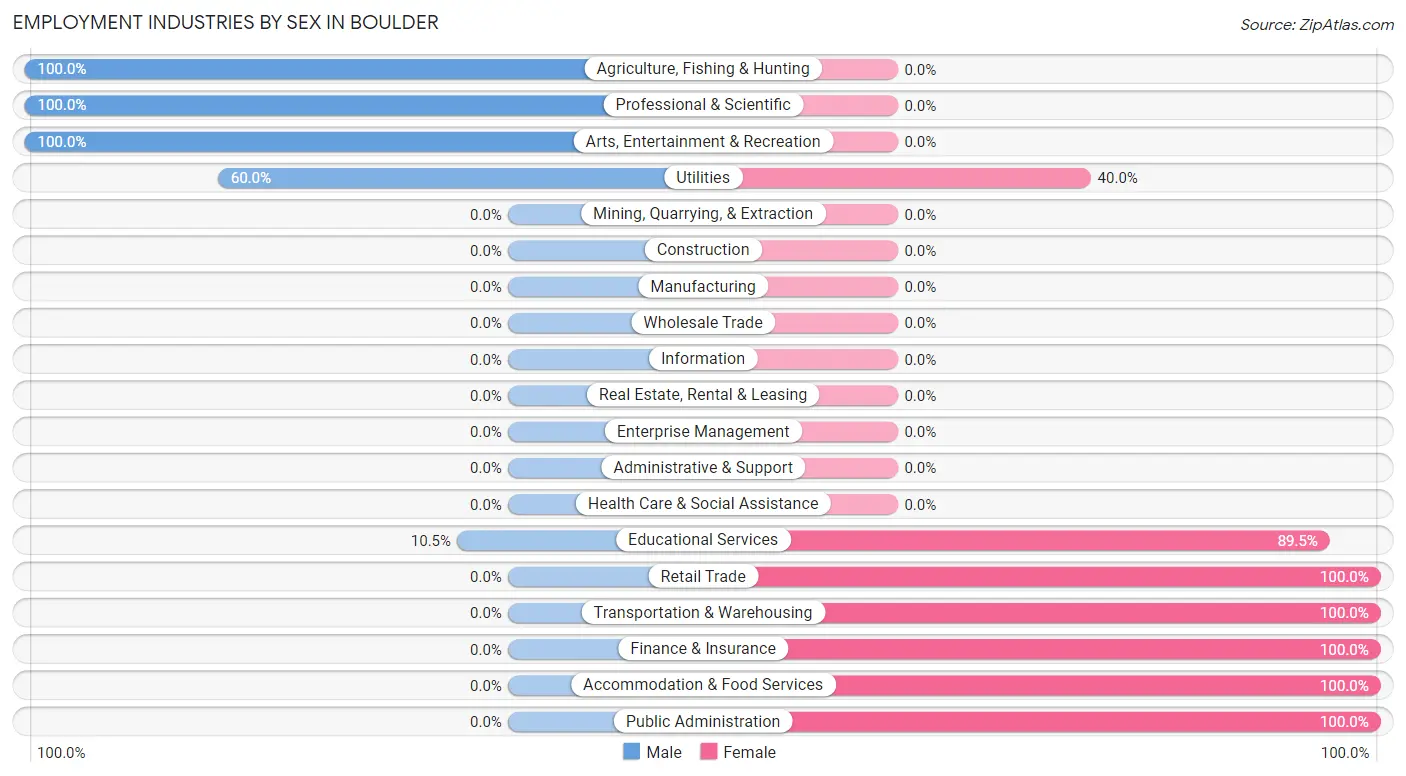
Employment Industries by Sex in Boulder
The Boulder industries that see more men than women are Agriculture, Fishing & Hunting (100.0%), Professional & Scientific (100.0%), and Arts, Entertainment & Recreation (100.0%), whereas the industries that tend to have a higher number of women are Retail Trade (100.0%), Transportation & Warehousing (100.0%), and Finance & Insurance (100.0%).
| Industry | Male | Female |
| Agriculture, Fishing & Hunting | 28 (100.0%) | 0 (0.0%) |
| Mining, Quarrying, & Extraction | 0 (0.0%) | 0 (0.0%) |
| Construction | 0 (0.0%) | 0 (0.0%) |
| Manufacturing | 0 (0.0%) | 0 (0.0%) |
| Wholesale Trade | 0 (0.0%) | 0 (0.0%) |
| Retail Trade | 0 (0.0%) | 12 (100.0%) |
| Transportation & Warehousing | 0 (0.0%) | 2 (100.0%) |
| Utilities | 6 (60.0%) | 4 (40.0%) |
| Information | 0 (0.0%) | 0 (0.0%) |
| Finance & Insurance | 0 (0.0%) | 3 (100.0%) |
| Real Estate, Rental & Leasing | 0 (0.0%) | 0 (0.0%) |
| Professional & Scientific | 5 (100.0%) | 0 (0.0%) |
| Enterprise Management | 0 (0.0%) | 0 (0.0%) |
| Administrative & Support | 0 (0.0%) | 0 (0.0%) |
| Educational Services | 2 (10.5%) | 17 (89.5%) |
| Health Care & Social Assistance | 0 (0.0%) | 0 (0.0%) |
| Arts, Entertainment & Recreation | 3 (100.0%) | 0 (0.0%) |
| Accommodation & Food Services | 0 (0.0%) | 29 (100.0%) |
| Public Administration | 0 (0.0%) | 2 (100.0%) |
| Total | 44 (38.9%) | 69 (61.1%) |
Education in Boulder
School Enrollment in Boulder
The most common levels of schooling among the 50 students in Boulder are kindergarten (38 | 76.0%), nursery / preschool (9 | 18.0%), and graduate / professional (3 | 6.0%).
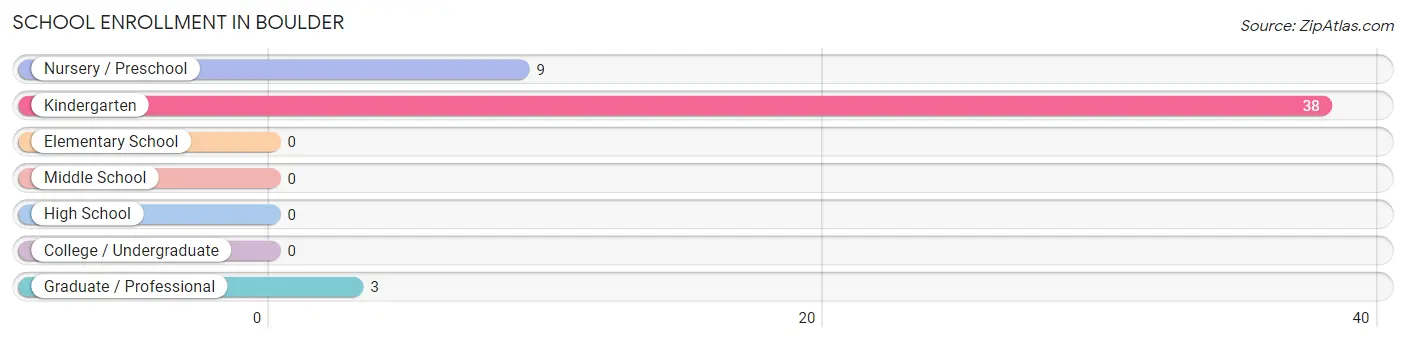
| School Level | # Students | % Students |
| Nursery / Preschool | 9 | 18.0% |
| Kindergarten | 38 | 76.0% |
| Elementary School | 0 | 0.0% |
| Middle School | 0 | 0.0% |
| High School | 0 | 0.0% |
| College / Undergraduate | 0 | 0.0% |
| Graduate / Professional | 3 | 6.0% |
| Total | 50 | 100.0% |
School Enrollment by Age by Funding Source in Boulder
Out of a total of 50 students who are enrolled in schools in Boulder, 9 (18.0%) attend a private institution, while the remaining 41 (82.0%) are enrolled in public schools. The age group of 3 to 4 year olds has the highest likelihood of being enrolled in private schools, with 9 (100.0% in the age bracket) enrolled. Conversely, the age group of 5 to 9 year old has the lowest likelihood of being enrolled in a private school, with 38 (100.0% in the age bracket) attending a public institution.
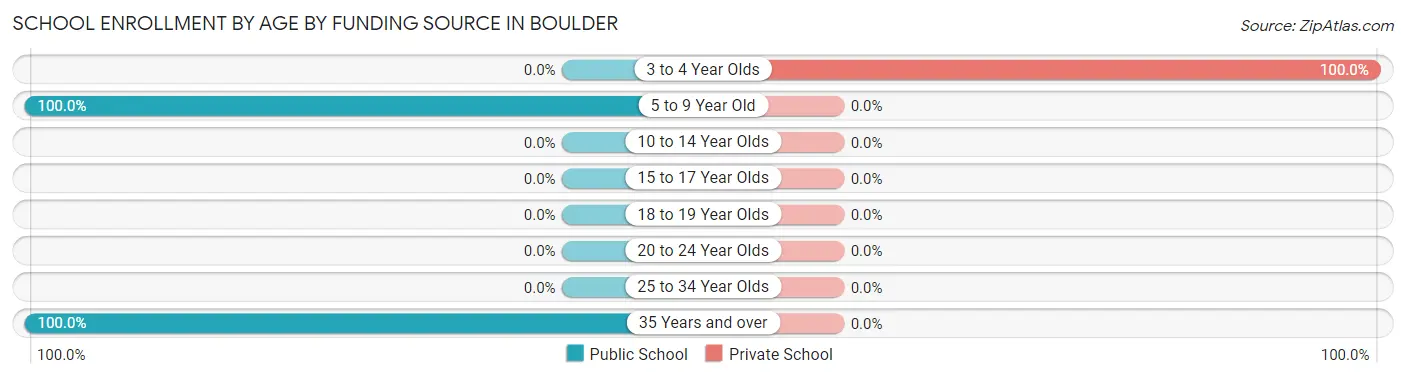
| Age Bracket | Public School | Private School |
| 3 to 4 Year Olds | 0 (0.0%) | 9 (100.0%) |
| 5 to 9 Year Old | 38 (100.0%) | 0 (0.0%) |
| 10 to 14 Year Olds | 0 (0.0%) | 0 (0.0%) |
| 15 to 17 Year Olds | 0 (0.0%) | 0 (0.0%) |
| 18 to 19 Year Olds | 0 (0.0%) | 0 (0.0%) |
| 20 to 24 Year Olds | 0 (0.0%) | 0 (0.0%) |
| 25 to 34 Year Olds | 0 (0.0%) | 0 (0.0%) |
| 35 Years and over | 3 (100.0%) | 0 (0.0%) |
| Total | 41 (82.0%) | 9 (18.0%) |
Educational Attainment by Field of Study in Boulder
Education (46 | 37.1%), bio, nature & agricultural (20 | 16.1%), visual & performing arts (16 | 12.9%), engineering (13 | 10.5%), and physical & health sciences (12 | 9.7%) are the most common fields of study among 124 individuals in Boulder who have obtained a bachelor's degree or higher.
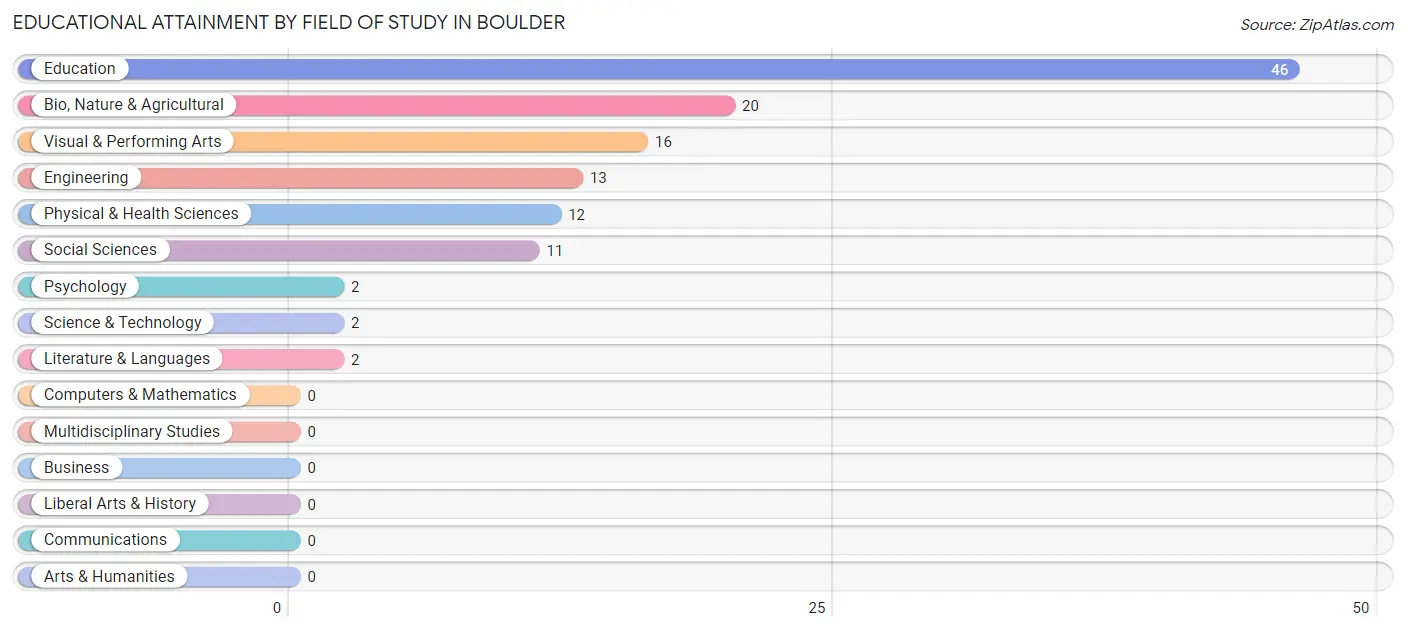
| Field of Study | # Graduates | % Graduates |
| Computers & Mathematics | 0 | 0.0% |
| Bio, Nature & Agricultural | 20 | 16.1% |
| Physical & Health Sciences | 12 | 9.7% |
| Psychology | 2 | 1.6% |
| Social Sciences | 11 | 8.9% |
| Engineering | 13 | 10.5% |
| Multidisciplinary Studies | 0 | 0.0% |
| Science & Technology | 2 | 1.6% |
| Business | 0 | 0.0% |
| Education | 46 | 37.1% |
| Literature & Languages | 2 | 1.6% |
| Liberal Arts & History | 0 | 0.0% |
| Visual & Performing Arts | 16 | 12.9% |
| Communications | 0 | 0.0% |
| Arts & Humanities | 0 | 0.0% |
| Total | 124 | 100.0% |
Transportation & Commute in Boulder
Vehicle Availability by Sex in Boulder
The most prevalent vehicle ownership categories in Boulder are males with 2 vehicles (35, accounting for 79.5%) and females with 2 vehicles (28, making up 55.6%).
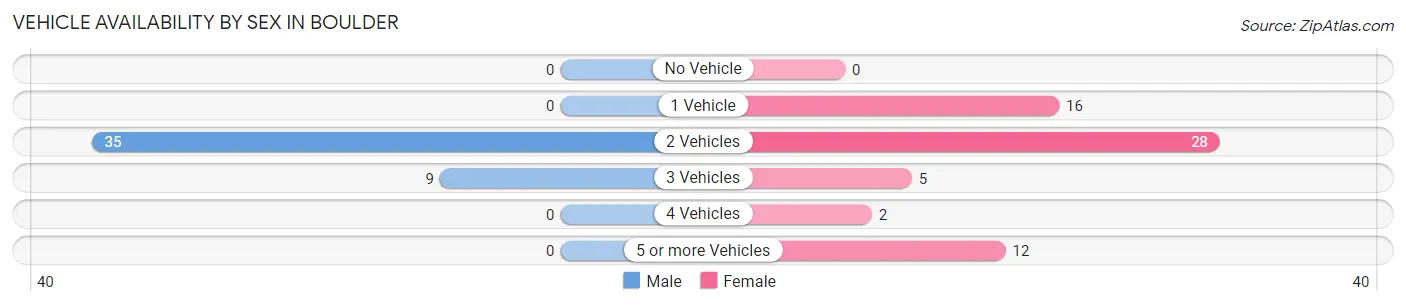
| Vehicles Available | Male | Female |
| No Vehicle | 0 (0.0%) | 0 (0.0%) |
| 1 Vehicle | 0 (0.0%) | 16 (25.4%) |
| 2 Vehicles | 35 (79.5%) | 28 (44.4%) |
| 3 Vehicles | 9 (20.4%) | 5 (7.9%) |
| 4 Vehicles | 0 (0.0%) | 2 (3.2%) |
| 5 or more Vehicles | 0 (0.0%) | 12 (19.1%) |
| Total | 44 (100.0%) | 63 (100.0%) |
Commute Time in Boulder
The most frequently occuring commute durations in Boulder are 5 to 9 minutes (33 commuters, 35.9%), less than 5 minutes (30 commuters, 32.6%), and 10 to 14 minutes (12 commuters, 13.0%).
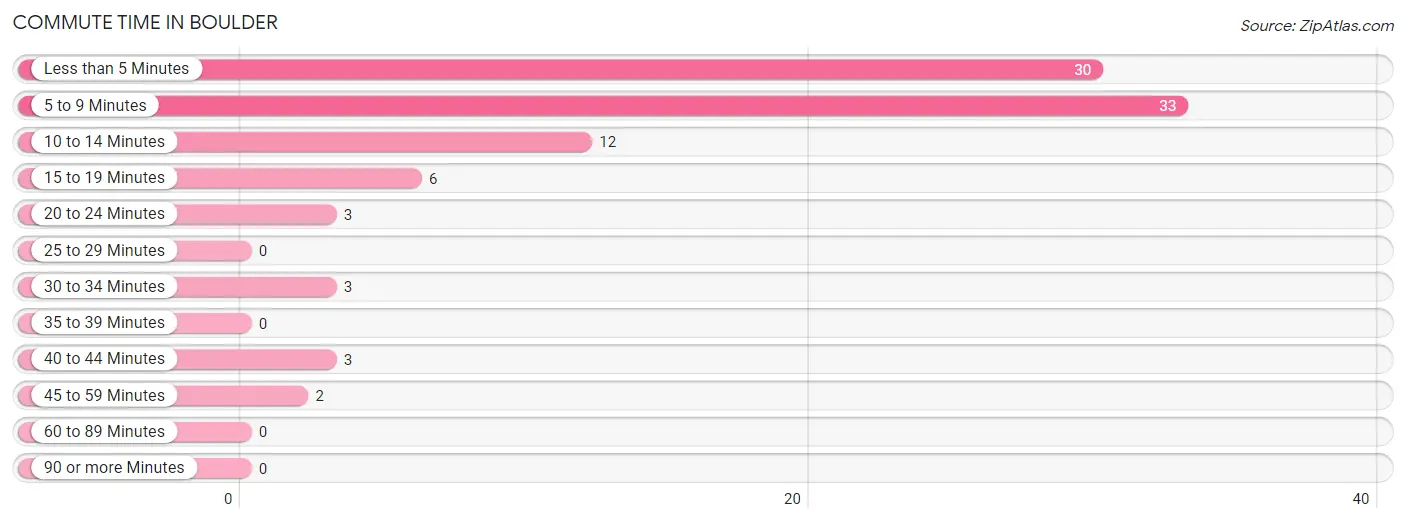
| Commute Time | # Commuters | % Commuters |
| Less than 5 Minutes | 30 | 32.6% |
| 5 to 9 Minutes | 33 | 35.9% |
| 10 to 14 Minutes | 12 | 13.0% |
| 15 to 19 Minutes | 6 | 6.5% |
| 20 to 24 Minutes | 3 | 3.3% |
| 25 to 29 Minutes | 0 | 0.0% |
| 30 to 34 Minutes | 3 | 3.3% |
| 35 to 39 Minutes | 0 | 0.0% |
| 40 to 44 Minutes | 3 | 3.3% |
| 45 to 59 Minutes | 2 | 2.2% |
| 60 to 89 Minutes | 0 | 0.0% |
| 90 or more Minutes | 0 | 0.0% |
Commute Time by Sex in Boulder
The most common commute times in Boulder are less than 5 minutes (22 commuters, 71.0%) for males and 5 to 9 minutes (33 commuters, 54.1%) for females.
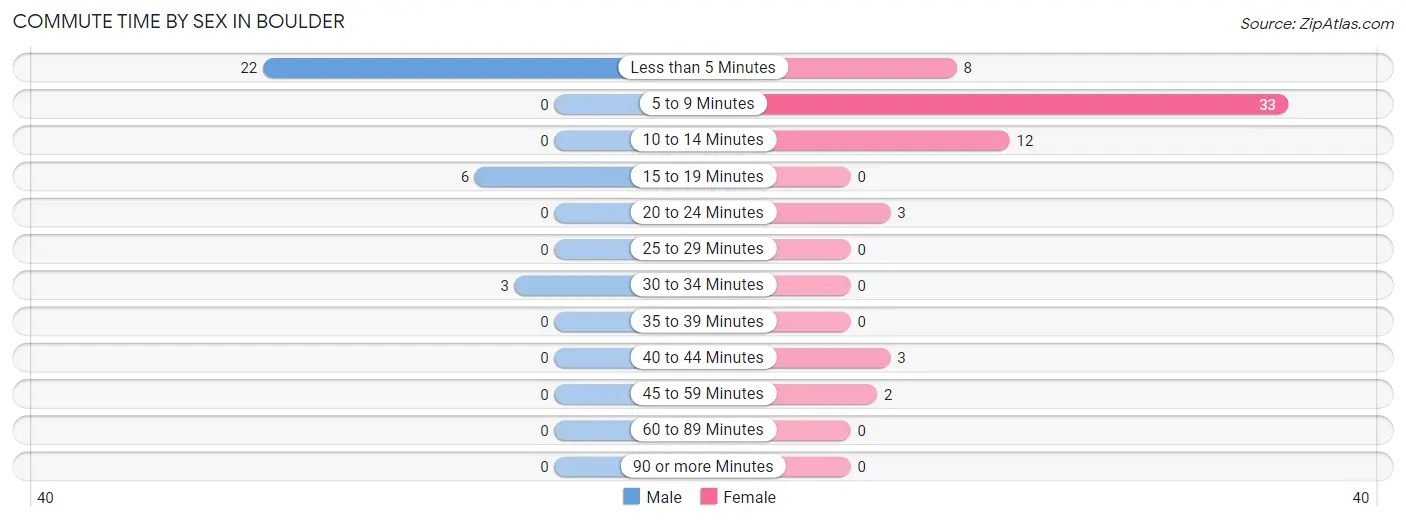
| Commute Time | Male | Female |
| Less than 5 Minutes | 22 (71.0%) | 8 (13.1%) |
| 5 to 9 Minutes | 0 (0.0%) | 33 (54.1%) |
| 10 to 14 Minutes | 0 (0.0%) | 12 (19.7%) |
| 15 to 19 Minutes | 6 (19.4%) | 0 (0.0%) |
| 20 to 24 Minutes | 0 (0.0%) | 3 (4.9%) |
| 25 to 29 Minutes | 0 (0.0%) | 0 (0.0%) |
| 30 to 34 Minutes | 3 (9.7%) | 0 (0.0%) |
| 35 to 39 Minutes | 0 (0.0%) | 0 (0.0%) |
| 40 to 44 Minutes | 0 (0.0%) | 3 (4.9%) |
| 45 to 59 Minutes | 0 (0.0%) | 2 (3.3%) |
| 60 to 89 Minutes | 0 (0.0%) | 0 (0.0%) |
| 90 or more Minutes | 0 (0.0%) | 0 (0.0%) |
Time of Departure to Work by Sex in Boulder
The most frequent times of departure to work in Boulder are 8:00 AM to 8:29 AM (31, 100.0%) for males and 8:00 AM to 8:29 AM (17, 27.9%) for females.
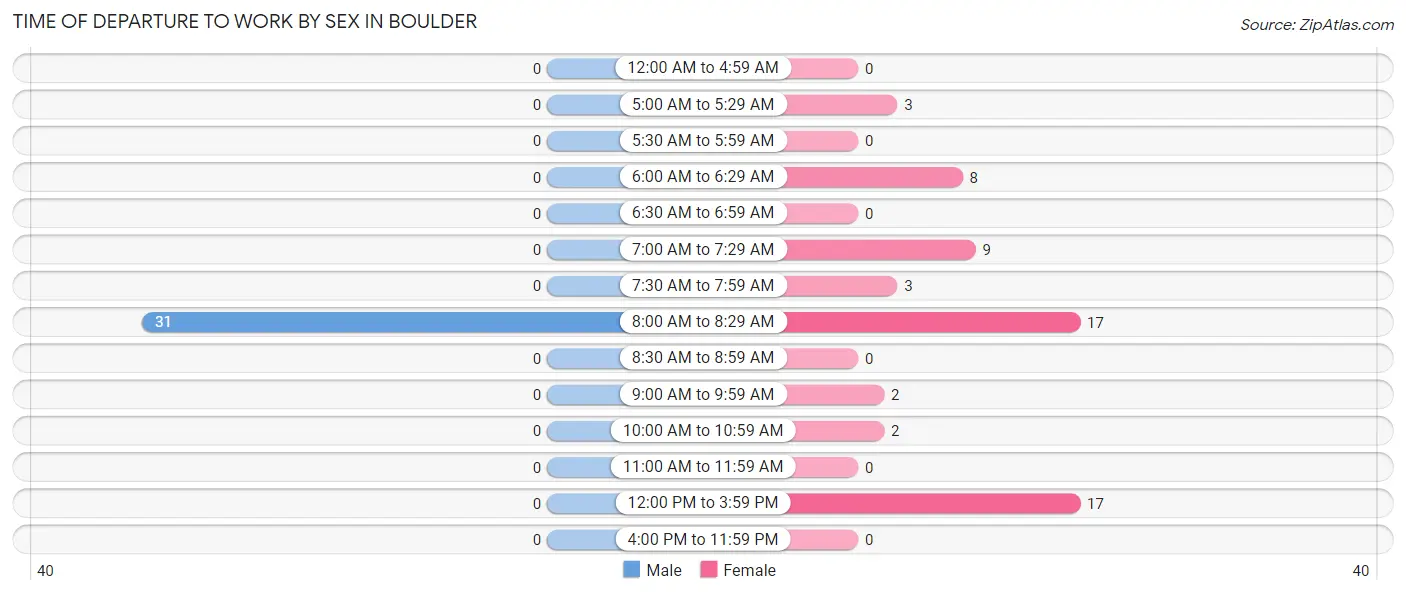
| Time of Departure | Male | Female |
| 12:00 AM to 4:59 AM | 0 (0.0%) | 0 (0.0%) |
| 5:00 AM to 5:29 AM | 0 (0.0%) | 3 (4.9%) |
| 5:30 AM to 5:59 AM | 0 (0.0%) | 0 (0.0%) |
| 6:00 AM to 6:29 AM | 0 (0.0%) | 8 (13.1%) |
| 6:30 AM to 6:59 AM | 0 (0.0%) | 0 (0.0%) |
| 7:00 AM to 7:29 AM | 0 (0.0%) | 9 (14.7%) |
| 7:30 AM to 7:59 AM | 0 (0.0%) | 3 (4.9%) |
| 8:00 AM to 8:29 AM | 31 (100.0%) | 17 (27.9%) |
| 8:30 AM to 8:59 AM | 0 (0.0%) | 0 (0.0%) |
| 9:00 AM to 9:59 AM | 0 (0.0%) | 2 (3.3%) |
| 10:00 AM to 10:59 AM | 0 (0.0%) | 2 (3.3%) |
| 11:00 AM to 11:59 AM | 0 (0.0%) | 0 (0.0%) |
| 12:00 PM to 3:59 PM | 0 (0.0%) | 17 (27.9%) |
| 4:00 PM to 11:59 PM | 0 (0.0%) | 0 (0.0%) |
| Total | 31 (100.0%) | 61 (100.0%) |
Housing Occupancy in Boulder
Occupancy by Ownership in Boulder
Of the total 143 dwellings in Boulder, owner-occupied units account for 97 (67.8%), while renter-occupied units make up 46 (32.2%).
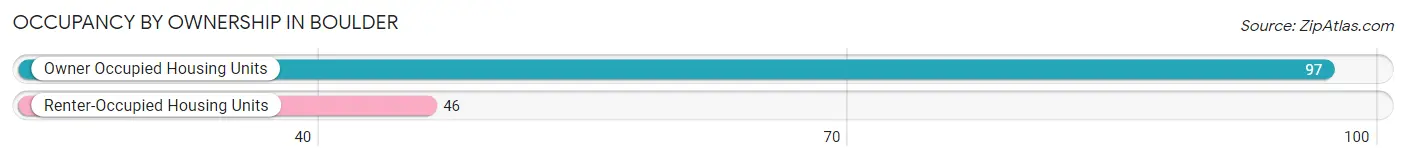
| Occupancy | # Housing Units | % Housing Units |
| Owner Occupied Housing Units | 97 | 67.8% |
| Renter-Occupied Housing Units | 46 | 32.2% |
| Total Occupied Housing Units | 143 | 100.0% |
Occupancy by Household Size in Boulder
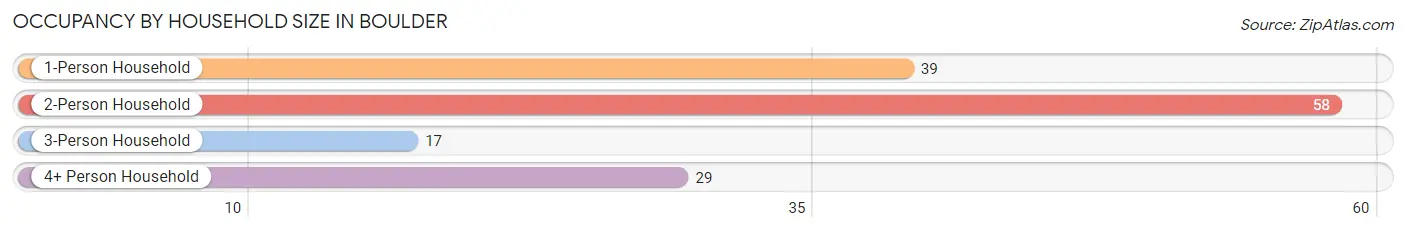
| Household Size | # Housing Units | % Housing Units |
| 1-Person Household | 39 | 27.3% |
| 2-Person Household | 58 | 40.6% |
| 3-Person Household | 17 | 11.9% |
| 4+ Person Household | 29 | 20.3% |
| Total Housing Units | 143 | 100.0% |
Occupancy by Ownership by Household Size in Boulder
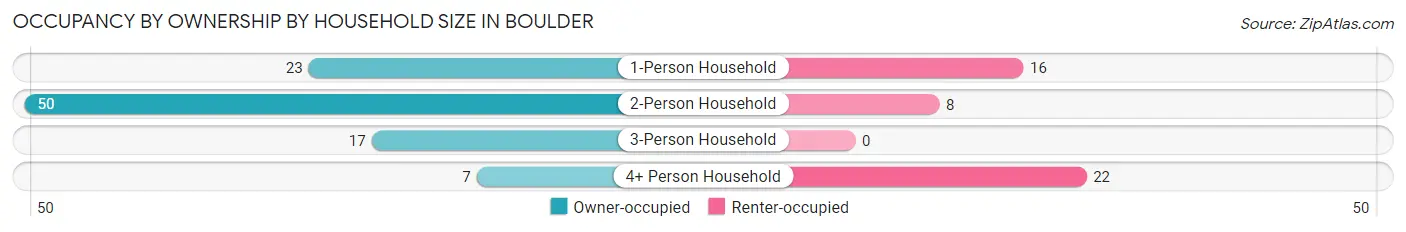
| Household Size | Owner-occupied | Renter-occupied |
| 1-Person Household | 23 (59.0%) | 16 (41.0%) |
| 2-Person Household | 50 (86.2%) | 8 (13.8%) |
| 3-Person Household | 17 (100.0%) | 0 (0.0%) |
| 4+ Person Household | 7 (24.1%) | 22 (75.9%) |
| Total Housing Units | 97 (67.8%) | 46 (32.2%) |
Occupancy by Educational Attainment in Boulder
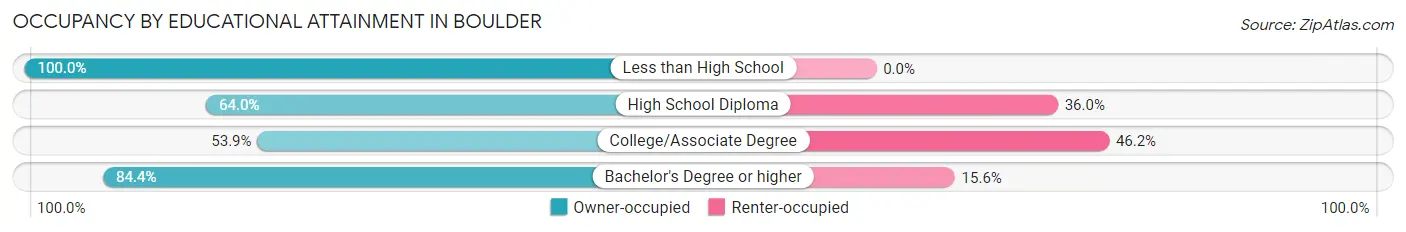
| Household Size | Owner-occupied | Renter-occupied |
| Less than High School | 8 (100.0%) | 0 (0.0%) |
| High School Diploma | 16 (64.0%) | 9 (36.0%) |
| College/Associate Degree | 35 (53.8%) | 30 (46.2%) |
| Bachelor's Degree or higher | 38 (84.4%) | 7 (15.6%) |
Occupancy by Age of Householder in Boulder
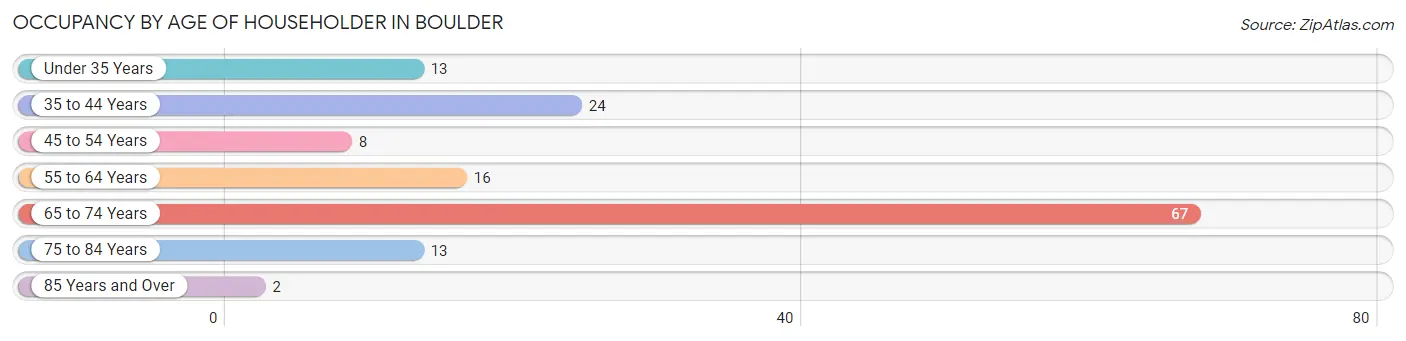
| Age Bracket | # Households | % Households |
| Under 35 Years | 13 | 9.1% |
| 35 to 44 Years | 24 | 16.8% |
| 45 to 54 Years | 8 | 5.6% |
| 55 to 64 Years | 16 | 11.2% |
| 65 to 74 Years | 67 | 46.9% |
| 75 to 84 Years | 13 | 9.1% |
| 85 Years and Over | 2 | 1.4% |
| Total | 143 | 100.0% |
Housing Finances in Boulder
Median Income by Occupancy in Boulder
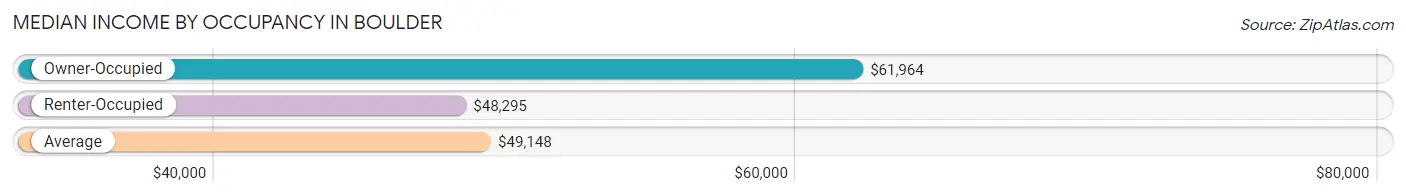
| Occupancy Type | # Households | Median Income |
| Owner-Occupied | 97 (67.8%) | $61,964 |
| Renter-Occupied | 46 (32.2%) | $48,295 |
| Average | 143 (100.0%) | $49,148 |
Occupancy by Householder Income Bracket in Boulder
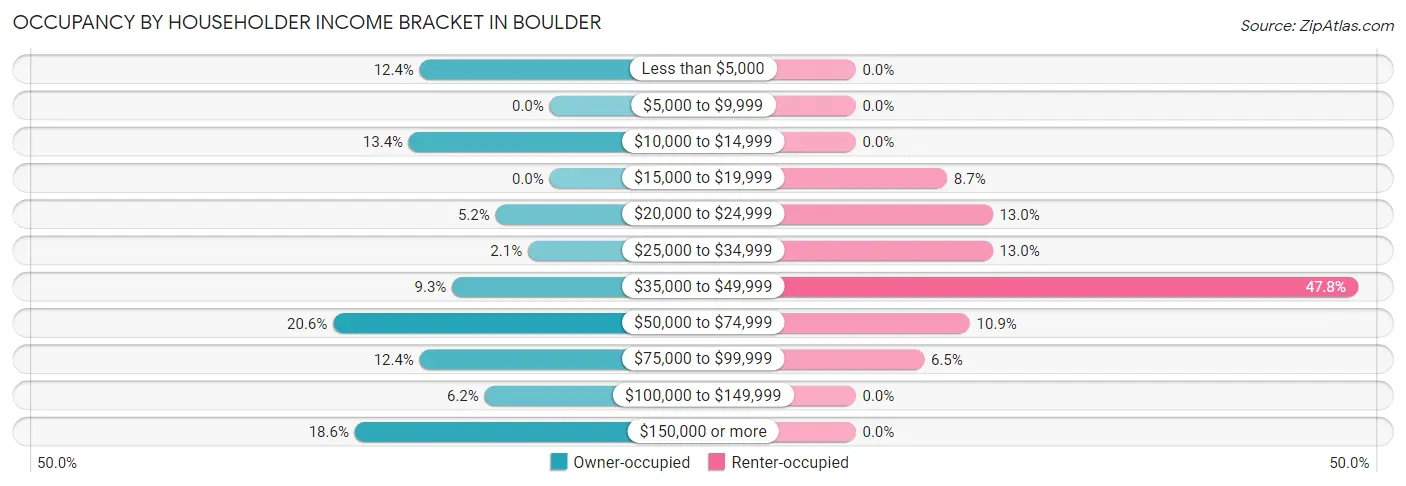
| Income Bracket | Owner-occupied | Renter-occupied |
| Less than $5,000 | 12 (12.4%) | 0 (0.0%) |
| $5,000 to $9,999 | 0 (0.0%) | 0 (0.0%) |
| $10,000 to $14,999 | 13 (13.4%) | 0 (0.0%) |
| $15,000 to $19,999 | 0 (0.0%) | 4 (8.7%) |
| $20,000 to $24,999 | 5 (5.1%) | 6 (13.0%) |
| $25,000 to $34,999 | 2 (2.1%) | 6 (13.0%) |
| $35,000 to $49,999 | 9 (9.3%) | 22 (47.8%) |
| $50,000 to $74,999 | 20 (20.6%) | 5 (10.9%) |
| $75,000 to $99,999 | 12 (12.4%) | 3 (6.5%) |
| $100,000 to $149,999 | 6 (6.2%) | 0 (0.0%) |
| $150,000 or more | 18 (18.6%) | 0 (0.0%) |
| Total | 97 (100.0%) | 46 (100.0%) |
Monthly Housing Cost Tiers in Boulder
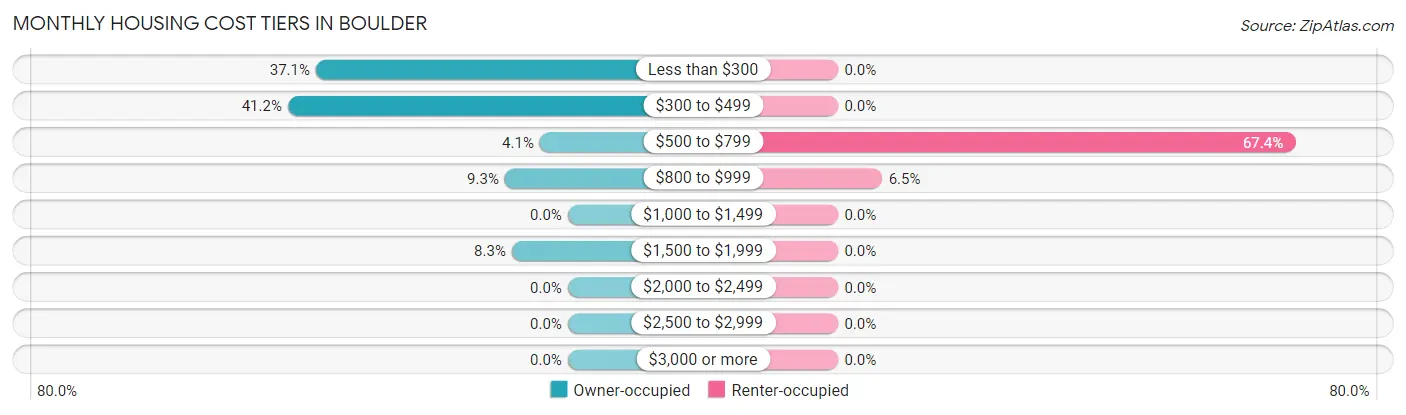
| Monthly Cost | Owner-occupied | Renter-occupied |
| Less than $300 | 36 (37.1%) | 0 (0.0%) |
| $300 to $499 | 40 (41.2%) | 0 (0.0%) |
| $500 to $799 | 4 (4.1%) | 31 (67.4%) |
| $800 to $999 | 9 (9.3%) | 3 (6.5%) |
| $1,000 to $1,499 | 0 (0.0%) | 0 (0.0%) |
| $1,500 to $1,999 | 8 (8.3%) | 0 (0.0%) |
| $2,000 to $2,499 | 0 (0.0%) | 0 (0.0%) |
| $2,500 to $2,999 | 0 (0.0%) | 0 (0.0%) |
| $3,000 or more | 0 (0.0%) | 0 (0.0%) |
| Total | 97 (100.0%) | 46 (100.0%) |
Physical Housing Characteristics in Boulder
Housing Structures in Boulder
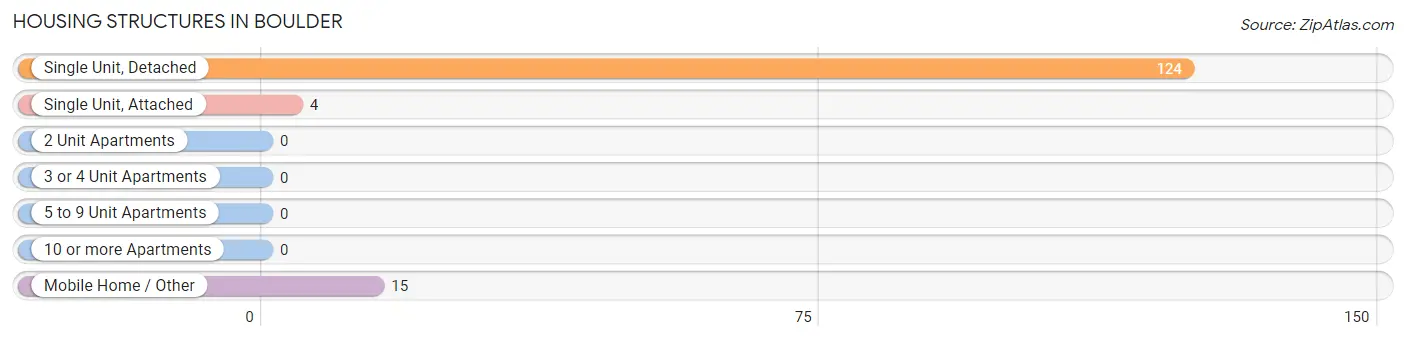
| Structure Type | # Housing Units | % Housing Units |
| Single Unit, Detached | 124 | 86.7% |
| Single Unit, Attached | 4 | 2.8% |
| 2 Unit Apartments | 0 | 0.0% |
| 3 or 4 Unit Apartments | 0 | 0.0% |
| 5 to 9 Unit Apartments | 0 | 0.0% |
| 10 or more Apartments | 0 | 0.0% |
| Mobile Home / Other | 15 | 10.5% |
| Total | 143 | 100.0% |
Housing Structures by Occupancy in Boulder
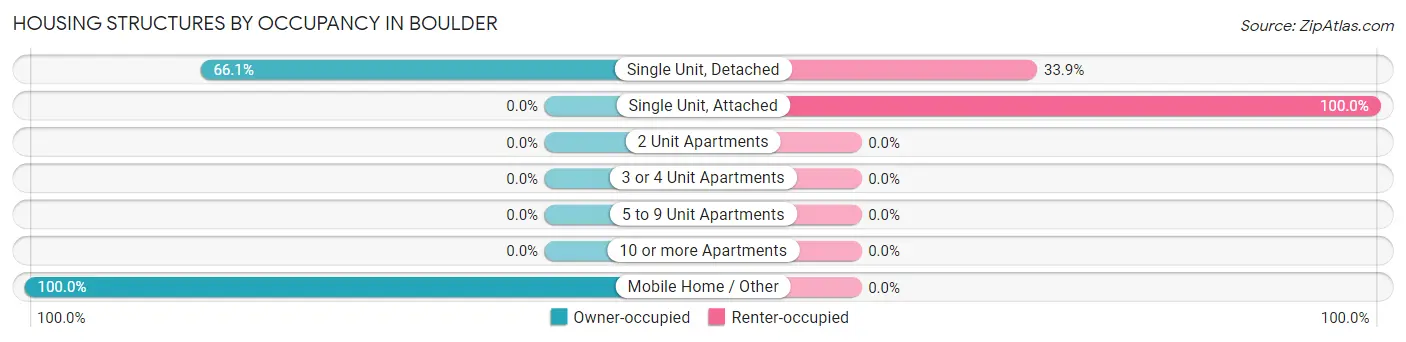
| Structure Type | Owner-occupied | Renter-occupied |
| Single Unit, Detached | 82 (66.1%) | 42 (33.9%) |
| Single Unit, Attached | 0 (0.0%) | 4 (100.0%) |
| 2 Unit Apartments | 0 (0.0%) | 0 (0.0%) |
| 3 or 4 Unit Apartments | 0 (0.0%) | 0 (0.0%) |
| 5 to 9 Unit Apartments | 0 (0.0%) | 0 (0.0%) |
| 10 or more Apartments | 0 (0.0%) | 0 (0.0%) |
| Mobile Home / Other | 15 (100.0%) | 0 (0.0%) |
| Total | 97 (67.8%) | 46 (32.2%) |
Housing Structures by Number of Rooms in Boulder
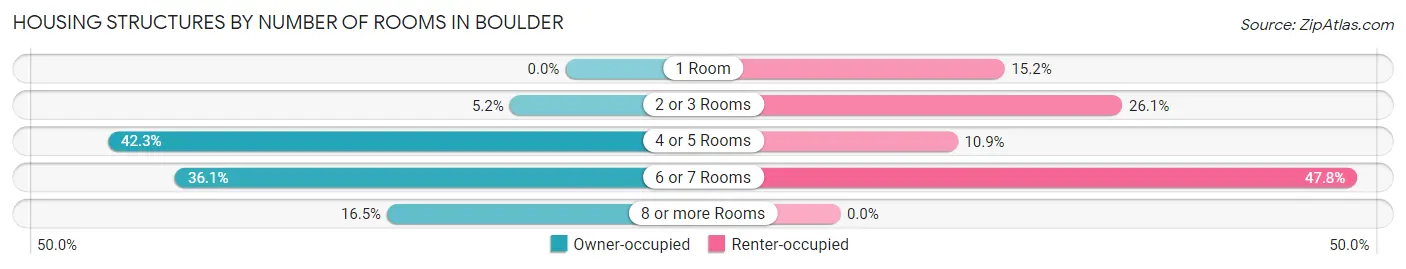
| Number of Rooms | Owner-occupied | Renter-occupied |
| 1 Room | 0 (0.0%) | 7 (15.2%) |
| 2 or 3 Rooms | 5 (5.1%) | 12 (26.1%) |
| 4 or 5 Rooms | 41 (42.3%) | 5 (10.9%) |
| 6 or 7 Rooms | 35 (36.1%) | 22 (47.8%) |
| 8 or more Rooms | 16 (16.5%) | 0 (0.0%) |
| Total | 97 (100.0%) | 46 (100.0%) |
Housing Structure by Heating Type in Boulder
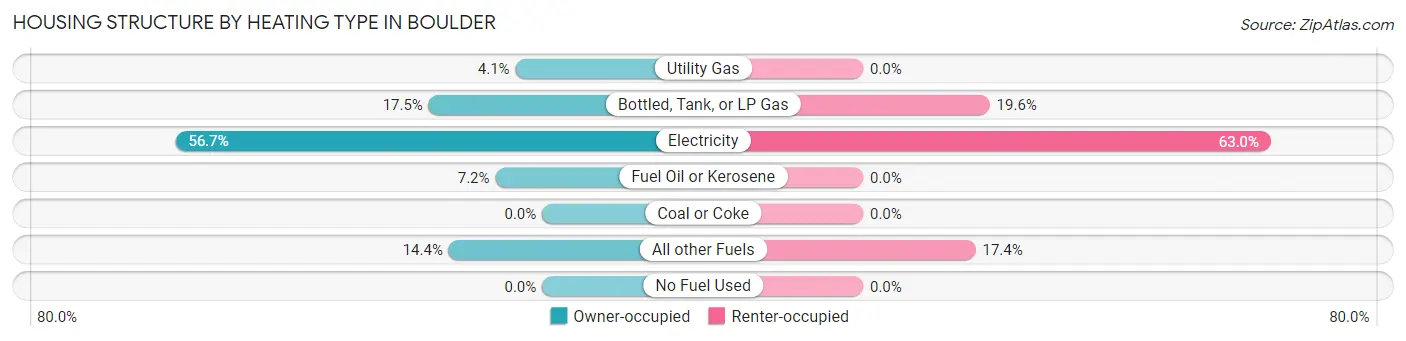
| Heating Type | Owner-occupied | Renter-occupied |
| Utility Gas | 4 (4.1%) | 0 (0.0%) |
| Bottled, Tank, or LP Gas | 17 (17.5%) | 9 (19.6%) |
| Electricity | 55 (56.7%) | 29 (63.0%) |
| Fuel Oil or Kerosene | 7 (7.2%) | 0 (0.0%) |
| Coal or Coke | 0 (0.0%) | 0 (0.0%) |
| All other Fuels | 14 (14.4%) | 8 (17.4%) |
| No Fuel Used | 0 (0.0%) | 0 (0.0%) |
| Total | 97 (100.0%) | 46 (100.0%) |
Household Vehicle Usage in Boulder
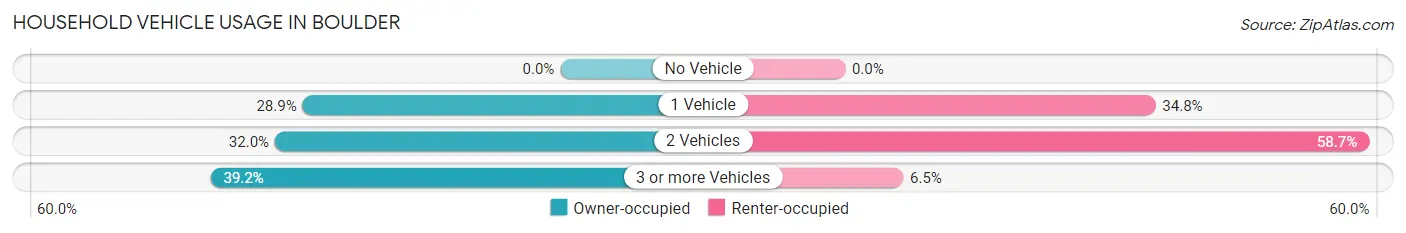
| Vehicles per Household | Owner-occupied | Renter-occupied |
| No Vehicle | 0 (0.0%) | 0 (0.0%) |
| 1 Vehicle | 28 (28.9%) | 16 (34.8%) |
| 2 Vehicles | 31 (32.0%) | 27 (58.7%) |
| 3 or more Vehicles | 38 (39.2%) | 3 (6.5%) |
| Total | 97 (100.0%) | 46 (100.0%) |
Real Estate & Mortgages in Boulder
Real Estate and Mortgage Overview in Boulder
| Characteristic | Without Mortgage | With Mortgage |
| Housing Units | 89 | 8 |
| Median Property Value | $217,300 | $0 |
| Median Household Income | $62,321 | $0 |
| Monthly Housing Costs | $324 | $0 |
| Real Estate Taxes | $900 | $5 |
Property Value by Mortgage Status in Boulder
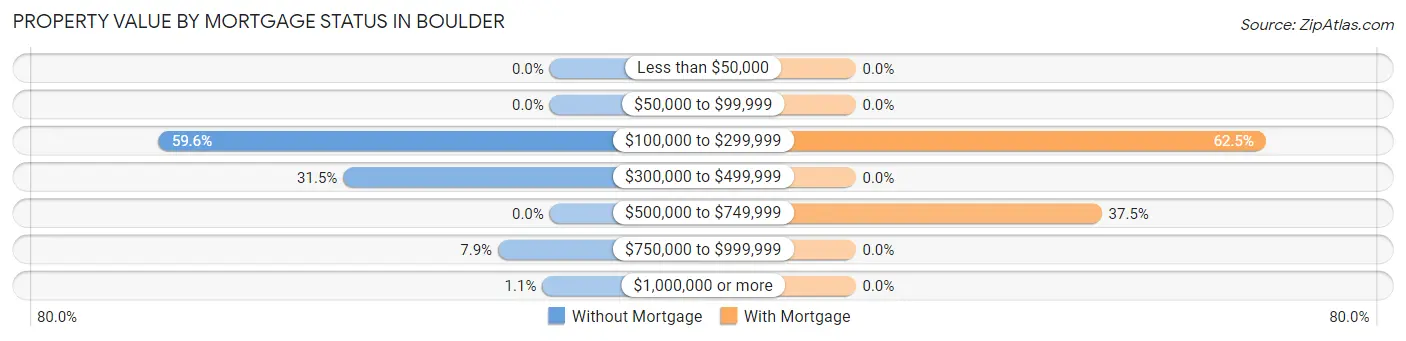
| Property Value | Without Mortgage | With Mortgage |
| Less than $50,000 | 0 (0.0%) | 0 (0.0%) |
| $50,000 to $99,999 | 0 (0.0%) | 0 (0.0%) |
| $100,000 to $299,999 | 53 (59.6%) | 5 (62.5%) |
| $300,000 to $499,999 | 28 (31.5%) | 0 (0.0%) |
| $500,000 to $749,999 | 0 (0.0%) | 3 (37.5%) |
| $750,000 to $999,999 | 7 (7.9%) | 0 (0.0%) |
| $1,000,000 or more | 1 (1.1%) | 0 (0.0%) |
| Total | 89 (100.0%) | 8 (100.0%) |
Household Income by Mortgage Status in Boulder
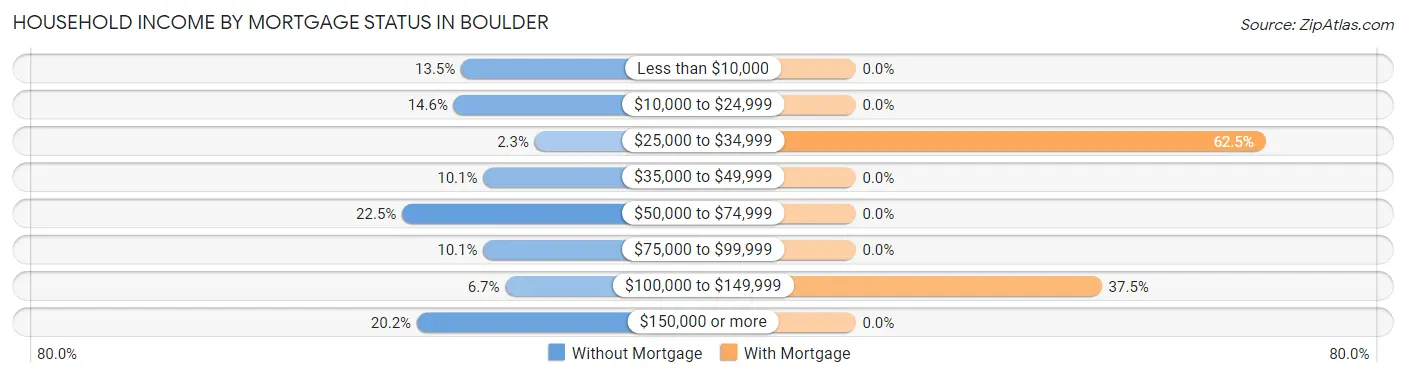
| Household Income | Without Mortgage | With Mortgage |
| Less than $10,000 | 12 (13.5%) | 0 (0.0%) |
| $10,000 to $24,999 | 13 (14.6%) | 0 (0.0%) |
| $25,000 to $34,999 | 2 (2.2%) | 5 (62.5%) |
| $35,000 to $49,999 | 9 (10.1%) | 0 (0.0%) |
| $50,000 to $74,999 | 20 (22.5%) | 0 (0.0%) |
| $75,000 to $99,999 | 9 (10.1%) | 0 (0.0%) |
| $100,000 to $149,999 | 6 (6.7%) | 3 (37.5%) |
| $150,000 or more | 18 (20.2%) | 0 (0.0%) |
| Total | 89 (100.0%) | 8 (100.0%) |
Property Value to Household Income Ratio in Boulder
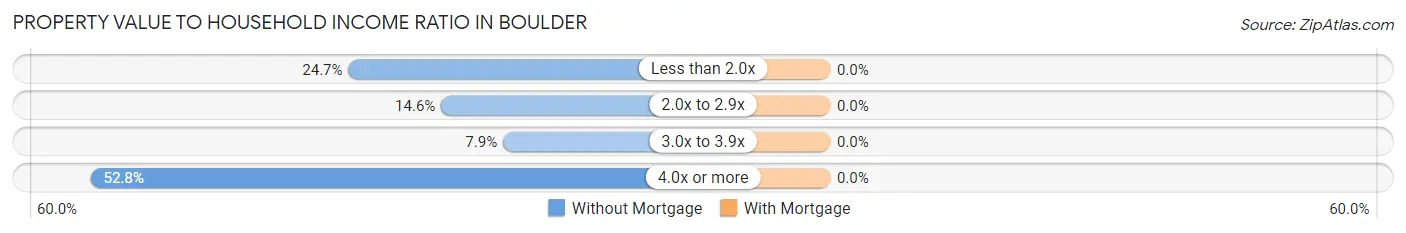
| Value-to-Income Ratio | Without Mortgage | With Mortgage |
| Less than 2.0x | 22 (24.7%) | 0 (0.0%) |
| 2.0x to 2.9x | 13 (14.6%) | 0 (0.0%) |
| 3.0x to 3.9x | 7 (7.9%) | 0 (0.0%) |
| 4.0x or more | 47 (52.8%) | 0 (0.0%) |
| Total | 89 (100.0%) | 8 (100.0%) |
Real Estate Taxes by Mortgage Status in Boulder
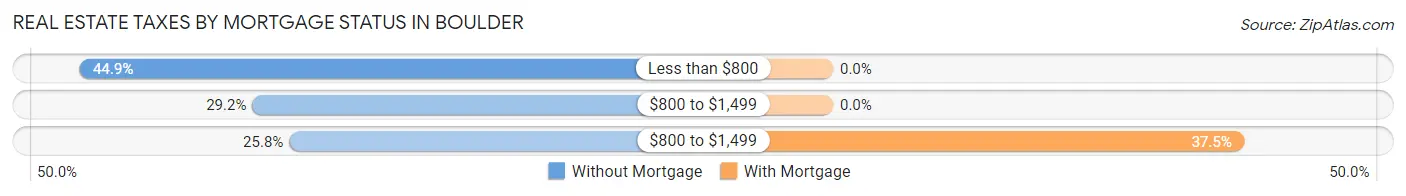
| Property Taxes | Without Mortgage | With Mortgage |
| Less than $800 | 40 (44.9%) | 0 (0.0%) |
| $800 to $1,499 | 26 (29.2%) | 0 (0.0%) |
| $800 to $1,499 | 23 (25.8%) | 3 (37.5%) |
| Total | 89 (100.0%) | 8 (100.0%) |
Health & Disability in Boulder
Health Insurance Coverage by Age in Boulder
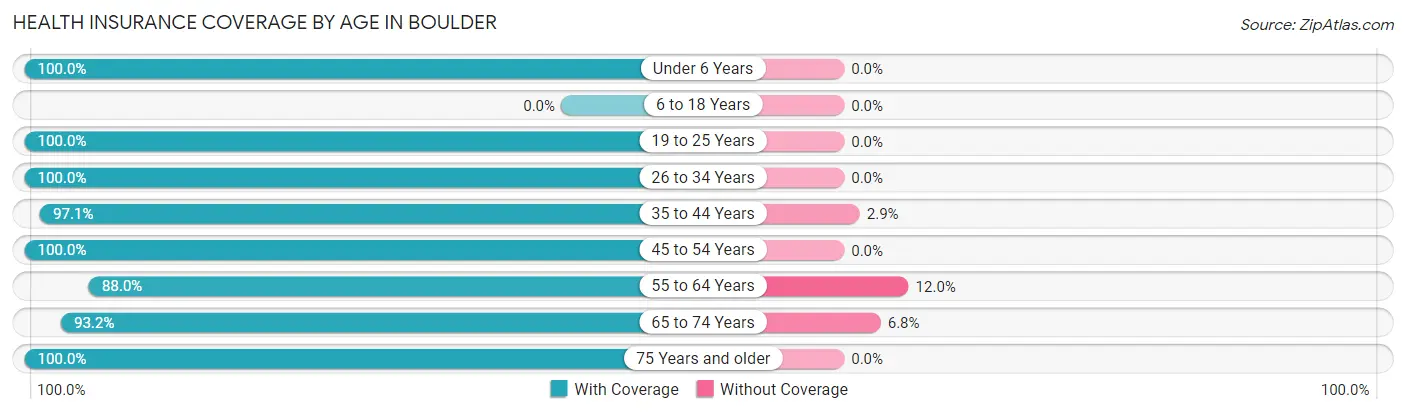
| Age Bracket | With Coverage | Without Coverage |
| Under 6 Years | 74 (100.0%) | 0 (0.0%) |
| 6 to 18 Years | 0 (0.0%) | 0 (0.0%) |
| 19 to 25 Years | 26 (100.0%) | 0 (0.0%) |
| 26 to 34 Years | 15 (100.0%) | 0 (0.0%) |
| 35 to 44 Years | 67 (97.1%) | 2 (2.9%) |
| 45 to 54 Years | 12 (100.0%) | 0 (0.0%) |
| 55 to 64 Years | 22 (88.0%) | 3 (12.0%) |
| 65 to 74 Years | 96 (93.2%) | 7 (6.8%) |
| 75 Years and older | 28 (100.0%) | 0 (0.0%) |
| Total | 340 (96.6%) | 12 (3.4%) |
Health Insurance Coverage by Citizenship Status in Boulder
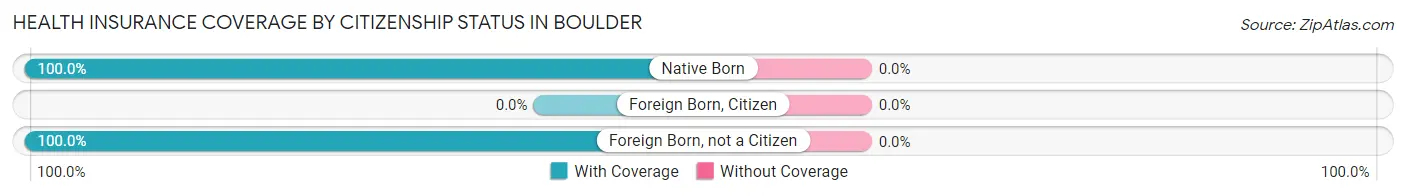
| Citizenship Status | With Coverage | Without Coverage |
| Native Born | 74 (100.0%) | 0 (0.0%) |
| Foreign Born, Citizen | 0 (0.0%) | 0 (0.0%) |
| Foreign Born, not a Citizen | 26 (100.0%) | 0 (0.0%) |
Health Insurance Coverage by Household Income in Boulder
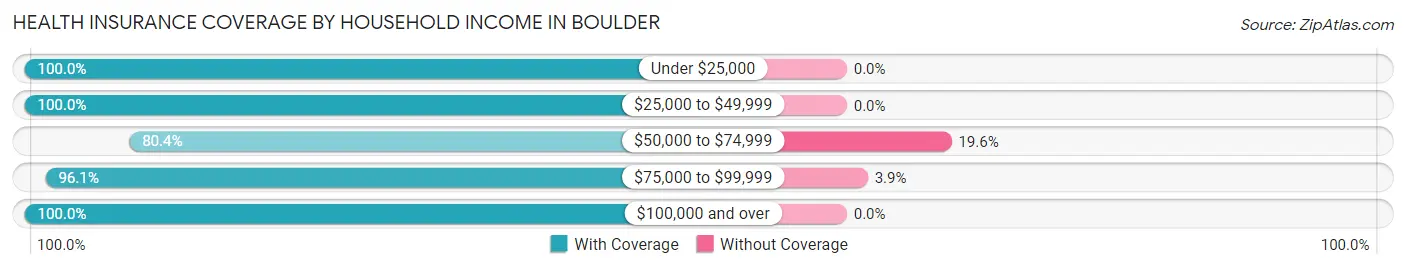
| Household Income | With Coverage | Without Coverage |
| Under $25,000 | 53 (100.0%) | 0 (0.0%) |
| $25,000 to $49,999 | 129 (100.0%) | 0 (0.0%) |
| $50,000 to $74,999 | 41 (80.4%) | 10 (19.6%) |
| $75,000 to $99,999 | 49 (96.1%) | 2 (3.9%) |
| $100,000 and over | 60 (100.0%) | 0 (0.0%) |
Public vs Private Health Insurance Coverage by Age in Boulder
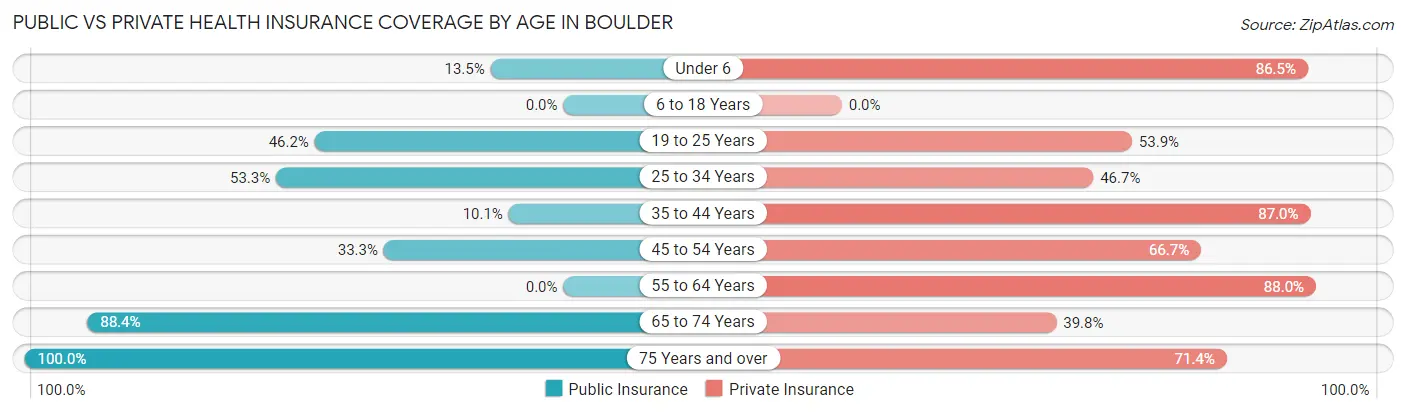
| Age Bracket | Public Insurance | Private Insurance |
| Under 6 | 10 (13.5%) | 64 (86.5%) |
| 6 to 18 Years | 0 (0.0%) | 0 (0.0%) |
| 19 to 25 Years | 12 (46.2%) | 14 (53.8%) |
| 25 to 34 Years | 8 (53.3%) | 7 (46.7%) |
| 35 to 44 Years | 7 (10.1%) | 60 (87.0%) |
| 45 to 54 Years | 4 (33.3%) | 8 (66.7%) |
| 55 to 64 Years | 0 (0.0%) | 22 (88.0%) |
| 65 to 74 Years | 91 (88.3%) | 41 (39.8%) |
| 75 Years and over | 28 (100.0%) | 20 (71.4%) |
| Total | 160 (45.5%) | 236 (67.0%) |
Disability Status by Sex by Age in Boulder
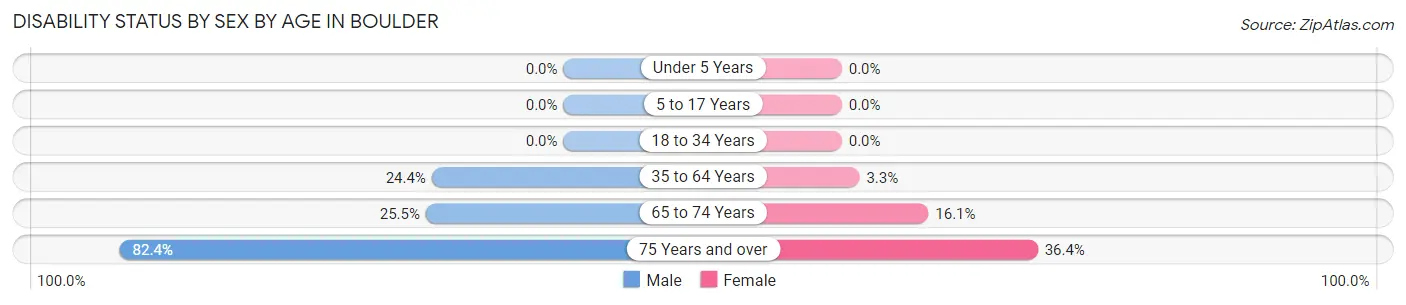
| Age Bracket | Male | Female |
| Under 5 Years | 0 (0.0%) | 0 (0.0%) |
| 5 to 17 Years | 0 (0.0%) | 0 (0.0%) |
| 18 to 34 Years | 0 (0.0%) | 0 (0.0%) |
| 35 to 64 Years | 11 (24.4%) | 2 (3.3%) |
| 65 to 74 Years | 12 (25.5%) | 9 (16.1%) |
| 75 Years and over | 14 (82.4%) | 4 (36.4%) |
Disability Class by Sex by Age in Boulder
Disability Class: Hearing Difficulty
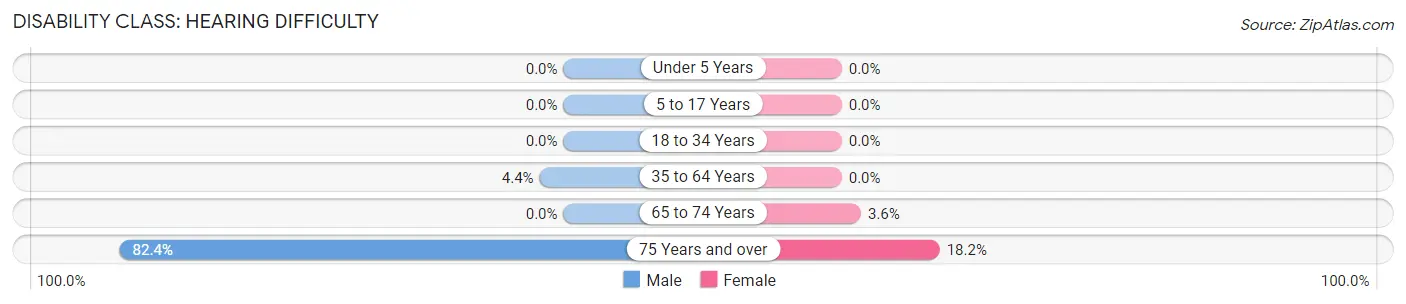
| Age Bracket | Male | Female |
| Under 5 Years | 0 (0.0%) | 0 (0.0%) |
| 5 to 17 Years | 0 (0.0%) | 0 (0.0%) |
| 18 to 34 Years | 0 (0.0%) | 0 (0.0%) |
| 35 to 64 Years | 2 (4.4%) | 0 (0.0%) |
| 65 to 74 Years | 0 (0.0%) | 2 (3.6%) |
| 75 Years and over | 14 (82.4%) | 2 (18.2%) |
Disability Class: Vision Difficulty
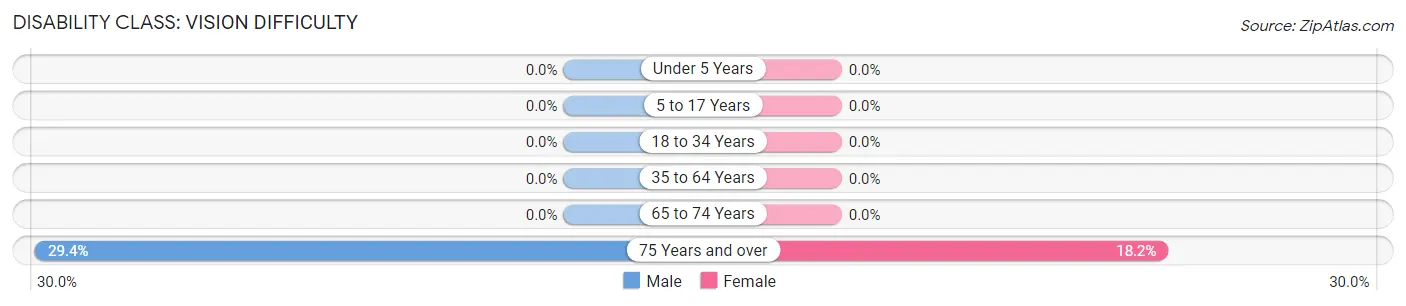
| Age Bracket | Male | Female |
| Under 5 Years | 0 (0.0%) | 0 (0.0%) |
| 5 to 17 Years | 0 (0.0%) | 0 (0.0%) |
| 18 to 34 Years | 0 (0.0%) | 0 (0.0%) |
| 35 to 64 Years | 0 (0.0%) | 0 (0.0%) |
| 65 to 74 Years | 0 (0.0%) | 0 (0.0%) |
| 75 Years and over | 5 (29.4%) | 2 (18.2%) |
Disability Class: Cognitive Difficulty
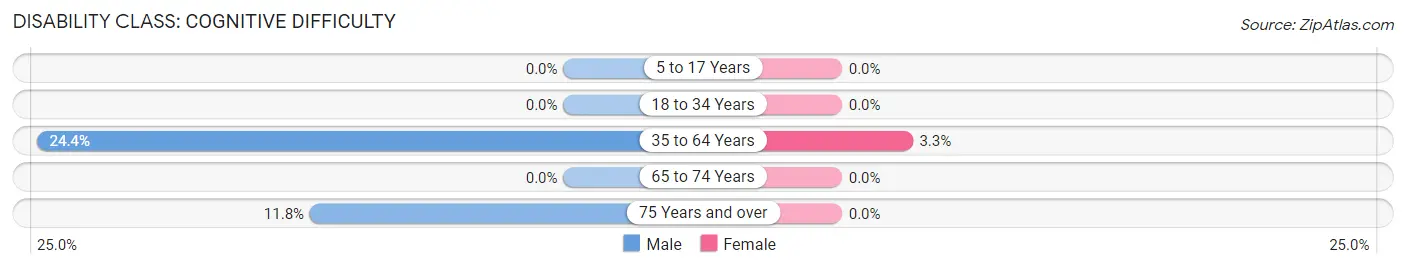
| Age Bracket | Male | Female |
| 5 to 17 Years | 0 (0.0%) | 0 (0.0%) |
| 18 to 34 Years | 0 (0.0%) | 0 (0.0%) |
| 35 to 64 Years | 11 (24.4%) | 2 (3.3%) |
| 65 to 74 Years | 0 (0.0%) | 0 (0.0%) |
| 75 Years and over | 2 (11.8%) | 0 (0.0%) |
Disability Class: Ambulatory Difficulty
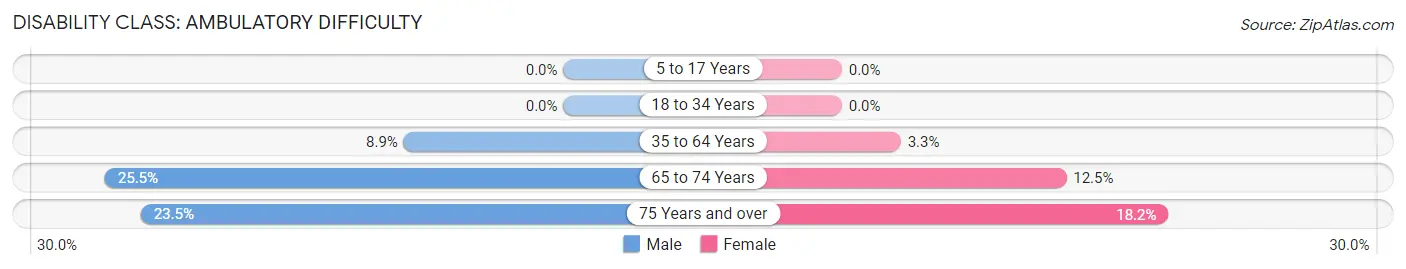
| Age Bracket | Male | Female |
| 5 to 17 Years | 0 (0.0%) | 0 (0.0%) |
| 18 to 34 Years | 0 (0.0%) | 0 (0.0%) |
| 35 to 64 Years | 4 (8.9%) | 2 (3.3%) |
| 65 to 74 Years | 12 (25.5%) | 7 (12.5%) |
| 75 Years and over | 4 (23.5%) | 2 (18.2%) |
Disability Class: Self-Care Difficulty
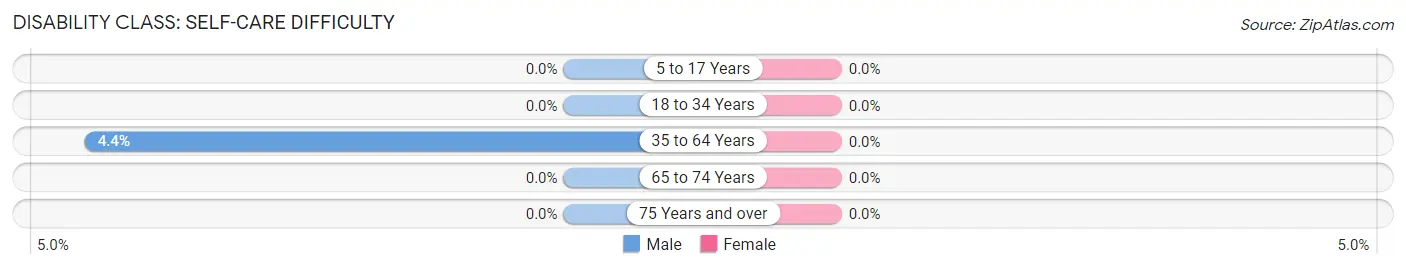
| Age Bracket | Male | Female |
| 5 to 17 Years | 0 (0.0%) | 0 (0.0%) |
| 18 to 34 Years | 0 (0.0%) | 0 (0.0%) |
| 35 to 64 Years | 2 (4.4%) | 0 (0.0%) |
| 65 to 74 Years | 0 (0.0%) | 0 (0.0%) |
| 75 Years and over | 0 (0.0%) | 0 (0.0%) |
Technology Access in Boulder
Computing Device Access in Boulder
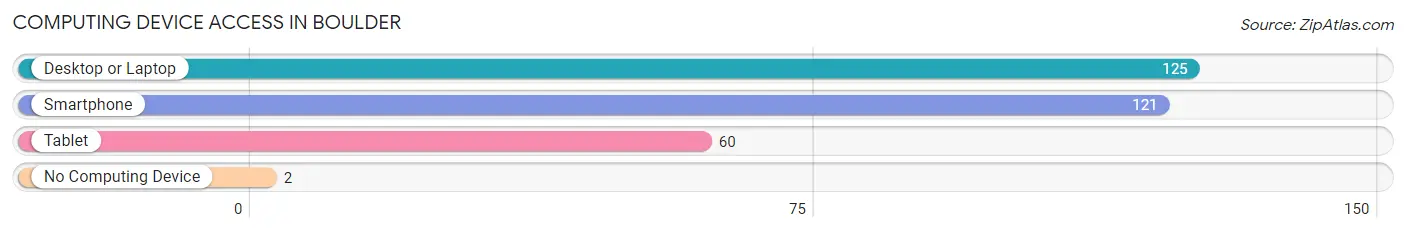
| Device Type | # Households | % Households |
| Desktop or Laptop | 125 | 87.4% |
| Smartphone | 121 | 84.6% |
| Tablet | 60 | 42.0% |
| No Computing Device | 2 | 1.4% |
| Total | 143 | 100.0% |
Internet Access in Boulder
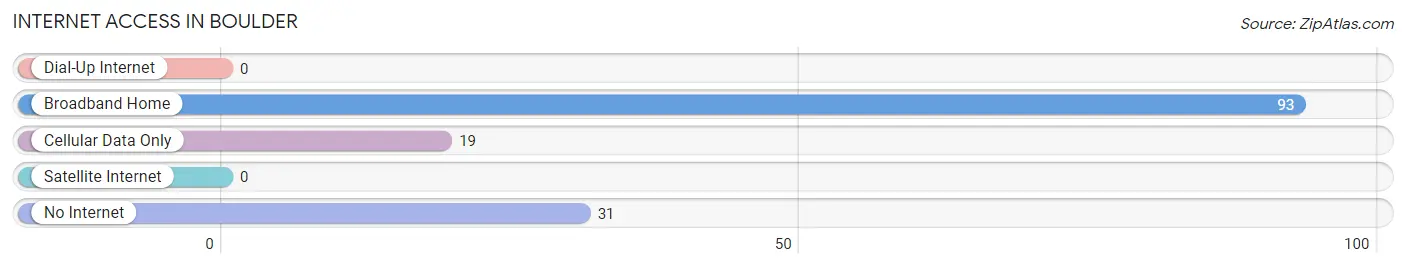
| Internet Type | # Households | % Households |
| Dial-Up Internet | 0 | 0.0% |
| Broadband Home | 93 | 65.0% |
| Cellular Data Only | 19 | 13.3% |
| Satellite Internet | 0 | 0.0% |
| No Internet | 31 | 21.7% |
| Total | 143 | 100.0% |
Boulder Summary
Boulder, Utah is a small town located in the southwestern corner of the state, near the Arizona border. It is situated in the heart of the Grand Staircase-Escalante National Monument, a protected area of stunning natural beauty. The town is surrounded by red rock canyons, sandstone cliffs, and the Escalante River. It is a popular destination for outdoor enthusiasts, offering a variety of activities such as hiking, camping, fishing, and rock climbing.
History
The area around Boulder was first settled by Mormon pioneers in the late 1800s. The town was officially founded in 1891 and named after the nearby Boulder Mountain. The town was initially a farming community, but it soon became a mining town when copper and uranium were discovered in the area. The mining industry was the main source of income for the town until the 1950s, when the mines closed and the population began to decline.
Geography
Boulder is located in the southwestern corner of Utah, near the Arizona border. It is situated in the heart of the Grand Staircase-Escalante National Monument, a protected area of stunning natural beauty. The town is surrounded by red rock canyons, sandstone cliffs, and the Escalante River. The climate is semi-arid, with hot summers and mild winters.
Economy
The economy of Boulder is largely based on tourism. The town is a popular destination for outdoor enthusiasts, offering a variety of activities such as hiking, camping, fishing, and rock climbing. There are also several restaurants, shops, and galleries in the town. The town is also home to a number of small businesses, including a gas station, a grocery store, and a hardware store.
Demographics
As of the 2010 census, the population of Boulder was 1,093. The racial makeup of the town was 94.3% White, 0.7% Native American, 0.3% Asian, 0.2% Pacific Islander, 0.1% African American, and 4.4% from other races. The median household income was $37,500, and the median age was 37. The town is served by the Garfield County School District.
Common Questions
What is the Total Population of Boulder?
Total Population of Boulder is 352.
What is the Total Male Population of Boulder?
Total Male Population of Boulder is 123.
What is the Total Female Population of Boulder?
Total Female Population of Boulder is 229.
What is the Ratio of Males per 100 Females in Boulder?
There are 53.71 Males per 100 Females in Boulder.
What is the Ratio of Females per 100 Males in Boulder?
There are 186.18 Females per 100 Males in Boulder.
What is the Median Population Age in Boulder?
Median Population Age in Boulder is 42.6 Years.
What is the Average Family Size in Boulder
Average Family Size in Boulder is 3.0 People.
What is the Average Household Size in Boulder
Average Household Size in Boulder is 2.4 People.
What is Per Capita Income in Boulder?
Per Capita income in Boulder is $29,328.
What is the Median Family Income in Boulder?
Median Family Income in Boulder is $56,875.
What is the Median Household income in Boulder?
Median Household Income in Boulder is $49,148.
What is Inequality or Gini Index in Boulder?
Inequality or Gini Index in Boulder is 0.51.
How Large is the Labor Force in Boulder?
There are 126 People in the Labor Forcein in Boulder.
What is the Percentage of People in the Labor Force in Boulder?
45.3% of People are in the Labor Force in Boulder.
What is the Unemployment Rate in Boulder?
Unemployment Rate in Boulder is 10.3%.