Zip Codes with the Highest Percentage of Households Heated by Fuel Oil / Kerosene in Tennessee
RELATED REPORTS & OPTIONS
Fuel Oil Heating
Tennessee
Compare Zip Codes
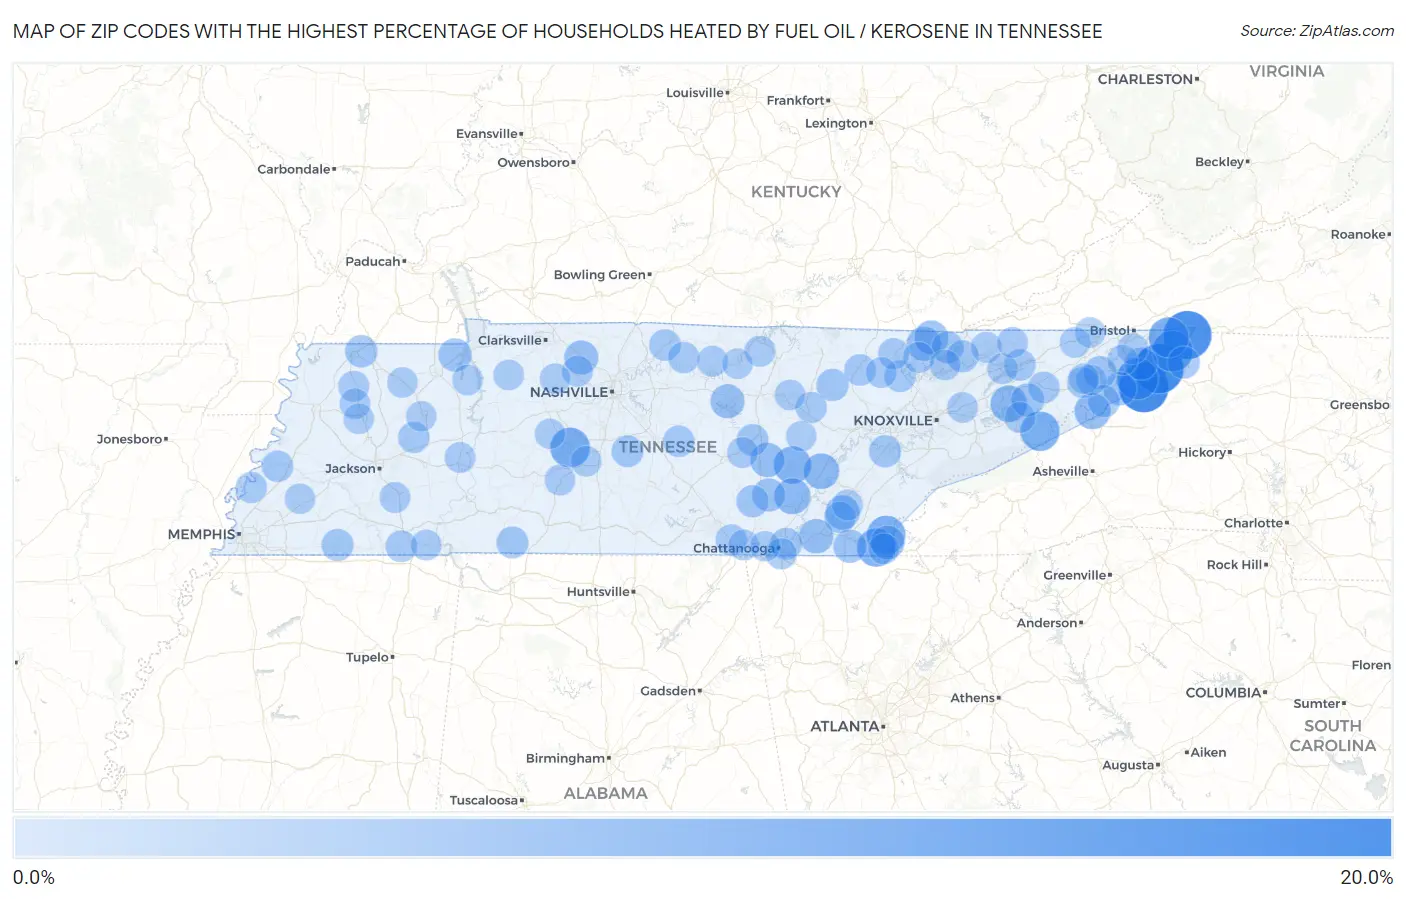
Map of Zip Codes with the Highest Percentage of Households Heated by Fuel Oil / Kerosene in Tennessee
0.0%
20.0%
Zip Codes with the Highest Percentage of Households Heated by Fuel Oil / Kerosene in Tennessee
| Zip Code | Fuel Oil Heating | vs State | vs National | |
| 1. | 37687 | 15.9% | 0.30%(+15.6)#1 | 4.2%(+11.7)#4,847 |
| 2. | 37640 | 15.8% | 0.30%(+15.5)#2 | 4.2%(+11.6)#4,864 |
| 3. | 37680 | 14.7% | 0.30%(+14.4)#3 | 4.2%(+10.5)#5,058 |
| 4. | 37658 | 9.4% | 0.30%(+9.10)#4 | 4.2%(+5.20)#6,238 |
| 5. | 37683 | 8.9% | 0.30%(+8.60)#5 | 4.2%(+4.70)#6,376 |
| 6. | 37688 | 8.4% | 0.30%(+8.10)#6 | 4.2%(+4.20)#6,557 |
| 7. | 38482 | 7.9% | 0.30%(+7.60)#7 | 4.2%(+3.70)#6,752 |
| 8. | 37727 | 7.6% | 0.30%(+7.30)#8 | 4.2%(+3.40)#6,886 |
| 9. | 37333 | 7.1% | 0.30%(+6.80)#9 | 4.2%(+2.90)#7,091 |
| 10. | 37317 | 6.9% | 0.30%(+6.60)#10 | 4.2%(+2.70)#7,161 |
| 11. | 37367 | 6.1% | 0.30%(+5.80)#11 | 4.2%(+1.90)#7,523 |
| 12. | 37890 | 5.5% | 0.30%(+5.20)#12 | 4.2%(+1.30)#7,839 |
| 13. | 37338 | 5.0% | 0.30%(+4.70)#13 | 4.2%(+0.800)#8,129 |
| 14. | 37657 | 4.9% | 0.30%(+4.60)#14 | 4.2%(+0.700)#8,202 |
| 15. | 37332 | 4.8% | 0.30%(+4.50)#15 | 4.2%(+0.600)#8,257 |
| 16. | 37353 | 3.8% | 0.30%(+3.50)#16 | 4.2%(-0.400)#8,957 |
| 17. | 38585 | 3.7% | 0.30%(+3.40)#17 | 4.2%(-0.500)#9,065 |
| 18. | 37309 | 3.6% | 0.30%(+3.30)#18 | 4.2%(-0.600)#9,151 |
| 19. | 38582 | 3.5% | 0.30%(+3.20)#19 | 4.2%(-0.700)#9,251 |
| 20. | 37729 | 3.5% | 0.30%(+3.20)#20 | 4.2%(-0.700)#9,259 |
| 21. | 37146 | 3.4% | 0.30%(+3.10)#21 | 4.2%(-0.800)#9,317 |
| 22. | 37715 | 3.4% | 0.30%(+3.10)#22 | 4.2%(-0.800)#9,373 |
| 23. | 37391 | 3.3% | 0.30%(+3.00)#23 | 4.2%(-0.900)#9,441 |
| 24. | 38222 | 2.8% | 0.30%(+2.50)#24 | 4.2%(-1.40)#9,926 |
| 25. | 37327 | 2.7% | 0.30%(+2.40)#25 | 4.2%(-1.50)#9,993 |
| 26. | 37692 | 2.7% | 0.30%(+2.40)#26 | 4.2%(-1.50)#10,009 |
| 27. | 37362 | 2.7% | 0.30%(+2.40)#27 | 4.2%(-1.50)#10,017 |
| 28. | 37713 | 2.7% | 0.30%(+2.40)#28 | 4.2%(-1.50)#10,047 |
| 29. | 37659 | 2.4% | 0.30%(+2.10)#29 | 4.2%(-1.80)#10,325 |
| 30. | 37643 | 2.3% | 0.30%(+2.00)#30 | 4.2%(-1.90)#10,442 |
| 31. | 38257 | 2.1% | 0.30%(+1.80)#31 | 4.2%(-2.10)#10,784 |
| 32. | 37726 | 2.1% | 0.30%(+1.80)#32 | 4.2%(-2.10)#10,808 |
| 33. | 37691 | 2.1% | 0.30%(+1.80)#33 | 4.2%(-2.10)#10,857 |
| 34. | 37650 | 2.0% | 0.30%(+1.70)#34 | 4.2%(-2.20)#10,905 |
| 35. | 37365 | 2.0% | 0.30%(+1.70)#35 | 4.2%(-2.20)#10,968 |
| 36. | 37774 | 1.9% | 0.30%(+1.60)#36 | 4.2%(-2.30)#11,033 |
| 37. | 37870 | 1.9% | 0.30%(+1.60)#37 | 4.2%(-2.30)#11,096 |
| 38. | 38039 | 1.9% | 0.30%(+1.60)#38 | 4.2%(-2.30)#11,138 |
| 39. | 37825 | 1.8% | 0.30%(+1.50)#39 | 4.2%(-2.40)#11,244 |
| 40. | 38463 | 1.8% | 0.30%(+1.50)#40 | 4.2%(-2.40)#11,284 |
| 41. | 37406 | 1.7% | 0.30%(+1.40)#41 | 4.2%(-2.50)#11,375 |
| 42. | 37060 | 1.7% | 0.30%(+1.40)#42 | 4.2%(-2.50)#11,430 |
| 43. | 38559 | 1.7% | 0.30%(+1.40)#43 | 4.2%(-2.50)#11,461 |
| 44. | 37714 | 1.6% | 0.30%(+1.30)#44 | 4.2%(-2.60)#11,574 |
| 45. | 38367 | 1.6% | 0.30%(+1.30)#45 | 4.2%(-2.60)#11,595 |
| 46. | 37022 | 1.5% | 0.30%(+1.20)#46 | 4.2%(-2.70)#11,757 |
| 47. | 37818 | 1.5% | 0.30%(+1.20)#47 | 4.2%(-2.70)#11,765 |
| 48. | 37811 | 1.5% | 0.30%(+1.20)#48 | 4.2%(-2.70)#11,773 |
| 49. | 37852 | 1.5% | 0.30%(+1.20)#49 | 4.2%(-2.70)#11,782 |
| 50. | 37149 | 1.5% | 0.30%(+1.20)#50 | 4.2%(-2.70)#11,798 |
| 51. | 38041 | 1.4% | 0.30%(+1.10)#51 | 4.2%(-2.80)#11,953 |
| 52. | 37310 | 1.4% | 0.30%(+1.10)#52 | 4.2%(-2.80)#11,960 |
| 53. | 38321 | 1.4% | 0.30%(+1.10)#53 | 4.2%(-2.80)#11,973 |
| 54. | 37074 | 1.3% | 0.30%(+1.00)#54 | 4.2%(-2.90)#12,103 |
| 55. | 37380 | 1.3% | 0.30%(+1.00)#55 | 4.2%(-2.90)#12,125 |
| 56. | 38023 | 1.3% | 0.30%(+1.00)#56 | 4.2%(-2.90)#12,133 |
| 57. | 37766 | 1.2% | 0.30%(+0.900)#57 | 4.2%(-3.00)#12,294 |
| 58. | 38571 | 1.2% | 0.30%(+0.900)#58 | 4.2%(-3.00)#12,307 |
| 59. | 37847 | 1.2% | 0.30%(+0.900)#59 | 4.2%(-3.00)#12,380 |
| 60. | 37407 | 1.1% | 0.30%(+0.800)#60 | 4.2%(-3.10)#12,530 |
| 61. | 37641 | 1.1% | 0.30%(+0.800)#61 | 4.2%(-3.10)#12,534 |
| 62. | 37821 | 1.0% | 0.30%(+0.700)#62 | 4.2%(-3.20)#12,724 |
| 63. | 37015 | 1.0% | 0.30%(+0.700)#63 | 4.2%(-3.20)#12,737 |
| 64. | 37618 | 1.0% | 0.30%(+0.700)#64 | 4.2%(-3.20)#12,763 |
| 65. | 38340 | 1.0% | 0.30%(+0.700)#65 | 4.2%(-3.20)#12,764 |
| 66. | 37879 | 1.0% | 0.30%(+0.700)#66 | 4.2%(-3.20)#12,767 |
| 67. | 37370 | 1.0% | 0.30%(+0.700)#67 | 4.2%(-3.20)#12,803 |
| 68. | 38581 | 1.0% | 0.30%(+0.700)#68 | 4.2%(-3.20)#12,821 |
| 69. | 38233 | 1.0% | 0.30%(+0.700)#69 | 4.2%(-3.20)#12,843 |
| 70. | 37145 | 1.0% | 0.30%(+0.700)#70 | 4.2%(-3.20)#12,849 |
| 71. | 38568 | 1.0% | 0.30%(+0.700)#71 | 4.2%(-3.20)#12,869 |
| 72. | 38474 | 0.90% | 0.30%(+0.600)#72 | 4.2%(-3.30)#13,048 |
| 73. | 37347 | 0.90% | 0.30%(+0.600)#73 | 4.2%(-3.30)#13,052 |
| 74. | 37708 | 0.90% | 0.30%(+0.600)#74 | 4.2%(-3.30)#13,070 |
| 75. | 38363 | 0.90% | 0.30%(+0.600)#75 | 4.2%(-3.30)#13,080 |
| 76. | 37869 | 0.90% | 0.30%(+0.600)#76 | 4.2%(-3.30)#13,091 |
| 77. | 38330 | 0.90% | 0.30%(+0.600)#77 | 4.2%(-3.30)#13,101 |
| 78. | 37756 | 0.90% | 0.30%(+0.600)#78 | 4.2%(-3.30)#13,117 |
| 79. | 37866 | 0.90% | 0.30%(+0.600)#79 | 4.2%(-3.30)#13,144 |
| 80. | 38401 | 0.80% | 0.30%(+0.500)#80 | 4.2%(-3.40)#13,214 |
| 81. | 37871 | 0.80% | 0.30%(+0.500)#81 | 4.2%(-3.40)#13,354 |
| 82. | 38574 | 0.80% | 0.30%(+0.500)#82 | 4.2%(-3.40)#13,363 |
| 83. | 37061 | 0.80% | 0.30%(+0.500)#83 | 4.2%(-3.40)#13,393 |
| 84. | 37690 | 0.80% | 0.30%(+0.500)#84 | 4.2%(-3.40)#13,402 |
| 85. | 38357 | 0.80% | 0.30%(+0.500)#85 | 4.2%(-3.40)#13,432 |
| 86. | 38221 | 0.80% | 0.30%(+0.500)#86 | 4.2%(-3.40)#13,440 |
| 87. | 37326 | 0.80% | 0.30%(+0.500)#87 | 4.2%(-3.40)#13,517 |
| 88. | 37642 | 0.70% | 0.30%(+0.400)#88 | 4.2%(-3.50)#13,645 |
| 89. | 38382 | 0.70% | 0.30%(+0.400)#89 | 4.2%(-3.50)#13,688 |
| 90. | 38562 | 0.70% | 0.30%(+0.400)#90 | 4.2%(-3.50)#13,706 |
| 91. | 37036 | 0.70% | 0.30%(+0.400)#91 | 4.2%(-3.50)#13,707 |
| 92. | 37681 | 0.70% | 0.30%(+0.400)#92 | 4.2%(-3.50)#13,710 |
| 93. | 37665 | 0.70% | 0.30%(+0.400)#93 | 4.2%(-3.50)#13,717 |
| 94. | 38049 | 0.70% | 0.30%(+0.400)#94 | 4.2%(-3.50)#13,743 |
| 95. | 38229 | 0.70% | 0.30%(+0.400)#95 | 4.2%(-3.50)#13,783 |
| 96. | 37694 | 0.70% | 0.30%(+0.400)#96 | 4.2%(-3.50)#13,804 |
| 97. | 38572 | 0.60% | 0.30%(+0.300)#97 | 4.2%(-3.60)#14,047 |
| 98. | 38344 | 0.60% | 0.30%(+0.300)#98 | 4.2%(-3.60)#14,073 |
| 99. | 37419 | 0.60% | 0.30%(+0.300)#99 | 4.2%(-3.60)#14,107 |
| 100. | 37098 | 0.60% | 0.30%(+0.300)#100 | 4.2%(-3.60)#14,110 |
Common Questions
What are the Top 10 Zip Codes with the Highest Percentage of Households Heated by Fuel Oil / Kerosene in Tennessee?
Top 10 Zip Codes with the Highest Percentage of Households Heated by Fuel Oil / Kerosene in Tennessee are:
What zip code has the Highest Percentage of Households Heated by Fuel Oil / Kerosene in Tennessee?
37687 has the Highest Percentage of Households Heated by Fuel Oil / Kerosene in Tennessee with 15.9%.
What is the Percentage of Households Heated by Fuel Oil / Kerosene in the State of Tennessee?
Percentage of Households Heated by Fuel Oil / Kerosene in Tennessee is 0.30%.
What is the Percentage of Households Heated by Fuel Oil / Kerosene in the United States?
Percentage of Households Heated by Fuel Oil / Kerosene in the United States is 4.2%.