Zip Codes with the Highest Percentage of Households Heated by Fuel Oil / Kerosene in Idaho
RELATED REPORTS & OPTIONS
Fuel Oil Heating
Idaho
Compare Zip Codes
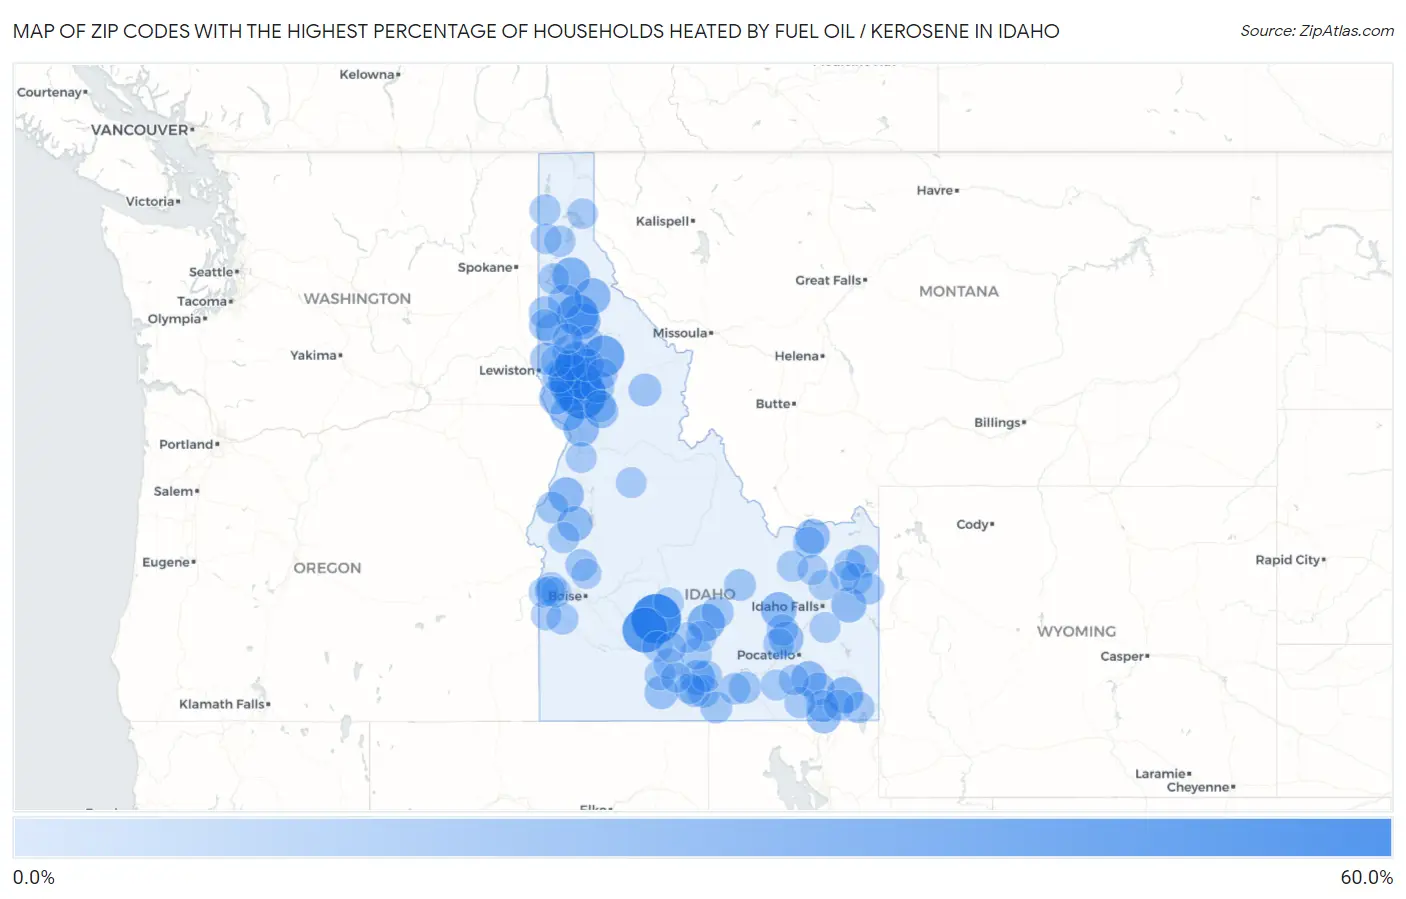
Map of Zip Codes with the Highest Percentage of Households Heated by Fuel Oil / Kerosene in Idaho
0.0%
60.0%
Zip Codes with the Highest Percentage of Households Heated by Fuel Oil / Kerosene in Idaho
| Zip Code | Fuel Oil Heating | vs State | vs National | |
| 1. | 83322 | 60.0% | 1.5%(+58.5)#1 | 4.2%(+55.8)#1,108 |
| 2. | 83533 | 53.4% | 1.5%(+51.9)#2 | 4.2%(+49.2)#1,600 |
| 3. | 83337 | 46.7% | 1.5%(+45.2)#3 | 4.2%(+42.5)#2,071 |
| 4. | 83548 | 40.9% | 1.5%(+39.4)#4 | 4.2%(+36.7)#2,506 |
| 5. | 83830 | 35.6% | 1.5%(+34.1)#5 | 4.2%(+31.4)#2,896 |
| 6. | 83546 | 35.2% | 1.5%(+33.7)#6 | 4.2%(+31.0)#2,937 |
| 7. | 83523 | 32.7% | 1.5%(+31.2)#7 | 4.2%(+28.5)#3,120 |
| 8. | 83526 | 26.7% | 1.5%(+25.2)#8 | 4.2%(+22.5)#3,614 |
| 9. | 83520 | 26.4% | 1.5%(+24.9)#9 | 4.2%(+22.2)#3,643 |
| 10. | 83545 | 25.6% | 1.5%(+24.1)#10 | 4.2%(+21.4)#3,713 |
| 11. | 83810 | 24.4% | 1.5%(+22.9)#11 | 4.2%(+20.2)#3,830 |
| 12. | 83348 | 23.5% | 1.5%(+22.0)#12 | 4.2%(+19.3)#3,924 |
| 13. | 83283 | 20.9% | 1.5%(+19.4)#13 | 4.2%(+16.7)#4,188 |
| 14. | 83543 | 20.2% | 1.5%(+18.7)#14 | 4.2%(+16.0)#4,259 |
| 15. | 83812 | 20.0% | 1.5%(+18.5)#15 | 4.2%(+15.8)#4,295 |
| 16. | 83808 | 19.5% | 1.5%(+18.0)#16 | 4.2%(+15.3)#4,350 |
| 17. | 83215 | 18.8% | 1.5%(+17.3)#17 | 4.2%(+14.6)#4,423 |
| 18. | 83554 | 18.6% | 1.5%(+17.1)#18 | 4.2%(+14.4)#4,449 |
| 19. | 83612 | 17.5% | 1.5%(+16.0)#19 | 4.2%(+13.3)#4,592 |
| 20. | 83214 | 17.5% | 1.5%(+16.0)#20 | 4.2%(+13.3)#4,593 |
| 21. | 83443 | 17.0% | 1.5%(+15.5)#21 | 4.2%(+12.8)#4,673 |
| 22. | 83632 | 16.8% | 1.5%(+15.3)#22 | 4.2%(+12.6)#4,710 |
| 23. | 83325 | 16.4% | 1.5%(+14.9)#23 | 4.2%(+12.2)#4,777 |
| 24. | 83446 | 15.8% | 1.5%(+14.3)#24 | 4.2%(+11.6)#4,876 |
| 25. | 83522 | 15.2% | 1.5%(+13.7)#25 | 4.2%(+11.0)#4,959 |
| 26. | 83277 | 15.0% | 1.5%(+13.5)#26 | 4.2%(+10.8)#4,997 |
| 27. | 83286 | 14.7% | 1.5%(+13.2)#27 | 4.2%(+10.5)#5,051 |
| 28. | 83555 | 14.2% | 1.5%(+12.7)#28 | 4.2%(+10.00)#5,149 |
| 29. | 83861 | 13.6% | 1.5%(+12.1)#29 | 4.2%(+9.40)#5,237 |
| 30. | 83530 | 13.0% | 1.5%(+11.5)#30 | 4.2%(+8.80)#5,344 |
| 31. | 83536 | 12.4% | 1.5%(+10.9)#31 | 4.2%(+8.20)#5,486 |
| 32. | 83321 | 12.4% | 1.5%(+10.9)#32 | 4.2%(+8.20)#5,498 |
| 33. | 83857 | 11.8% | 1.5%(+10.3)#33 | 4.2%(+7.60)#5,624 |
| 34. | 83524 | 10.7% | 1.5%(+9.20)#34 | 4.2%(+6.50)#5,897 |
| 35. | 83544 | 10.6% | 1.5%(+9.10)#35 | 4.2%(+6.40)#5,916 |
| 36. | 83539 | 10.3% | 1.5%(+8.80)#36 | 4.2%(+6.10)#5,993 |
| 37. | 83420 | 10.2% | 1.5%(+8.70)#37 | 4.2%(+6.00)#6,020 |
| 38. | 83537 | 10.2% | 1.5%(+8.70)#38 | 4.2%(+6.00)#6,023 |
| 39. | 83234 | 9.9% | 1.5%(+8.40)#39 | 4.2%(+5.70)#6,098 |
| 40. | 83344 | 9.8% | 1.5%(+8.30)#40 | 4.2%(+5.60)#6,127 |
| 41. | 83320 | 9.2% | 1.5%(+7.70)#41 | 4.2%(+5.00)#6,302 |
| 42. | 83832 | 8.9% | 1.5%(+7.40)#42 | 4.2%(+4.70)#6,389 |
| 43. | 83824 | 8.8% | 1.5%(+7.30)#43 | 4.2%(+4.60)#6,440 |
| 44. | 83323 | 8.6% | 1.5%(+7.10)#44 | 4.2%(+4.40)#6,497 |
| 45. | 83228 | 8.5% | 1.5%(+7.00)#45 | 4.2%(+4.30)#6,526 |
| 46. | 83552 | 8.1% | 1.5%(+6.60)#46 | 4.2%(+3.90)#6,686 |
| 47. | 83255 | 7.8% | 1.5%(+6.30)#47 | 4.2%(+3.60)#6,801 |
| 48. | 83610 | 7.8% | 1.5%(+6.30)#48 | 4.2%(+3.60)#6,803 |
| 49. | 83855 | 7.6% | 1.5%(+6.10)#49 | 4.2%(+3.40)#6,890 |
| 50. | 83346 | 7.5% | 1.5%(+6.00)#50 | 4.2%(+3.30)#6,931 |
| 51. | 83670 | 7.5% | 1.5%(+6.00)#51 | 4.2%(+3.30)#6,938 |
| 52. | 83436 | 7.4% | 1.5%(+5.90)#52 | 4.2%(+3.20)#6,974 |
| 53. | 83334 | 7.2% | 1.5%(+5.70)#53 | 4.2%(+3.00)#7,036 |
| 54. | 83335 | 7.2% | 1.5%(+5.70)#54 | 4.2%(+3.00)#7,037 |
| 55. | 83641 | 6.9% | 1.5%(+5.40)#55 | 4.2%(+2.70)#7,157 |
| 56. | 83262 | 6.9% | 1.5%(+5.40)#56 | 4.2%(+2.70)#7,166 |
| 57. | 83324 | 6.8% | 1.5%(+5.30)#57 | 4.2%(+2.60)#7,208 |
| 58. | 83423 | 6.6% | 1.5%(+5.10)#58 | 4.2%(+2.40)#7,316 |
| 59. | 83223 | 6.6% | 1.5%(+5.10)#59 | 4.2%(+2.40)#7,323 |
| 60. | 83311 | 6.5% | 1.5%(+5.00)#60 | 4.2%(+2.30)#7,357 |
| 61. | 83422 | 6.4% | 1.5%(+4.90)#61 | 4.2%(+2.20)#7,389 |
| 62. | 83421 | 6.4% | 1.5%(+4.90)#62 | 4.2%(+2.20)#7,418 |
| 63. | 83645 | 6.1% | 1.5%(+4.60)#63 | 4.2%(+1.90)#7,553 |
| 64. | 83535 | 6.0% | 1.5%(+4.50)#64 | 4.2%(+1.80)#7,590 |
| 65. | 83801 | 5.8% | 1.5%(+4.30)#65 | 4.2%(+1.60)#7,678 |
| 66. | 83252 | 5.7% | 1.5%(+4.20)#66 | 4.2%(+1.50)#7,736 |
| 67. | 83435 | 5.6% | 1.5%(+4.10)#67 | 4.2%(+1.40)#7,813 |
| 68. | 83271 | 5.4% | 1.5%(+3.90)#68 | 4.2%(+1.20)#7,931 |
| 69. | 83856 | 5.3% | 1.5%(+3.80)#69 | 4.2%(+1.10)#7,960 |
| 70. | 83833 | 5.2% | 1.5%(+3.70)#70 | 4.2%(+1.00)#8,026 |
| 71. | 83210 | 5.0% | 1.5%(+3.50)#71 | 4.2%(+0.800)#8,127 |
| 72. | 83549 | 4.9% | 1.5%(+3.40)#72 | 4.2%(+0.700)#8,206 |
| 73. | 83656 | 4.8% | 1.5%(+3.30)#73 | 4.2%(+0.600)#8,276 |
| 74. | 83316 | 4.7% | 1.5%(+3.20)#74 | 4.2%(+0.500)#8,301 |
| 75. | 83869 | 4.7% | 1.5%(+3.20)#75 | 4.2%(+0.500)#8,308 |
| 76. | 83349 | 4.7% | 1.5%(+3.20)#76 | 4.2%(+0.500)#8,335 |
| 77. | 83541 | 4.7% | 1.5%(+3.20)#77 | 4.2%(+0.500)#8,337 |
| 78. | 83236 | 4.6% | 1.5%(+3.10)#78 | 4.2%(+0.400)#8,400 |
| 79. | 83553 | 4.6% | 1.5%(+3.10)#79 | 4.2%(+0.400)#8,410 |
| 80. | 83827 | 4.5% | 1.5%(+3.00)#80 | 4.2%(+0.300)#8,478 |
| 81. | 83611 | 4.4% | 1.5%(+2.90)#81 | 4.2%(+0.200)#8,517 |
| 82. | 83314 | 4.4% | 1.5%(+2.90)#82 | 4.2%(+0.200)#8,541 |
| 83. | 83212 | 4.4% | 1.5%(+2.90)#83 | 4.2%(+0.200)#8,548 |
| 84. | 83355 | 4.3% | 1.5%(+2.80)#84 | 4.2%(+0.100)#8,571 |
| 85. | 83263 | 4.2% | 1.5%(+2.70)#85 | 4.2%(=0.000)#8,647 |
| 86. | 83836 | 4.1% | 1.5%(+2.60)#86 | 4.2%(-0.100)#8,767 |
| 87. | 83639 | 3.9% | 1.5%(+2.40)#87 | 4.2%(-0.300)#8,876 |
| 88. | 83341 | 3.8% | 1.5%(+2.30)#88 | 4.2%(-0.400)#8,946 |
| 89. | 83607 | 3.6% | 1.5%(+2.10)#89 | 4.2%(-0.600)#9,112 |
| 90. | 83328 | 3.6% | 1.5%(+2.10)#90 | 4.2%(-0.600)#9,131 |
| 91. | 83352 | 3.6% | 1.5%(+2.10)#91 | 4.2%(-0.600)#9,139 |
| 92. | 83823 | 3.5% | 1.5%(+2.00)#92 | 4.2%(-0.700)#9,258 |
| 93. | 83676 | 3.4% | 1.5%(+1.90)#93 | 4.2%(-0.800)#9,329 |
| 94. | 83629 | 3.4% | 1.5%(+1.90)#94 | 4.2%(-0.800)#9,348 |
| 95. | 83626 | 3.4% | 1.5%(+1.90)#95 | 4.2%(-0.800)#9,357 |
| 96. | 83451 | 3.4% | 1.5%(+1.90)#96 | 4.2%(-0.800)#9,365 |
| 97. | 83330 | 3.3% | 1.5%(+1.80)#97 | 4.2%(-0.900)#9,414 |
| 98. | 83434 | 3.3% | 1.5%(+1.80)#98 | 4.2%(-0.900)#9,448 |
| 99. | 83327 | 3.3% | 1.5%(+1.80)#99 | 4.2%(-0.900)#9,456 |
| 100. | 83425 | 3.3% | 1.5%(+1.80)#100 | 4.2%(-0.900)#9,463 |
Common Questions
What are the Top 10 Zip Codes with the Highest Percentage of Households Heated by Fuel Oil / Kerosene in Idaho?
Top 10 Zip Codes with the Highest Percentage of Households Heated by Fuel Oil / Kerosene in Idaho are:
What zip code has the Highest Percentage of Households Heated by Fuel Oil / Kerosene in Idaho?
83322 has the Highest Percentage of Households Heated by Fuel Oil / Kerosene in Idaho with 60.0%.
What is the Percentage of Households Heated by Fuel Oil / Kerosene in the State of Idaho?
Percentage of Households Heated by Fuel Oil / Kerosene in Idaho is 1.5%.
What is the Percentage of Households Heated by Fuel Oil / Kerosene in the United States?
Percentage of Households Heated by Fuel Oil / Kerosene in the United States is 4.2%.