Zip Codes with the Highest Percentage of Population Employed in Security & Protection in Murfreesboro, TN
RELATED REPORTS & OPTIONS
Security & Protection
Murfreesboro
Compare Zip Codes
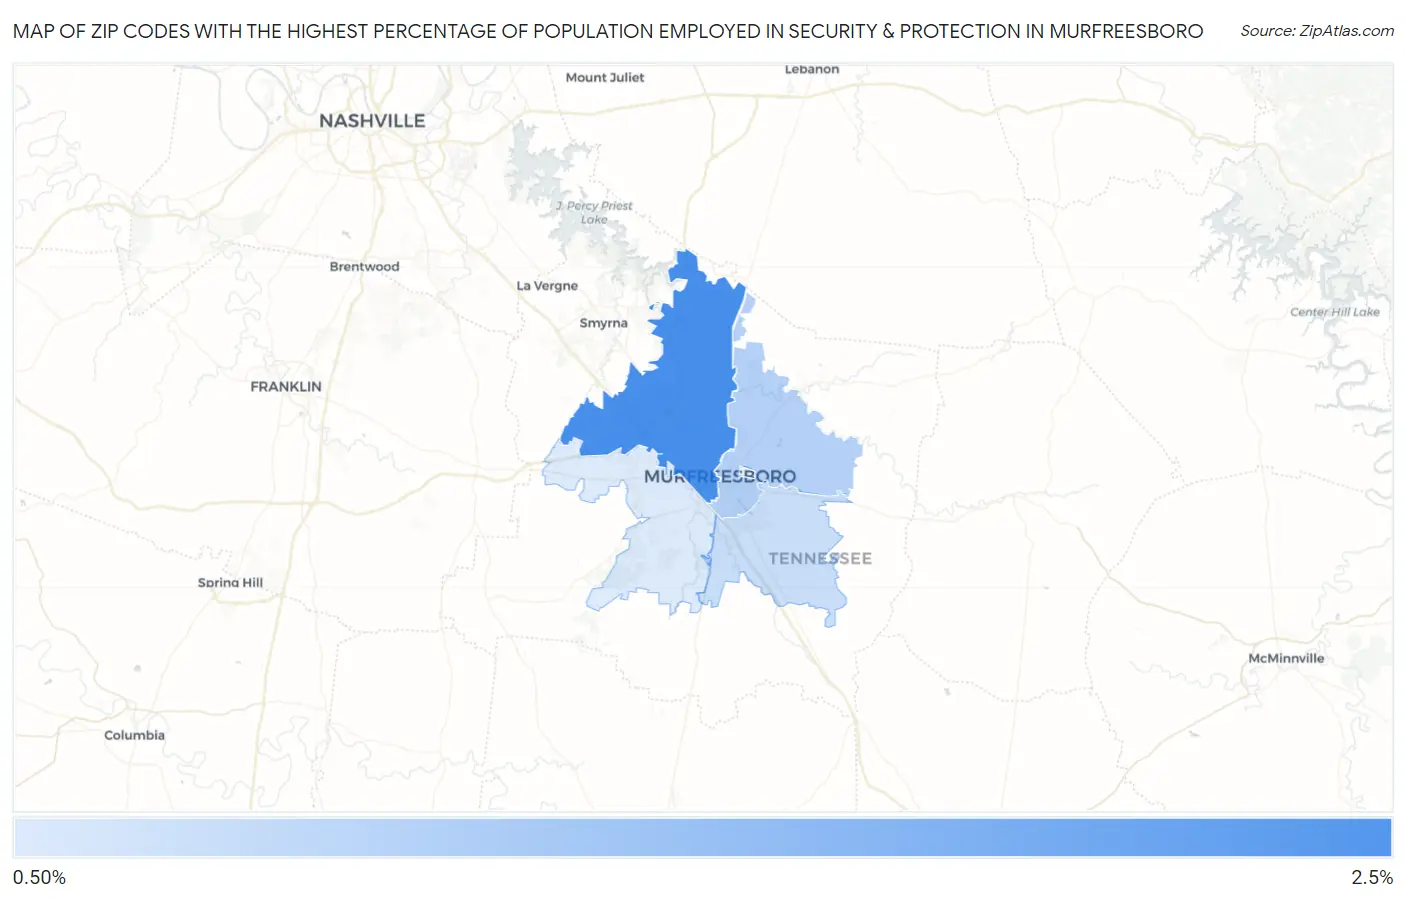
Map of Zip Codes with the Highest Percentage of Population Employed in Security & Protection in Murfreesboro
0.0%
2.5%
Zip Codes with the Highest Percentage of Population Employed in Security & Protection in Murfreesboro, TN
| Zip Code | % Employed | vs State | vs National | |
| 1. | 37129 | 2.2% | 2.1%(+0.073)#233 | 2.1%(+0.018)#11,467 |
| 2. | 37130 | 1.6% | 2.1%(-0.487)#316 | 2.1%(-0.542)#15,367 |
| 3. | 37127 | 1.5% | 2.1%(-0.595)#331 | 2.1%(-0.650)#16,217 |
| 4. | 37128 | 1.4% | 2.1%(-0.705)#345 | 2.1%(-0.759)#17,031 |
1
Common Questions
What are the Top 3 Zip Codes with the Highest Percentage of Population Employed in Security & Protection in Murfreesboro, TN?
Top 3 Zip Codes with the Highest Percentage of Population Employed in Security & Protection in Murfreesboro, TN are:
What zip code has the Highest Percentage of Population Employed in Security & Protection in Murfreesboro, TN?
37129 has the Highest Percentage of Population Employed in Security & Protection in Murfreesboro, TN with 2.2%.
What is the Percentage of Population Employed in Security & Protection in Murfreesboro, TN?
Percentage of Population Employed in Security & Protection in Murfreesboro is 1.6%.
What is the Percentage of Population Employed in Security & Protection in Tennessee?
Percentage of Population Employed in Security & Protection in Tennessee is 2.1%.
What is the Percentage of Population Employed in Security & Protection in the United States?
Percentage of Population Employed in Security & Protection in the United States is 2.1%.