Cities with the Highest Poverty Level Among Seniors Over the Age of 75 in South Dakota
RELATED REPORTS & OPTIONS
Highest Poverty | Seniors 75+
South Dakota
Compare Cities
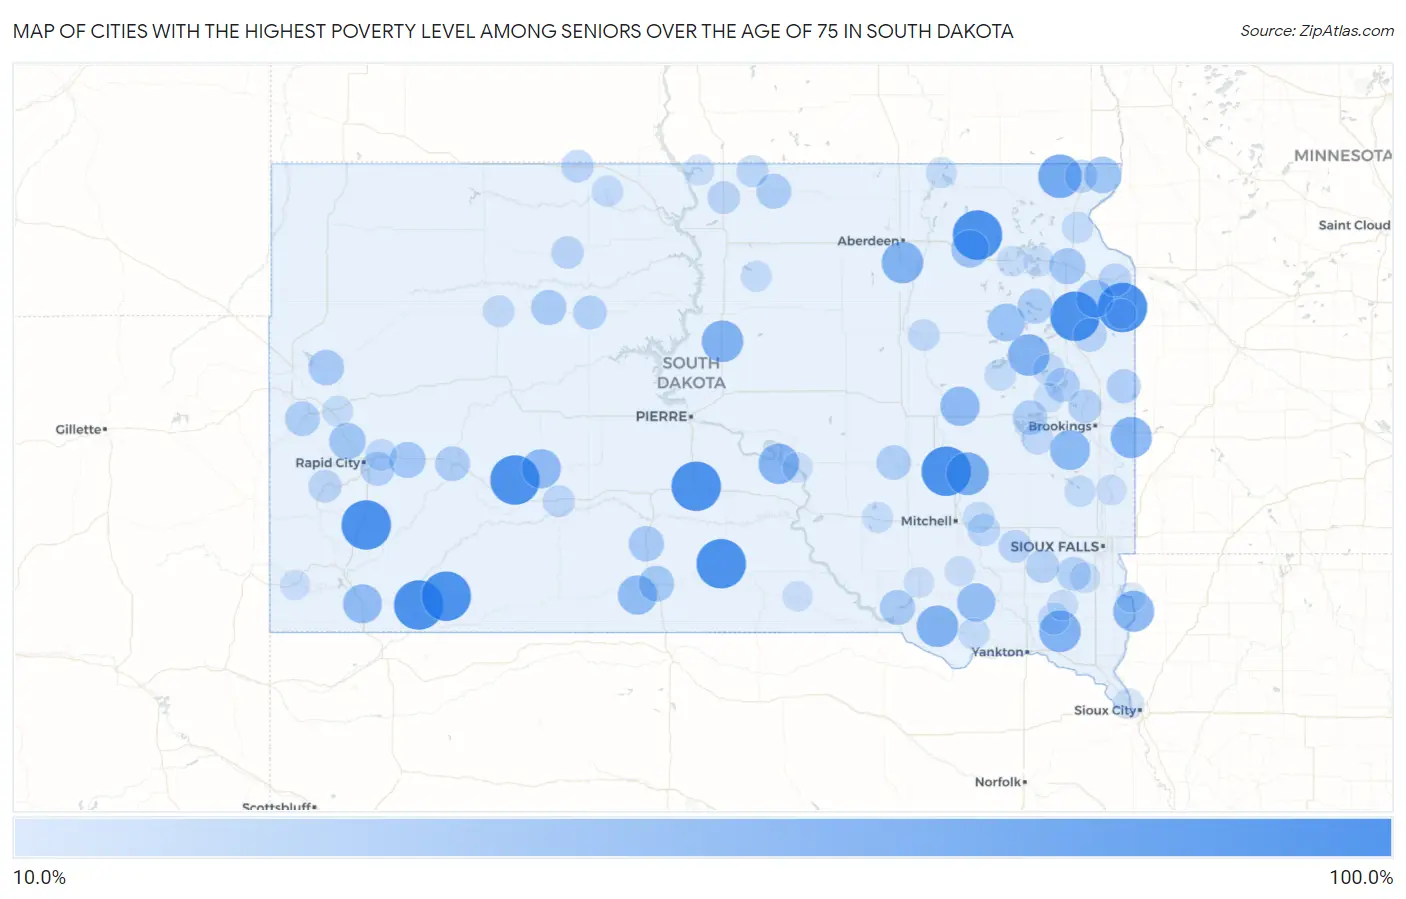
Map of Cities with the Highest Poverty Level Among Seniors Over the Age of 75 in South Dakota
0.0%
100.0%
Cities with the Highest Poverty Level Among Seniors Over the Age of 75 in South Dakota
| City | Senior Poverty | vs State | vs National | |
| 1. | Oglala | 100.0% | 11.6%(+88.4)#1 | 11.1%(+88.9)#16 |
| 2. | Manderson White Horse Creek | 100.0% | 11.6%(+88.4)#2 | 11.1%(+88.9)#58 |
| 3. | Pierpont | 100.0% | 11.6%(+88.4)#3 | 11.1%(+88.9)#224 |
| 4. | Peever Flats | 100.0% | 11.6%(+88.4)#4 | 11.1%(+88.9)#243 |
| 5. | Cottonwood | 100.0% | 11.6%(+88.4)#5 | 11.1%(+88.9)#268 |
| 6. | Evergreen Colony | 100.0% | 11.6%(+88.4)#6 | 11.1%(+88.9)#282 |
| 7. | New Witten | 100.0% | 11.6%(+88.4)#7 | 11.1%(+88.9)#287 |
| 8. | Clark Colony | 100.0% | 11.6%(+88.4)#8 | 11.1%(+88.9)#298 |
| 9. | Shamrock Colony | 100.0% | 11.6%(+88.4)#9 | 11.1%(+88.9)#320 |
| 10. | Vivian | 100.0% | 11.6%(+88.4)#10 | 11.1%(+88.9)#324 |
| 11. | New Elm Spring Colony | 100.0% | 11.6%(+88.4)#11 | 11.1%(+88.9)#338 |
| 12. | Forestburg | 100.0% | 11.6%(+88.4)#12 | 11.1%(+88.9)#341 |
| 13. | Fairburn | 100.0% | 11.6%(+88.4)#13 | 11.1%(+88.9)#352 |
| 14. | Waverly | 100.0% | 11.6%(+88.4)#14 | 11.1%(+88.9)#376 |
| 15. | Albee | 100.0% | 11.6%(+88.4)#15 | 11.1%(+88.9)#399 |
| 16. | Golden View Colony | 78.6% | 11.6%(+67.0)#16 | 11.1%(+67.5)#511 |
| 17. | Claire City | 75.0% | 11.6%(+63.4)#17 | 11.1%(+63.9)#567 |
| 18. | Artesian | 71.4% | 11.6%(+59.8)#18 | 11.1%(+60.4)#609 |
| 19. | Warner | 66.7% | 11.6%(+55.1)#19 | 11.1%(+55.6)#672 |
| 20. | Wakonda | 66.7% | 11.6%(+55.1)#20 | 11.1%(+55.6)#674 |
| 21. | Wakpala | 66.7% | 11.6%(+55.1)#21 | 11.1%(+55.6)#683 |
| 22. | Hazel | 66.7% | 11.6%(+55.1)#22 | 11.1%(+55.6)#693 |
| 23. | Dante | 66.7% | 11.6%(+55.1)#23 | 11.1%(+55.6)#699 |
| 24. | Agar | 66.7% | 11.6%(+55.1)#24 | 11.1%(+55.6)#701 |
| 25. | Elkton | 65.0% | 11.6%(+53.4)#25 | 11.1%(+53.9)#723 |
| 26. | Hudson | 63.8% | 11.6%(+52.2)#26 | 11.1%(+52.8)#737 |
| 27. | Lower Brule | 62.3% | 11.6%(+50.7)#27 | 11.1%(+51.2)#784 |
| 28. | Nunda | 60.0% | 11.6%(+48.4)#28 | 11.1%(+48.9)#865 |
| 29. | Philip | 57.1% | 11.6%(+45.5)#29 | 11.1%(+46.1)#941 |
| 30. | Yale | 57.1% | 11.6%(+45.5)#30 | 11.1%(+46.1)#949 |
| 31. | Rosebud | 56.7% | 11.6%(+45.1)#31 | 11.1%(+45.6)#962 |
| 32. | Oelrichs | 55.6% | 11.6%(+43.9)#32 | 11.1%(+44.5)#1,003 |
| 33. | Kaylor | 53.3% | 11.6%(+41.7)#33 | 11.1%(+42.3)#1,088 |
| 34. | Stockholm | 50.0% | 11.6%(+38.4)#34 | 11.1%(+38.9)#1,269 |
| 35. | Garden City | 50.0% | 11.6%(+38.4)#35 | 11.1%(+38.9)#1,285 |
| 36. | Andover | 50.0% | 11.6%(+38.4)#36 | 11.1%(+38.9)#1,309 |
| 37. | Rosholt | 45.8% | 11.6%(+34.2)#37 | 11.1%(+34.8)#1,505 |
| 38. | Piedmont | 45.7% | 11.6%(+34.1)#38 | 11.1%(+34.6)#1,511 |
| 39. | New Underwood | 43.8% | 11.6%(+32.1)#39 | 11.1%(+32.7)#1,623 |
| 40. | Summit | 43.8% | 11.6%(+32.1)#40 | 11.1%(+32.7)#1,625 |
| 41. | Mission | 42.9% | 11.6%(+31.2)#41 | 11.1%(+31.8)#1,680 |
| 42. | Nisland | 41.7% | 11.6%(+30.1)#42 | 11.1%(+30.6)#1,792 |
| 43. | White River | 40.9% | 11.6%(+29.3)#43 | 11.1%(+29.8)#1,843 |
| 44. | Lake Andes | 40.0% | 11.6%(+28.4)#44 | 11.1%(+28.9)#1,900 |
| 45. | Dupree | 40.0% | 11.6%(+28.4)#45 | 11.1%(+28.9)#1,909 |
| 46. | Eureka | 39.3% | 11.6%(+27.7)#46 | 11.1%(+28.2)#1,999 |
| 47. | Florence | 39.3% | 11.6%(+27.7)#47 | 11.1%(+28.2)#2,003 |
| 48. | Wasta | 38.5% | 11.6%(+26.9)#48 | 11.1%(+27.4)#2,088 |
| 49. | Wessington Springs | 37.9% | 11.6%(+26.3)#49 | 11.1%(+26.8)#2,135 |
| 50. | Lead | 37.7% | 11.6%(+26.1)#50 | 11.1%(+26.7)#2,145 |
| 51. | Lake Preston | 37.7% | 11.6%(+26.1)#51 | 11.1%(+26.6)#2,150 |
| 52. | Lake Poinsett | 35.7% | 11.6%(+24.1)#52 | 11.1%(+24.6)#2,334 |
| 53. | Astoria | 35.7% | 11.6%(+24.1)#53 | 11.1%(+24.6)#2,343 |
| 54. | Green Valley | 35.4% | 11.6%(+23.8)#54 | 11.1%(+24.4)#2,366 |
| 55. | Chancellor | 35.0% | 11.6%(+23.4)#55 | 11.1%(+23.9)#2,416 |
| 56. | North Eagle Butte | 34.4% | 11.6%(+22.8)#56 | 11.1%(+23.3)#2,475 |
| 57. | Bruce | 33.3% | 11.6%(+21.7)#57 | 11.1%(+22.3)#2,638 |
| 58. | Goodwin | 33.3% | 11.6%(+21.7)#58 | 11.1%(+22.3)#2,708 |
| 59. | Marion | 32.9% | 11.6%(+21.3)#59 | 11.1%(+21.8)#2,758 |
| 60. | New Effington | 32.0% | 11.6%(+20.4)#60 | 11.1%(+20.9)#2,849 |
| 61. | Hill City | 31.2% | 11.6%(+19.6)#61 | 11.1%(+20.2)#2,929 |
| 62. | Bridgewater | 30.8% | 11.6%(+19.2)#62 | 11.1%(+19.7)#2,992 |
| 63. | Milbank | 30.5% | 11.6%(+18.9)#63 | 11.1%(+19.5)#3,036 |
| 64. | Isabel | 30.0% | 11.6%(+18.4)#64 | 11.1%(+18.9)#3,138 |
| 65. | Mound City | 30.0% | 11.6%(+18.4)#65 | 11.1%(+18.9)#3,145 |
| 66. | Mcintosh | 30.0% | 11.6%(+18.4)#66 | 11.1%(+18.9)#3,146 |
| 67. | Alexandria | 29.2% | 11.6%(+17.6)#67 | 11.1%(+18.1)#3,269 |
| 68. | Artas | 28.0% | 11.6%(+16.4)#68 | 11.1%(+16.9)#3,468 |
| 69. | Kadoka | 27.4% | 11.6%(+15.8)#69 | 11.1%(+16.4)#3,561 |
| 70. | Irene | 26.7% | 11.6%(+15.1)#70 | 11.1%(+15.6)#3,719 |
| 71. | Hayti | 26.7% | 11.6%(+15.1)#71 | 11.1%(+15.6)#3,724 |
| 72. | Oldham | 26.7% | 11.6%(+15.1)#72 | 11.1%(+15.6)#3,734 |
| 73. | Box Elder | 26.6% | 11.6%(+15.0)#73 | 11.1%(+15.6)#3,737 |
| 74. | Faith | 26.4% | 11.6%(+14.8)#74 | 11.1%(+15.3)#3,777 |
| 75. | Frankfort | 26.2% | 11.6%(+14.6)#75 | 11.1%(+15.1)#3,832 |
| 76. | Willow Lake | 25.9% | 11.6%(+14.3)#76 | 11.1%(+14.9)#3,895 |
| 77. | Tyndall | 25.2% | 11.6%(+13.6)#77 | 11.1%(+14.1)#4,038 |
| 78. | Bullhead | 25.0% | 11.6%(+13.4)#78 | 11.1%(+13.9)#4,132 |
| 79. | Chester | 25.0% | 11.6%(+13.4)#79 | 11.1%(+13.9)#4,136 |
| 80. | Peever | 25.0% | 11.6%(+13.4)#80 | 11.1%(+13.9)#4,161 |
| 81. | Fulton | 25.0% | 11.6%(+13.4)#81 | 11.1%(+13.9)#4,181 |
| 82. | White Lake | 24.1% | 11.6%(+12.5)#82 | 11.1%(+13.1)#4,342 |
| 83. | Hecla | 23.8% | 11.6%(+12.2)#83 | 11.1%(+12.7)#4,428 |
| 84. | Sturgis | 23.6% | 11.6%(+12.0)#84 | 11.1%(+12.5)#4,492 |
| 85. | Hoven | 23.5% | 11.6%(+11.9)#85 | 11.1%(+12.5)#4,511 |
| 86. | Pollock | 23.1% | 11.6%(+11.5)#86 | 11.1%(+12.0)#4,632 |
| 87. | North Sioux City | 23.0% | 11.6%(+11.4)#87 | 11.1%(+11.9)#4,652 |
| 88. | Viborg | 22.9% | 11.6%(+11.3)#88 | 11.1%(+11.8)#4,672 |
| 89. | Webster | 22.8% | 11.6%(+11.2)#89 | 11.1%(+11.8)#4,704 |
| 90. | Lennox | 22.8% | 11.6%(+11.2)#90 | 11.1%(+11.8)#4,706 |
| 91. | Waubay | 22.7% | 11.6%(+11.1)#91 | 11.1%(+11.7)#4,733 |
| 92. | Trent | 21.9% | 11.6%(+10.3)#92 | 11.1%(+10.8)#5,003 |
| 93. | Gregory | 21.8% | 11.6%(+10.2)#93 | 11.1%(+10.7)#5,031 |
| 94. | Fort Thompson | 21.4% | 11.6%(+9.82)#94 | 11.1%(+10.4)#5,127 |
| 95. | Armour | 21.3% | 11.6%(+9.73)#95 | 11.1%(+10.3)#5,174 |
| 96. | Parkston | 21.2% | 11.6%(+9.55)#96 | 11.1%(+10.1)#5,221 |
| 97. | Edgemont | 20.9% | 11.6%(+9.29)#97 | 11.1%(+9.83)#5,297 |
| 98. | Badger | 20.0% | 11.6%(+8.39)#98 | 11.1%(+8.93)#5,674 |
| 99. | Revillo | 20.0% | 11.6%(+8.39)#99 | 11.1%(+8.93)#5,688 |
| 100. | Fairview | 20.0% | 11.6%(+8.39)#100 | 11.1%(+8.93)#5,696 |
Common Questions
What are the Top 10 Cities with the Highest Poverty Level Among Seniors Over the Age of 75 in South Dakota?
Top 10 Cities with the Highest Poverty Level Among Seniors Over the Age of 75 in South Dakota are:
#1
100.0%
#2
100.0%
#3
100.0%
#4
100.0%
#5
100.0%
#6
100.0%
#7
100.0%
#8
100.0%
#9
100.0%
#10
100.0%
What city has the Highest Poverty Level Among Seniors Over the Age of 75 in South Dakota?
Oglala has the Highest Poverty Level Among Seniors Over the Age of 75 in South Dakota with 100.0%.
What is the Poverty Level Among Seniors Over the Age of 75 in the State of South Dakota?
Poverty Level Among Seniors Over the Age of 75 in South Dakota is 11.6%.
What is the Poverty Level Among Seniors Over the Age of 75 in the United States?
Poverty Level Among Seniors Over the Age of 75 in the United States is 11.1%.