Cities with the Highest Poverty Level in South Dakota
RELATED REPORTS & OPTIONS
Highest Poverty
South Dakota
Compare Cities
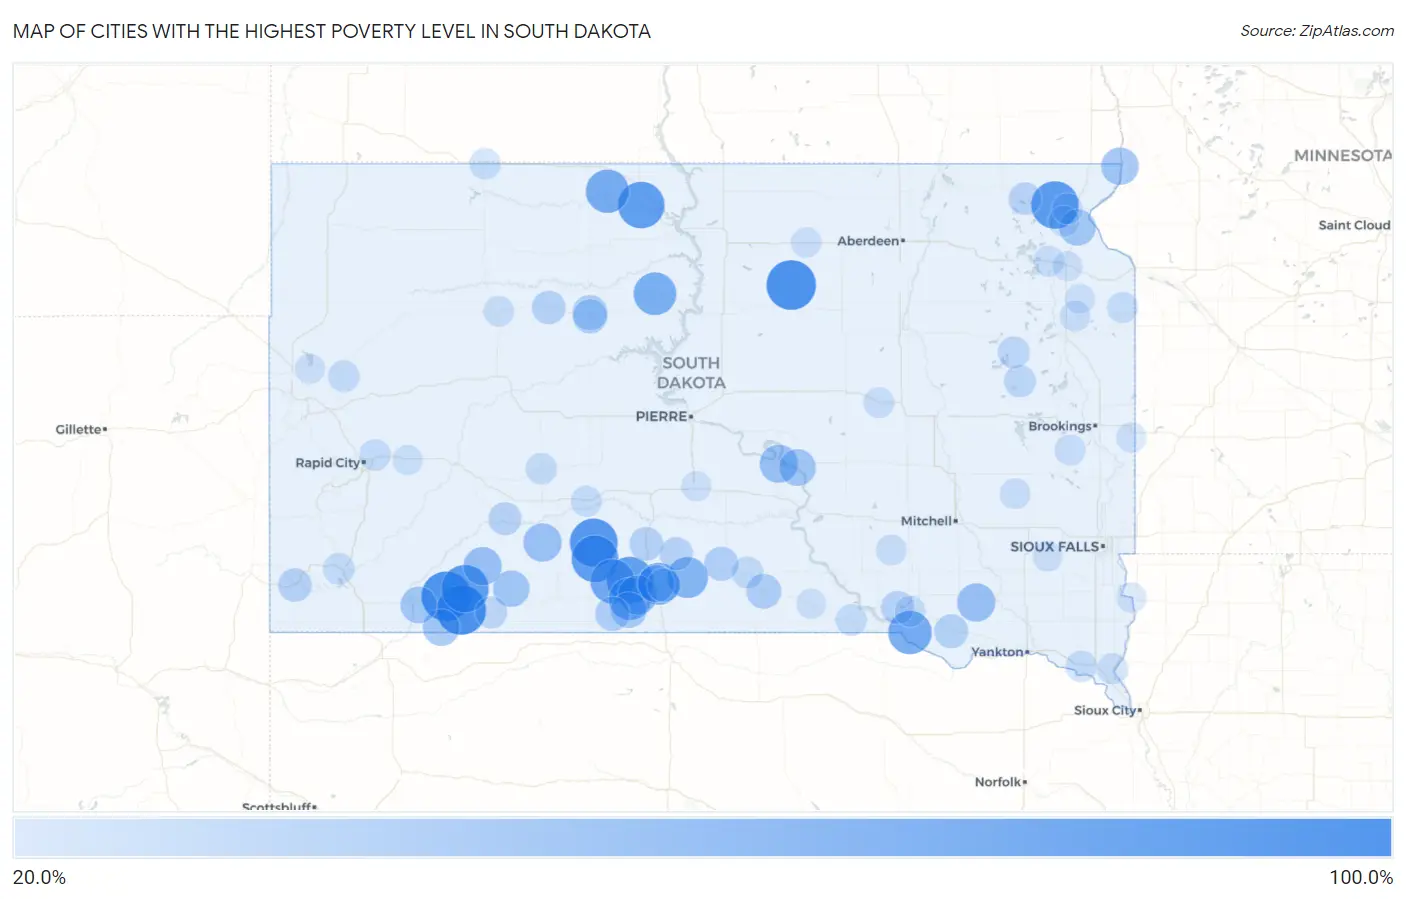
Map of Cities with the Highest Poverty Level in South Dakota
0.0%
100.0%
Cities with the Highest Poverty Level in South Dakota
| City | Poverty | vs State | vs National | |
| 1. | Manderson White Horse Creek | 100.0% | 12.3%(+87.7)#1 | 12.5%(+87.5)#6 |
| 2. | Wounded Knee | 100.0% | 12.3%(+87.7)#2 | 12.5%(+87.5)#10 |
| 3. | Swift Bird | 100.0% | 12.3%(+87.7)#3 | 12.5%(+87.5)#15 |
| 4. | Evergreen Colony | 100.0% | 12.3%(+87.7)#4 | 12.5%(+87.5)#37 |
| 5. | Brentwood Colony | 100.0% | 12.3%(+87.7)#5 | 12.5%(+87.5)#38 |
| 6. | Sunset Colony | 100.0% | 12.3%(+87.7)#6 | 12.5%(+87.5)#44 |
| 7. | Mayfield Colony | 100.0% | 12.3%(+87.7)#7 | 12.5%(+87.5)#46 |
| 8. | Shamrock Colony | 100.0% | 12.3%(+87.7)#8 | 12.5%(+87.5)#49 |
| 9. | New Elm Spring Colony | 100.0% | 12.3%(+87.7)#9 | 12.5%(+87.5)#55 |
| 10. | Clearfield Colony | 100.0% | 12.3%(+87.7)#10 | 12.5%(+87.5)#56 |
| 11. | Onaka | 100.0% | 12.3%(+87.7)#11 | 12.5%(+87.5)#79 |
| 12. | Corn Creek | 92.9% | 12.3%(+80.6)#12 | 12.5%(+80.4)#134 |
| 13. | Porcupine | 91.5% | 12.3%(+79.2)#13 | 12.5%(+79.0)#137 |
| 14. | Long Hollow | 90.9% | 12.3%(+78.7)#14 | 12.5%(+78.4)#139 |
| 15. | Bridger | 90.7% | 12.3%(+78.4)#15 | 12.5%(+78.1)#143 |
| 16. | Norris | 88.9% | 12.3%(+76.6)#16 | 12.5%(+76.4)#154 |
| 17. | Little Eagle | 87.5% | 12.3%(+75.2)#17 | 12.5%(+74.9)#158 |
| 18. | Soldier Creek | 86.7% | 12.3%(+74.5)#18 | 12.5%(+74.2)#163 |
| 19. | Horse Creek | 83.6% | 12.3%(+71.3)#19 | 12.5%(+71.0)#175 |
| 20. | Wakpala | 80.6% | 12.3%(+68.3)#20 | 12.5%(+68.1)#193 |
| 21. | Parmelee | 78.1% | 12.3%(+65.9)#21 | 12.5%(+65.6)#215 |
| 22. | Marty | 75.1% | 12.3%(+62.9)#22 | 12.5%(+62.6)#241 |
| 23. | Clark Colony | 74.2% | 12.3%(+61.9)#23 | 12.5%(+61.7)#249 |
| 24. | Bullhead | 73.7% | 12.3%(+61.4)#24 | 12.5%(+61.1)#256 |
| 25. | La Plant | 71.6% | 12.3%(+59.3)#25 | 12.5%(+59.0)#292 |
| 26. | Enemy Swim | 70.7% | 12.3%(+58.5)#26 | 12.5%(+58.2)#308 |
| 27. | Two Strike | 70.3% | 12.3%(+58.1)#27 | 12.5%(+57.8)#314 |
| 28. | Antelope | 68.5% | 12.3%(+56.2)#28 | 12.5%(+55.9)#338 |
| 29. | Sicangu | 65.1% | 12.3%(+52.8)#29 | 12.5%(+52.6)#396 |
| 30. | Okreek | 64.5% | 12.3%(+52.3)#30 | 12.5%(+52.0)#404 |
| 31. | Golden View Colony | 64.5% | 12.3%(+52.2)#31 | 12.5%(+52.0)#406 |
| 32. | Spring Creek Colony | 57.3% | 12.3%(+45.0)#32 | 12.5%(+44.8)#579 |
| 33. | Rosebud | 57.2% | 12.3%(+44.9)#33 | 12.5%(+44.6)#584 |
| 34. | Cherry Creek | 54.1% | 12.3%(+41.8)#34 | 12.5%(+41.5)#700 |
| 35. | Kyle | 53.5% | 12.3%(+41.2)#35 | 12.5%(+41.0)#729 |
| 36. | Wanblee | 53.4% | 12.3%(+41.1)#36 | 12.5%(+40.9)#735 |
| 37. | Kaylor | 53.3% | 12.3%(+41.1)#37 | 12.5%(+40.8)#737 |
| 38. | Lower Brule | 52.7% | 12.3%(+40.5)#38 | 12.5%(+40.2)#762 |
| 39. | Oral | 52.3% | 12.3%(+40.0)#39 | 12.5%(+39.7)#781 |
| 40. | Peever Flats | 51.4% | 12.3%(+39.1)#40 | 12.5%(+38.9)#828 |
| 41. | Spink Colony | 51.1% | 12.3%(+38.8)#41 | 12.5%(+38.5)#849 |
| 42. | West Brule | 51.0% | 12.3%(+38.8)#42 | 12.5%(+38.5)#852 |
| 43. | White Rock | 50.0% | 12.3%(+37.7)#43 | 12.5%(+37.5)#915 |
| 44. | Spring Lake Colony | 48.8% | 12.3%(+36.5)#44 | 12.5%(+36.2)#984 |
| 45. | Mission | 48.5% | 12.3%(+36.3)#45 | 12.5%(+36.0)#1,001 |
| 46. | Pine Ridge | 47.7% | 12.3%(+35.4)#46 | 12.5%(+35.2)#1,043 |
| 47. | Fort Thompson | 47.3% | 12.3%(+35.1)#47 | 12.5%(+34.8)#1,069 |
| 48. | Allen | 46.7% | 12.3%(+34.4)#48 | 12.5%(+34.1)#1,129 |
| 49. | Oglala | 46.4% | 12.3%(+34.1)#49 | 12.5%(+33.9)#1,151 |
| 50. | Peever | 45.9% | 12.3%(+33.6)#50 | 12.5%(+33.4)#1,190 |
| 51. | St Francis | 43.6% | 12.3%(+31.4)#51 | 12.5%(+31.1)#1,356 |
| 52. | North Eagle Butte | 40.3% | 12.3%(+28.0)#52 | 12.5%(+27.7)#1,650 |
| 53. | Colome | 39.6% | 12.3%(+27.3)#53 | 12.5%(+27.1)#1,732 |
| 54. | Spring Creek | 38.4% | 12.3%(+26.1)#54 | 12.5%(+25.8)#1,858 |
| 55. | Eagle Butte | 37.6% | 12.3%(+25.4)#55 | 12.5%(+25.1)#1,956 |
| 56. | New Witten | 37.0% | 12.3%(+24.7)#56 | 12.5%(+24.5)#2,067 |
| 57. | Avon | 35.8% | 12.3%(+23.5)#57 | 12.5%(+23.3)#2,238 |
| 58. | White River | 34.8% | 12.3%(+22.5)#58 | 12.5%(+22.2)#2,392 |
| 59. | Dupree | 34.7% | 12.3%(+22.4)#59 | 12.5%(+22.1)#2,406 |
| 60. | Edgemont | 34.2% | 12.3%(+22.0)#60 | 12.5%(+21.7)#2,488 |
| 61. | White Horse | 34.1% | 12.3%(+21.8)#61 | 12.5%(+21.5)#2,518 |
| 62. | Wood | 33.3% | 12.3%(+21.1)#62 | 12.5%(+20.8)#2,665 |
| 63. | Lake Andes | 33.2% | 12.3%(+20.9)#63 | 12.5%(+20.6)#2,701 |
| 64. | Interior | 32.7% | 12.3%(+20.4)#64 | 12.5%(+20.2)#2,791 |
| 65. | Lake City | 32.1% | 12.3%(+19.8)#65 | 12.5%(+19.5)#2,936 |
| 66. | Bryant | 29.5% | 12.3%(+17.2)#66 | 12.5%(+17.0)#3,529 |
| 67. | Batesland | 29.2% | 12.3%(+17.0)#67 | 12.5%(+16.7)#3,609 |
| 68. | Naples | 28.9% | 12.3%(+16.7)#68 | 12.5%(+16.4)#3,685 |
| 69. | Winner | 27.9% | 12.3%(+15.6)#69 | 12.5%(+15.4)#4,009 |
| 70. | Hot Springs | 27.1% | 12.3%(+14.8)#70 | 12.5%(+14.5)#4,298 |
| 71. | Vale | 26.9% | 12.3%(+14.6)#71 | 12.5%(+14.3)#4,361 |
| 72. | Bonesteel | 26.7% | 12.3%(+14.5)#72 | 12.5%(+14.2)#4,396 |
| 73. | Ashland Heights | 26.5% | 12.3%(+14.2)#73 | 12.5%(+13.9)#4,498 |
| 74. | Philip | 26.3% | 12.3%(+14.1)#74 | 12.5%(+13.8)#4,533 |
| 75. | Vermillion | 26.2% | 12.3%(+14.0)#75 | 12.5%(+13.7)#4,573 |
| 76. | Lemmon | 25.9% | 12.3%(+13.7)#76 | 12.5%(+13.4)#4,697 |
| 77. | Ravinia | 25.4% | 12.3%(+13.2)#77 | 12.5%(+12.9)#4,878 |
| 78. | Belvidere | 25.0% | 12.3%(+12.7)#78 | 12.5%(+12.5)#5,061 |
| 79. | Albee | 25.0% | 12.3%(+12.7)#79 | 12.5%(+12.5)#5,074 |
| 80. | Agency Village | 24.8% | 12.3%(+12.6)#80 | 12.5%(+12.3)#5,138 |
| 81. | Sisseton | 24.6% | 12.3%(+12.3)#81 | 12.5%(+12.1)#5,228 |
| 82. | Nunda | 24.4% | 12.3%(+12.2)#82 | 12.5%(+11.9)#5,291 |
| 83. | Richland | 24.4% | 12.3%(+12.1)#83 | 12.5%(+11.9)#5,315 |
| 84. | Ortley | 24.1% | 12.3%(+11.8)#84 | 12.5%(+11.5)#5,437 |
| 85. | Canova | 23.8% | 12.3%(+11.6)#85 | 12.5%(+11.3)#5,546 |
| 86. | Waverly | 23.8% | 12.3%(+11.5)#86 | 12.5%(+11.3)#5,570 |
| 87. | Faith | 23.7% | 12.3%(+11.4)#87 | 12.5%(+11.1)#5,614 |
| 88. | Wessington | 23.6% | 12.3%(+11.4)#88 | 12.5%(+11.1)#5,638 |
| 89. | Aurora Center | 23.5% | 12.3%(+11.3)#89 | 12.5%(+11.0)#5,693 |
| 90. | Glendale Colony | 22.7% | 12.3%(+10.4)#90 | 12.5%(+10.1)#6,119 |
| 91. | Roscoe | 22.5% | 12.3%(+10.2)#91 | 12.5%(+9.96)#6,195 |
| 92. | New Underwood | 22.2% | 12.3%(+9.98)#92 | 12.5%(+9.71)#6,329 |
| 93. | Fruitdale | 22.0% | 12.3%(+9.79)#93 | 12.5%(+9.51)#6,431 |
| 94. | Monroe | 22.0% | 12.3%(+9.75)#94 | 12.5%(+9.47)#6,452 |
| 95. | Vivian | 22.0% | 12.3%(+9.74)#95 | 12.5%(+9.47)#6,460 |
| 96. | Burke | 21.7% | 12.3%(+9.47)#96 | 12.5%(+9.20)#6,629 |
| 97. | Summit | 21.7% | 12.3%(+9.44)#97 | 12.5%(+9.17)#6,641 |
| 98. | South Shore | 21.7% | 12.3%(+9.42)#98 | 12.5%(+9.15)#6,653 |
| 99. | Fairview | 21.6% | 12.3%(+9.33)#99 | 12.5%(+9.06)#6,709 |
| 100. | Elkton | 21.6% | 12.3%(+9.30)#100 | 12.5%(+9.03)#6,725 |
Common Questions
What are the Top 10 Cities with the Highest Poverty Level in South Dakota?
Top 10 Cities with the Highest Poverty Level in South Dakota are:
#1
100.0%
#2
100.0%
#3
100.0%
#4
92.9%
#5
91.5%
#6
90.9%
#7
88.9%
#8
87.5%
#9
86.7%
#10
78.1%
What city has the Highest Poverty Level in South Dakota?
Manderson White Horse Creek has the Highest Poverty Level in South Dakota with 100.0%.
What is the Poverty Level in the State of South Dakota?
Poverty Level in South Dakota is 12.3%.
What is the Poverty Level in the United States?
Poverty Level in the United States is 12.5%.