North Sioux City, SD
North Sioux City Map
North Sioux City Overview
2,984
TOTAL POPULATION
1,348
MALE POPULATION
1,636
FEMALE POPULATION
82.40
MALES / 100 FEMALES
121.36
FEMALES / 100 MALES
33.5
MEDIAN AGE
2.6
AVG FAMILY SIZE
2.2
AVG HOUSEHOLD SIZE
$39,217
PER CAPITA INCOME
$92,862
AVG FAMILY INCOME
$62,284
AVG HOUSEHOLD INCOME
35.0%
WAGE / INCOME GAP [ % ]
65.0¢/ $1
WAGE / INCOME GAP [ $ ]
$6,806
FAMILY INCOME DEFICIT
0.45
INEQUALITY / GINI INDEX
1,648
LABOR FORCE [ PEOPLE ]
69.5%
PERCENT IN LABOR FORCE
5.2%
UNEMPLOYMENT RATE
North Sioux City Zip Codes
North Sioux City Area Codes
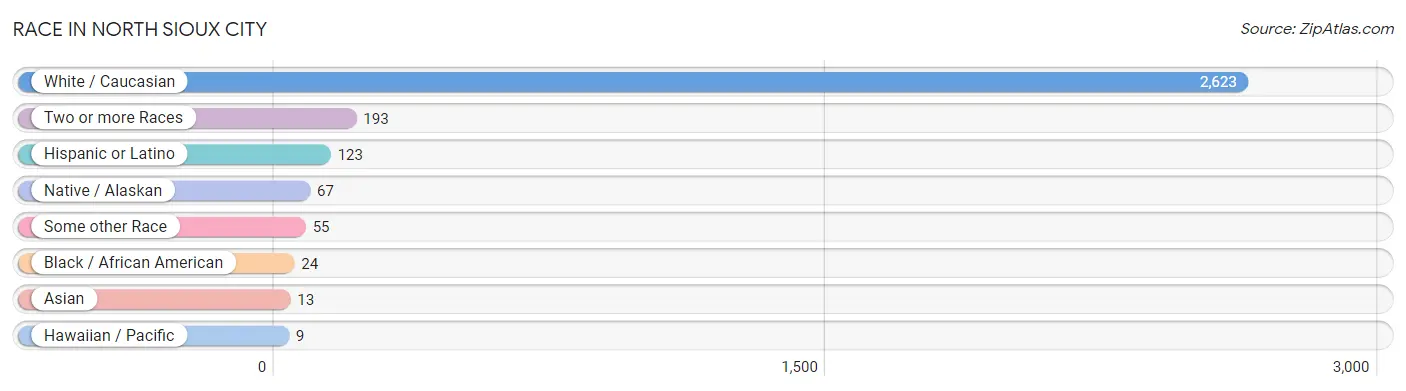
Race in North Sioux City
The most populous races in North Sioux City are White / Caucasian (2,623 | 87.9%), Two or more Races (193 | 6.5%), and Hispanic or Latino (123 | 4.1%).
| Race | # Population | % Population |
| Asian | 13 | 0.4% |
| Black / African American | 24 | 0.8% |
| Hawaiian / Pacific | 9 | 0.3% |
| Hispanic or Latino | 123 | 4.1% |
| Native / Alaskan | 67 | 2.2% |
| White / Caucasian | 2,623 | 87.9% |
| Two or more Races | 193 | 6.5% |
| Some other Race | 55 | 1.8% |
| Total | 2,984 | 100.0% |
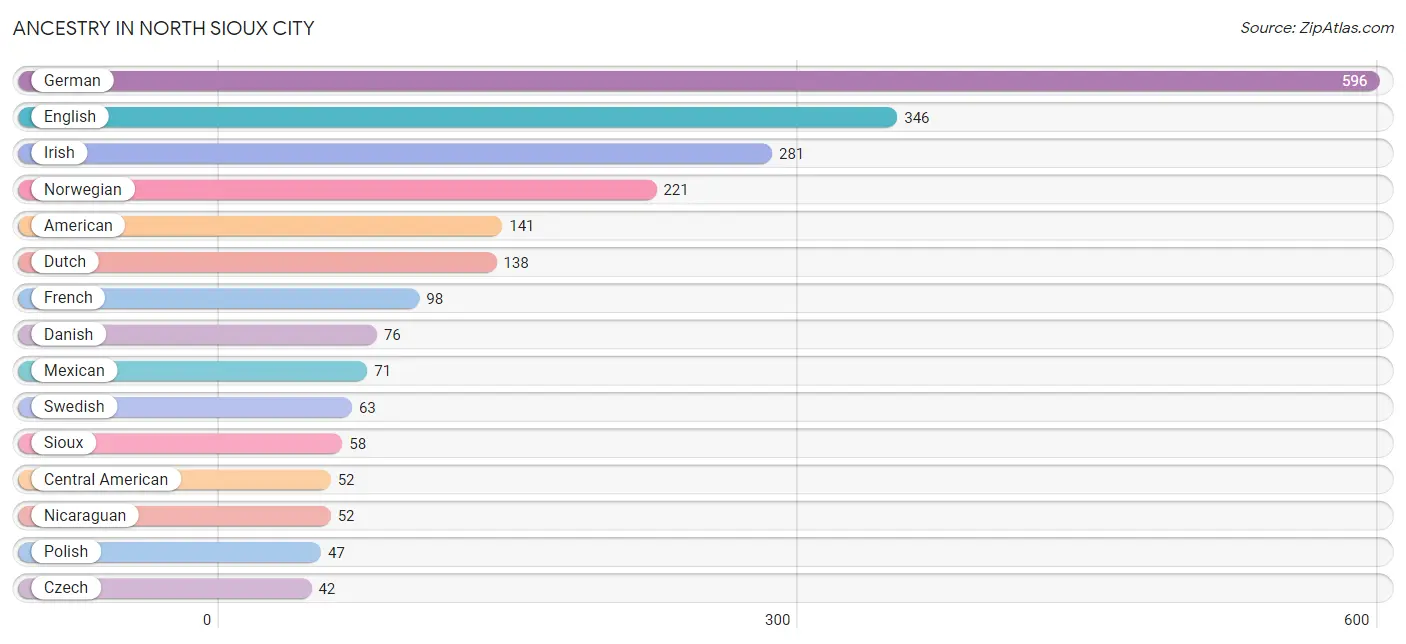
Ancestry in North Sioux City
The most populous ancestries reported in North Sioux City are German (596 | 20.0%), English (346 | 11.6%), Irish (281 | 9.4%), Norwegian (221 | 7.4%), and American (141 | 4.7%), together accounting for 53.1% of all North Sioux City residents.
| Ancestry | # Population | % Population |
| American | 141 | 4.7% |
| Arab | 15 | 0.5% |
| Austrian | 5 | 0.2% |
| Burmese | 6 | 0.2% |
| Central American | 52 | 1.7% |
| Czech | 42 | 1.4% |
| Danish | 76 | 2.5% |
| Dutch | 138 | 4.6% |
| English | 346 | 11.6% |
| European | 21 | 0.7% |
| Fijian | 9 | 0.3% |
| French | 98 | 3.3% |
| French Canadian | 19 | 0.6% |
| German | 596 | 20.0% |
| Greek | 12 | 0.4% |
| Irish | 281 | 9.4% |
| Italian | 12 | 0.4% |
| Korean | 41 | 1.4% |
| Luxembourger | 10 | 0.3% |
| Mexican | 71 | 2.4% |
| Nicaraguan | 52 | 1.7% |
| Norwegian | 221 | 7.4% |
| Polish | 47 | 1.6% |
| Scotch-Irish | 24 | 0.8% |
| Scottish | 21 | 0.7% |
| Sioux | 58 | 1.9% |
| Swedish | 63 | 2.1% |
| Welsh | 34 | 1.1% | View All 28 Rows |
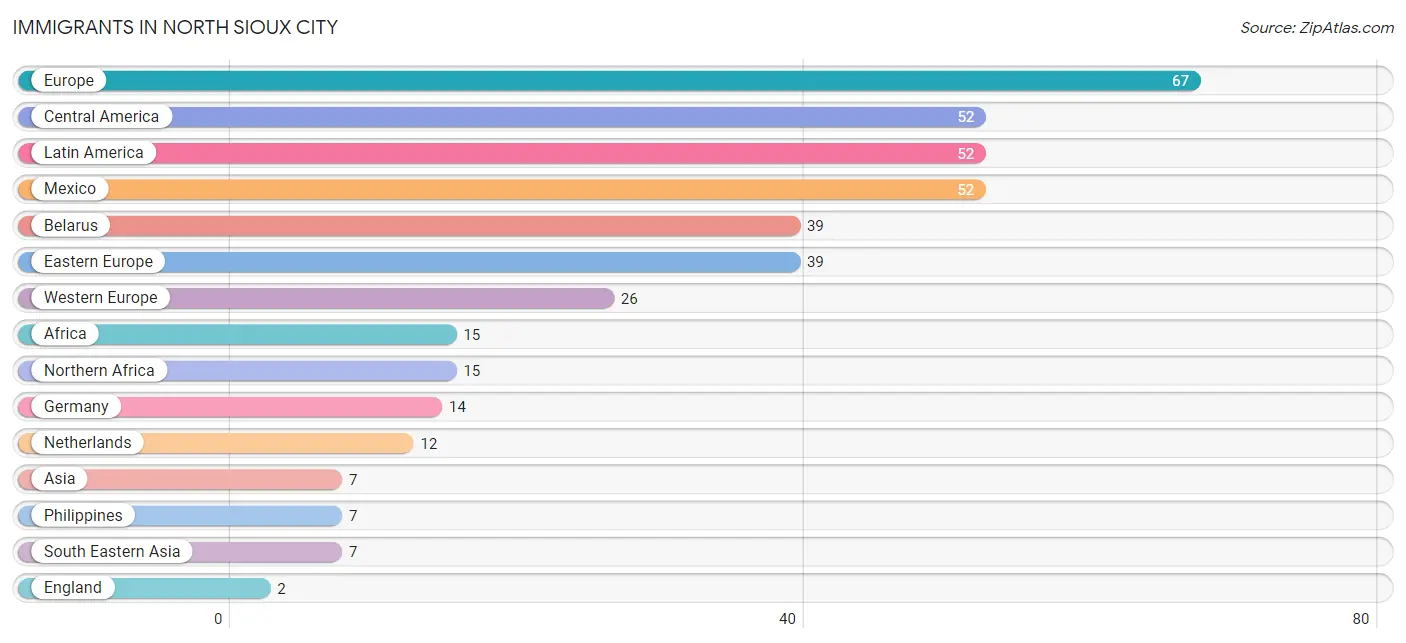
Immigrants in North Sioux City
The most numerous immigrant groups reported in North Sioux City came from Europe (67 | 2.2%), Central America (52 | 1.7%), Latin America (52 | 1.7%), Mexico (52 | 1.7%), and Belarus (39 | 1.3%), together accounting for 8.8% of all North Sioux City residents.
| Immigration Origin | # Population | % Population |
| Africa | 15 | 0.5% |
| Asia | 7 | 0.2% |
| Belarus | 39 | 1.3% |
| Central America | 52 | 1.7% |
| Eastern Europe | 39 | 1.3% |
| England | 2 | 0.1% |
| Europe | 67 | 2.2% |
| Germany | 14 | 0.5% |
| Latin America | 52 | 1.7% |
| Mexico | 52 | 1.7% |
| Netherlands | 12 | 0.4% |
| Northern Africa | 15 | 0.5% |
| Northern Europe | 2 | 0.1% |
| Philippines | 7 | 0.2% |
| South Eastern Asia | 7 | 0.2% |
| Western Europe | 26 | 0.9% | View All 16 Rows |
Sex and Age in North Sioux City
Sex and Age in North Sioux City
The most populous age groups in North Sioux City are 65 to 69 Years (130 | 9.6%) for men and 30 to 34 Years (189 | 11.6%) for women.
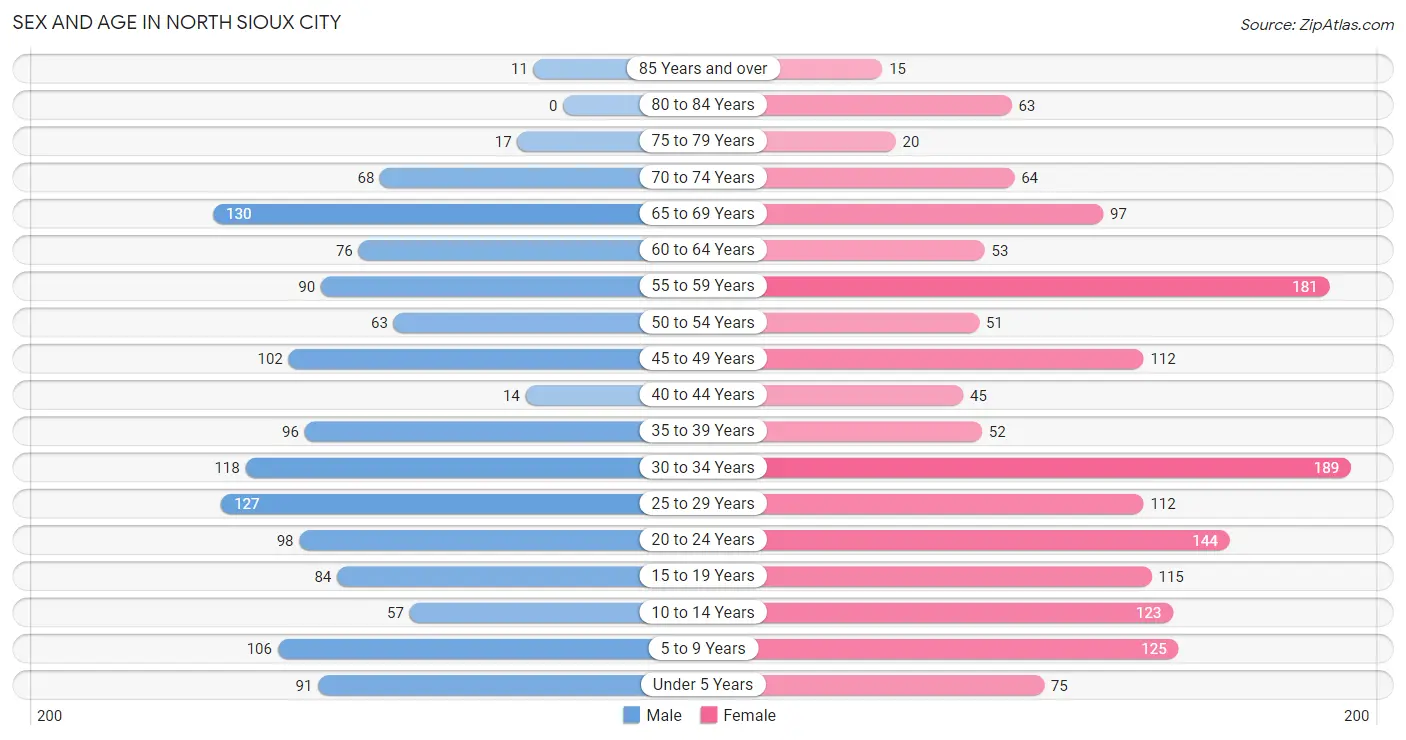
| Age Bracket | Male | Female |
| Under 5 Years | 91 (6.8%) | 75 (4.6%) |
| 5 to 9 Years | 106 (7.9%) | 125 (7.6%) |
| 10 to 14 Years | 57 (4.2%) | 123 (7.5%) |
| 15 to 19 Years | 84 (6.2%) | 115 (7.0%) |
| 20 to 24 Years | 98 (7.3%) | 144 (8.8%) |
| 25 to 29 Years | 127 (9.4%) | 112 (6.9%) |
| 30 to 34 Years | 118 (8.7%) | 189 (11.6%) |
| 35 to 39 Years | 96 (7.1%) | 52 (3.2%) |
| 40 to 44 Years | 14 (1.0%) | 45 (2.8%) |
| 45 to 49 Years | 102 (7.6%) | 112 (6.9%) |
| 50 to 54 Years | 63 (4.7%) | 51 (3.1%) |
| 55 to 59 Years | 90 (6.7%) | 181 (11.1%) |
| 60 to 64 Years | 76 (5.6%) | 53 (3.2%) |
| 65 to 69 Years | 130 (9.6%) | 97 (5.9%) |
| 70 to 74 Years | 68 (5.0%) | 64 (3.9%) |
| 75 to 79 Years | 17 (1.3%) | 20 (1.2%) |
| 80 to 84 Years | 0 (0.0%) | 63 (3.8%) |
| 85 Years and over | 11 (0.8%) | 15 (0.9%) |
| Total | 1,348 (100.0%) | 1,636 (100.0%) |
Families and Households in North Sioux City
Median Family Size in North Sioux City
The median family size in North Sioux City is 2.59 persons per family, with single female/mother families (251 | 30.9%) accounting for the largest median family size of 2.75 persons per family. On the other hand, single male/father families (51 | 6.3%) represent the smallest median family size with 2.25 persons per family.
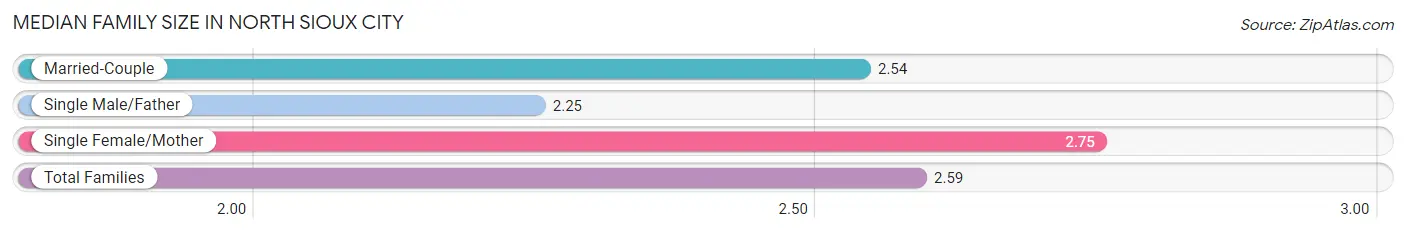
| Family Type | # Families | Family Size |
| Married-Couple | 511 (62.8%) | 2.54 |
| Single Male/Father | 51 (6.3%) | 2.25 |
| Single Female/Mother | 251 (30.9%) | 2.75 |
| Total Families | 813 (100.0%) | 2.59 |
Median Household Size in North Sioux City
The median household size in North Sioux City is 2.19 persons per household, with single female/mother households (251 | 18.4%) accounting for the largest median household size of 3.08 persons per household. non-family households (548 | 40.3%) represent the smallest median household size with 1.42 persons per household.
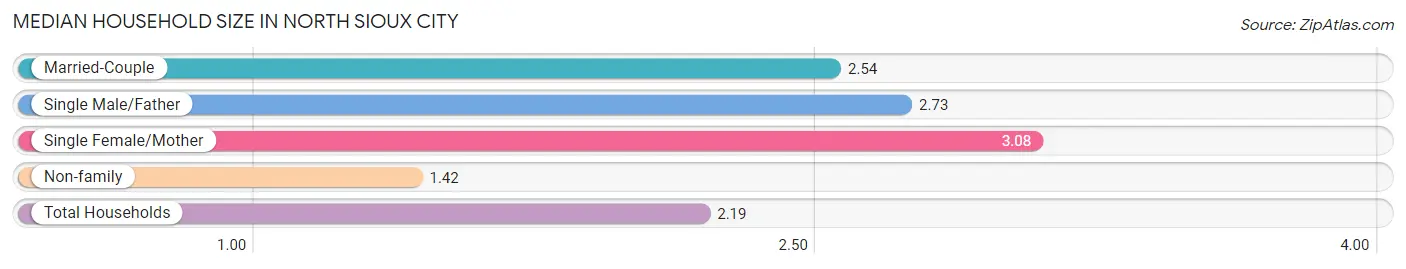
| Household Type | # Households | Household Size |
| Married-Couple | 511 (37.6%) | 2.54 |
| Single Male/Father | 51 (3.7%) | 2.73 |
| Single Female/Mother | 251 (18.4%) | 3.08 |
| Non-family | 548 (40.3%) | 1.42 |
| Total Households | 1,361 (100.0%) | 2.19 |
Household Size by Marriage Status in North Sioux City
Out of a total of 1,361 households in North Sioux City, 813 (59.7%) are family households, while 548 (40.3%) are nonfamily households. The most numerous type of family households are 2-person households, comprising 485, and the most common type of nonfamily households are 1-person households, comprising 357.
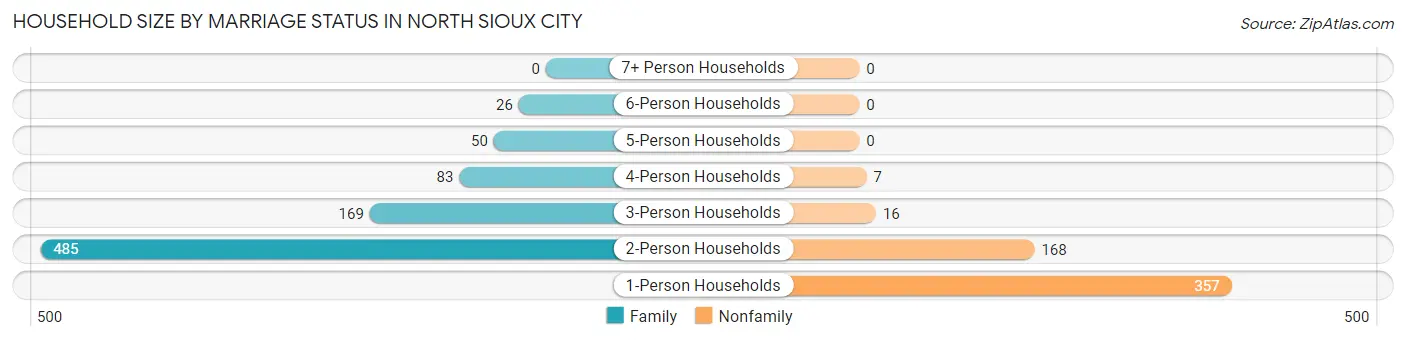
| Household Size | Family Households | Nonfamily Households |
| 1-Person Households | - | 357 (26.2%) |
| 2-Person Households | 485 (35.6%) | 168 (12.3%) |
| 3-Person Households | 169 (12.4%) | 16 (1.2%) |
| 4-Person Households | 83 (6.1%) | 7 (0.5%) |
| 5-Person Households | 50 (3.7%) | 0 (0.0%) |
| 6-Person Households | 26 (1.9%) | 0 (0.0%) |
| 7+ Person Households | 0 (0.0%) | 0 (0.0%) |
| Total | 813 (59.7%) | 548 (40.3%) |
Female Fertility in North Sioux City
Fertility by Age in North Sioux City
Average fertility rate in North Sioux City is 48.0 births per 1,000 women. Women in the age bracket of 20 to 34 years have the highest fertility rate with 83.0 births per 1,000 women. Women in the age bracket of 20 to 34 years acount for 100.0% of all women with births.
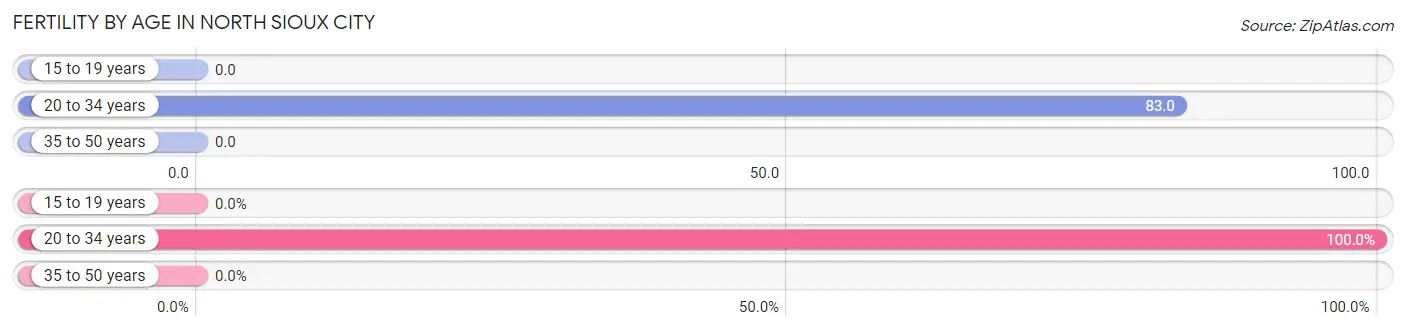
| Age Bracket | Women with Births | Births / 1,000 Women |
| 15 to 19 years | 0 (0.0%) | 0.0 |
| 20 to 34 years | 37 (100.0%) | 83.0 |
| 35 to 50 years | 0 (0.0%) | 0.0 |
| Total | 37 (100.0%) | 48.0 |
Fertility by Age by Marriage Status in North Sioux City
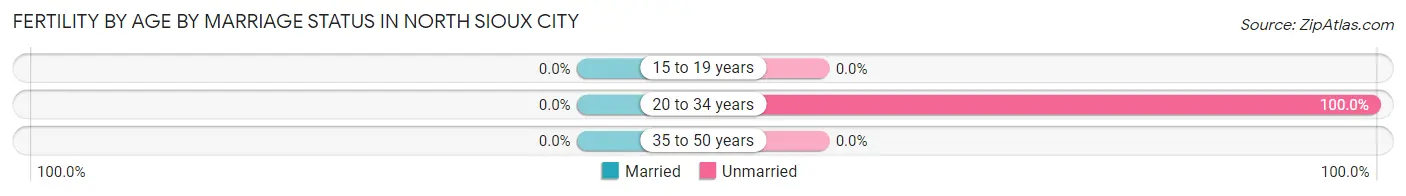
| Age Bracket | Married | Unmarried |
| 15 to 19 years | 0 (0.0%) | 0 (0.0%) |
| 20 to 34 years | 0 (0.0%) | 37 (100.0%) |
| 35 to 50 years | 0 (0.0%) | 0 (0.0%) |
| Total | 0 (0.0%) | 37 (100.0%) |
Fertility by Education in North Sioux City
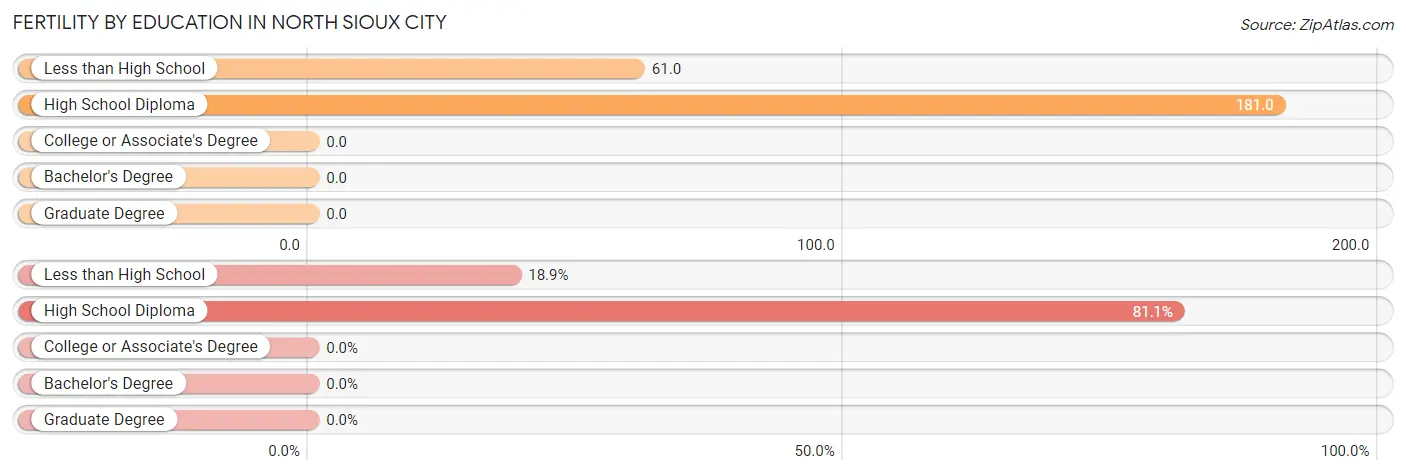
| Educational Attainment | Women with Births | Births / 1,000 Women |
| Less than High School | 7 (18.9%) | 61.0 |
| High School Diploma | 30 (81.1%) | 181.0 |
| College or Associate's Degree | 0 (0.0%) | 0.0 |
| Bachelor's Degree | 0 (0.0%) | 0.0 |
| Graduate Degree | 0 (0.0%) | 0.0 |
| Total | 37 (100.0%) | 48.0 |
Fertility by Education by Marriage Status in North Sioux City
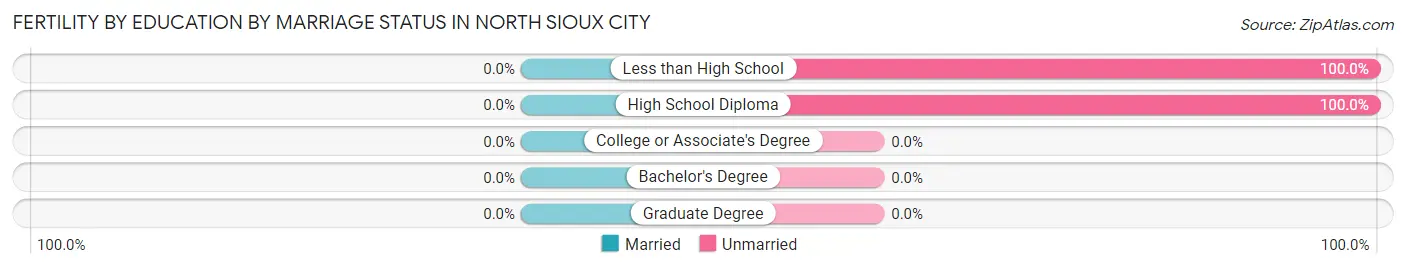
| Educational Attainment | Married | Unmarried |
| Less than High School | 0 (0.0%) | 7 (100.0%) |
| High School Diploma | 0 (0.0%) | 30 (100.0%) |
| College or Associate's Degree | 0 (0.0%) | 0 (0.0%) |
| Bachelor's Degree | 0 (0.0%) | 0 (0.0%) |
| Graduate Degree | 0 (0.0%) | 0 (0.0%) |
| Total | 0 (0.0%) | 37 (100.0%) |
Income in North Sioux City
Income Overview in North Sioux City
Per Capita Income in North Sioux City is $39,217, while median incomes of families and households are $92,862 and $62,284 respectively.
| Characteristic | Number | Measure |
| Per Capita Income | 2,984 | $39,217 |
| Median Family Income | 813 | $92,862 |
| Mean Family Income | 813 | $110,998 |
| Median Household Income | 1,361 | $62,284 |
| Mean Household Income | 1,361 | $87,127 |
| Income Deficit | 813 | $6,806 |
| Wage / Income Gap (%) | 2,984 | 35.00% |
| Wage / Income Gap ($) | 2,984 | 65.00¢ per $1 |
| Gini / Inequality Index | 2,984 | 0.45 |
Earnings by Sex in North Sioux City
Average Earnings in North Sioux City are $33,915, $45,292 for men and $29,439 for women, a difference of 35.0%.
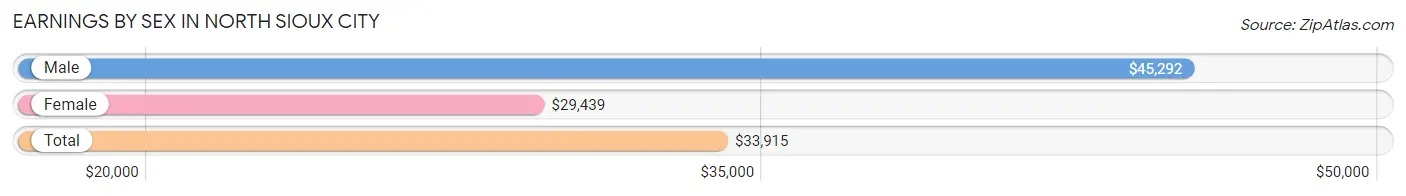
| Sex | Number | Average Earnings |
| Male | 901 (48.5%) | $45,292 |
| Female | 958 (51.5%) | $29,439 |
| Total | 1,859 (100.0%) | $33,915 |
Earnings by Sex by Income Bracket in North Sioux City
The most common earnings brackets in North Sioux City are $75,000 to $99,999 for men (148 | 16.4%) and $25,000 to $29,999 for women (106 | 11.1%).
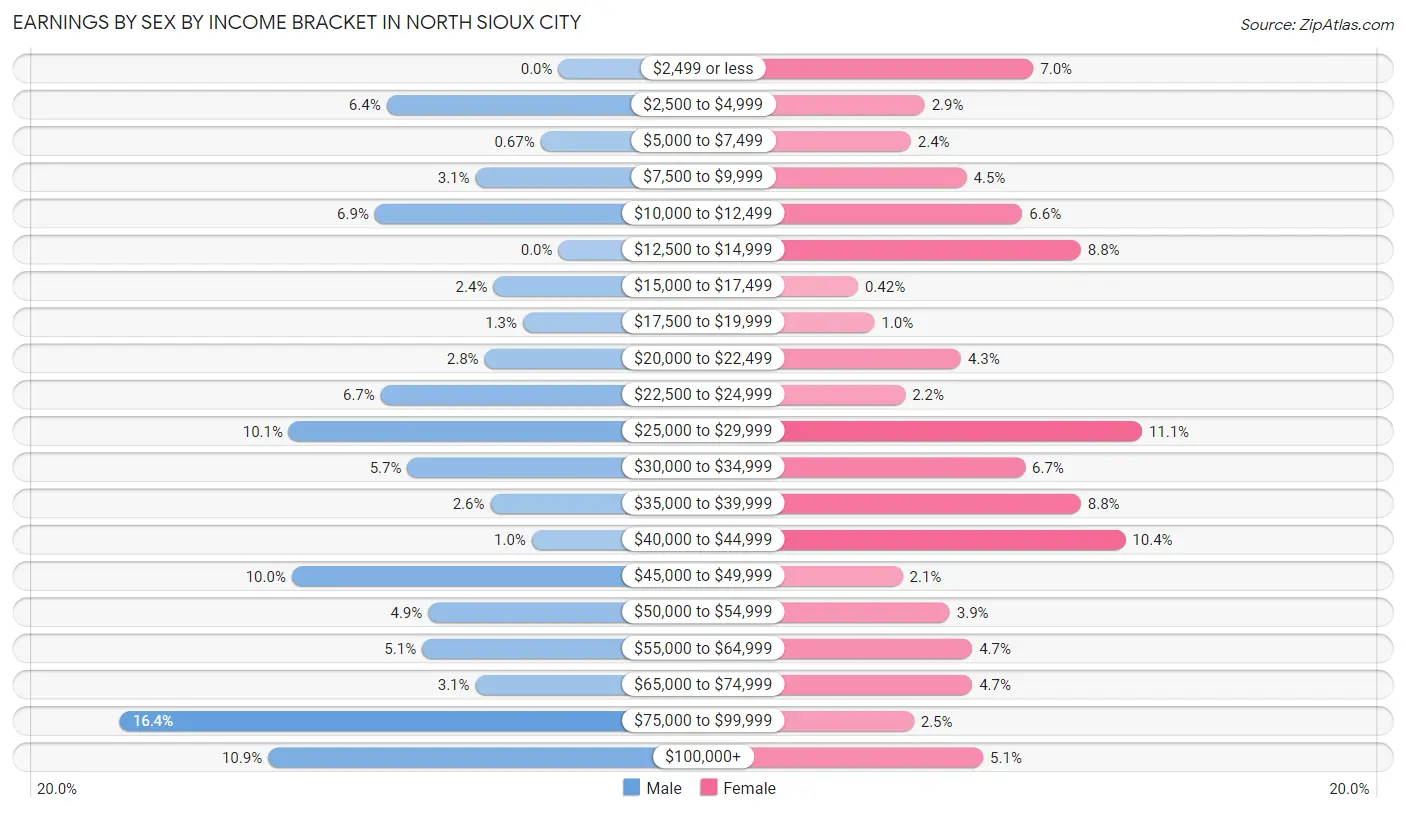
| Income | Male | Female |
| $2,499 or less | 0 (0.0%) | 67 (7.0%) |
| $2,500 to $4,999 | 58 (6.4%) | 28 (2.9%) |
| $5,000 to $7,499 | 6 (0.7%) | 23 (2.4%) |
| $7,500 to $9,999 | 28 (3.1%) | 43 (4.5%) |
| $10,000 to $12,499 | 62 (6.9%) | 63 (6.6%) |
| $12,500 to $14,999 | 0 (0.0%) | 84 (8.8%) |
| $15,000 to $17,499 | 22 (2.4%) | 4 (0.4%) |
| $17,500 to $19,999 | 12 (1.3%) | 10 (1.0%) |
| $20,000 to $22,499 | 25 (2.8%) | 41 (4.3%) |
| $22,500 to $24,999 | 60 (6.7%) | 21 (2.2%) |
| $25,000 to $29,999 | 91 (10.1%) | 106 (11.1%) |
| $30,000 to $34,999 | 51 (5.7%) | 64 (6.7%) |
| $35,000 to $39,999 | 23 (2.5%) | 84 (8.8%) |
| $40,000 to $44,999 | 9 (1.0%) | 100 (10.4%) |
| $45,000 to $49,999 | 90 (10.0%) | 20 (2.1%) |
| $50,000 to $54,999 | 44 (4.9%) | 37 (3.9%) |
| $55,000 to $64,999 | 46 (5.1%) | 45 (4.7%) |
| $65,000 to $74,999 | 28 (3.1%) | 45 (4.7%) |
| $75,000 to $99,999 | 148 (16.4%) | 24 (2.5%) |
| $100,000+ | 98 (10.9%) | 49 (5.1%) |
| Total | 901 (100.0%) | 958 (100.0%) |
Earnings by Sex by Educational Attainment in North Sioux City
Average earnings in North Sioux City are $48,792 for men and $34,130 for women, a difference of 30.0%. Men with an educational attainment of graduate degree enjoy the highest average annual earnings of $87,386, while those with high school diploma education earn the least with $29,661. Women with an educational attainment of college or associate's degree earn the most with the average annual earnings of $40,385, while those with high school diploma education have the smallest earnings of $23,750.
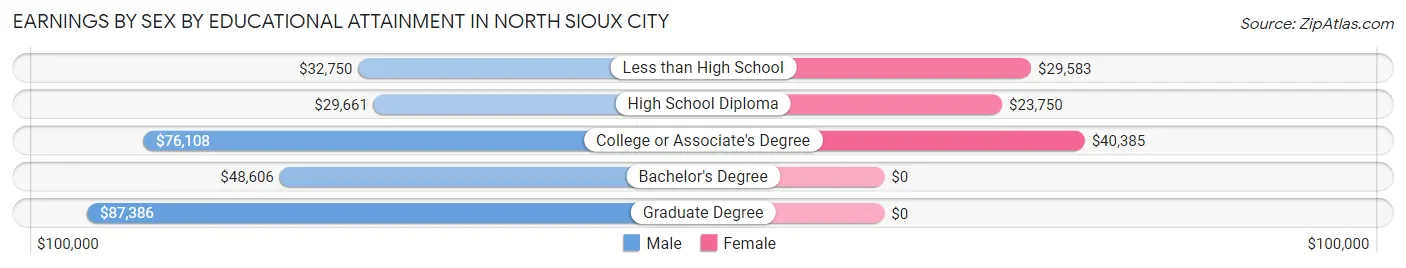
| Educational Attainment | Male Income | Female Income |
| Less than High School | $32,750 | $29,583 |
| High School Diploma | $29,661 | $23,750 |
| College or Associate's Degree | $76,108 | $40,385 |
| Bachelor's Degree | $48,606 | $0 |
| Graduate Degree | $87,386 | $0 |
| Total | $48,792 | $34,130 |
Family Income in North Sioux City
Family Income Brackets in North Sioux City
According to the North Sioux City family income data, there are 214 families falling into the $100,000 to $149,999 income range, which is the most common income bracket and makes up 26.3% of all families. Conversely, the less than $10,000 income bracket is the least frequent group with only 7 families (0.9%) belonging to this category.
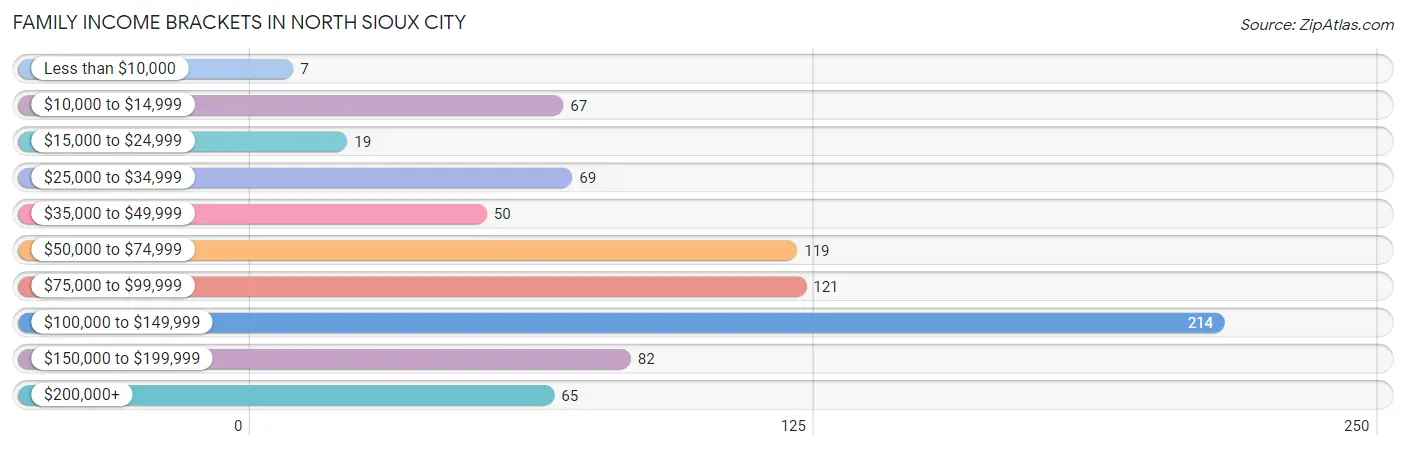
| Income Bracket | # Families | % Families |
| Less than $10,000 | 7 | 0.9% |
| $10,000 to $14,999 | 67 | 8.2% |
| $15,000 to $24,999 | 19 | 2.3% |
| $25,000 to $34,999 | 69 | 8.5% |
| $35,000 to $49,999 | 50 | 6.2% |
| $50,000 to $74,999 | 119 | 14.6% |
| $75,000 to $99,999 | 121 | 14.9% |
| $100,000 to $149,999 | 214 | 26.3% |
| $150,000 to $199,999 | 82 | 10.1% |
| $200,000+ | 65 | 8.0% |
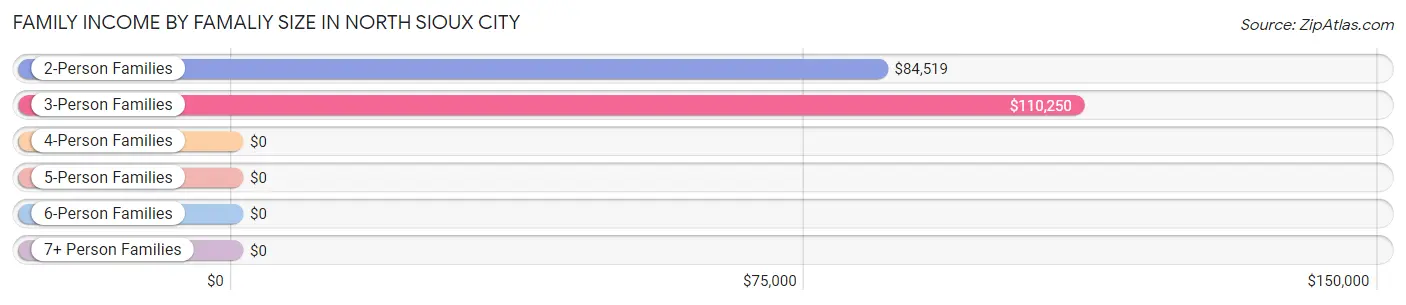
Family Income by Famaliy Size in North Sioux City
3-person families (179 | 22.0%) account for the highest median family income in North Sioux City with $110,250 per family, while 2-person families (504 | 62.0%) have the highest median income of $42,260 per family member.
| Income Bracket | # Families | Median Income |
| 2-Person Families | 504 (62.0%) | $84,519 |
| 3-Person Families | 179 (22.0%) | $110,250 |
| 4-Person Families | 93 (11.4%) | $0 |
| 5-Person Families | 37 (4.5%) | $0 |
| 6-Person Families | 0 (0.0%) | $0 |
| 7+ Person Families | 0 (0.0%) | $0 |
| Total | 813 (100.0%) | $92,862 |
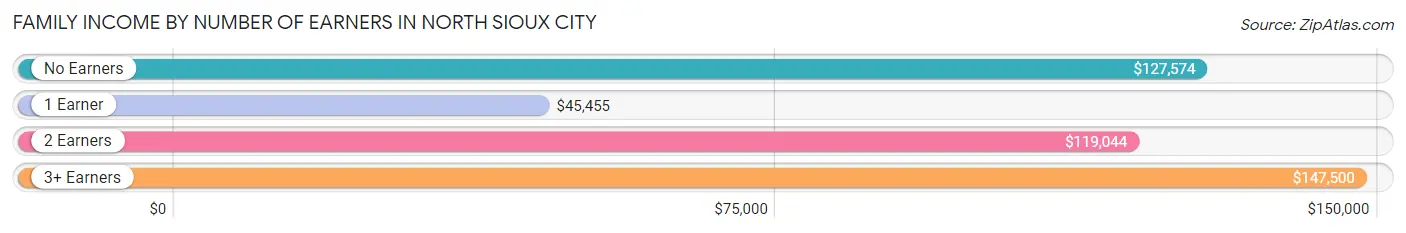
Family Income by Number of Earners in North Sioux City
The median family income in North Sioux City is $92,862, with families comprising 3+ earners (68) having the highest median family income of $147,500, while families with 1 earner (298) have the lowest median family income of $45,455, accounting for 8.4% and 36.6% of families, respectively.
| Number of Earners | # Families | Median Income |
| No Earners | 112 (13.8%) | $127,574 |
| 1 Earner | 298 (36.6%) | $45,455 |
| 2 Earners | 335 (41.2%) | $119,044 |
| 3+ Earners | 68 (8.4%) | $147,500 |
| Total | 813 (100.0%) | $92,862 |
Household Income in North Sioux City
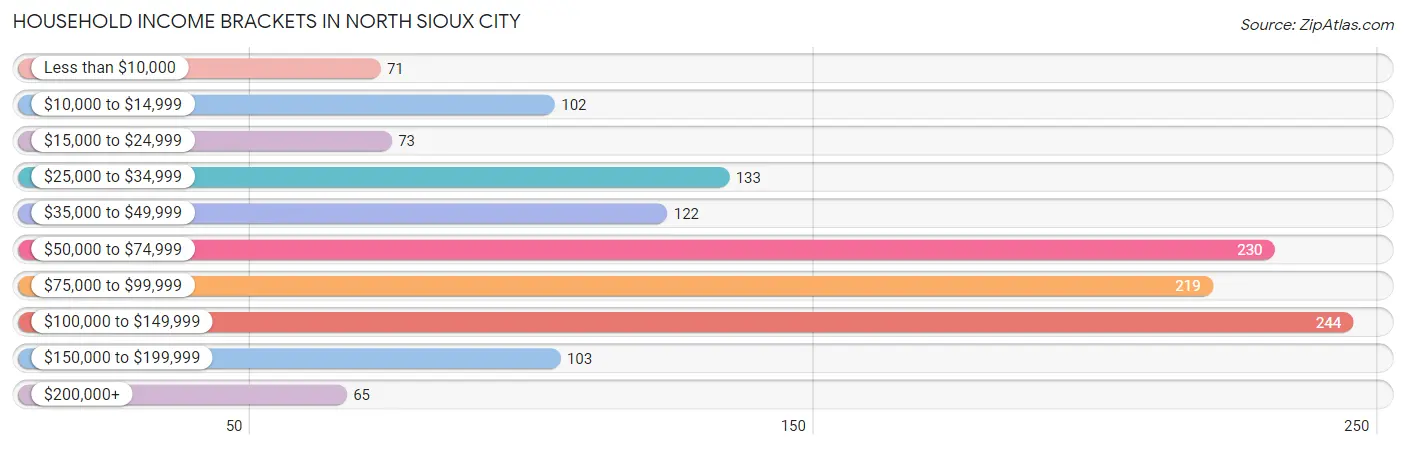
Household Income Brackets in North Sioux City
With 244 households falling in the category, the $100,000 to $149,999 income range is the most frequent in North Sioux City, accounting for 17.9% of all households. In contrast, only 65 households (4.8%) fall into the $200,000+ income bracket, making it the least populous group.
| Income Bracket | # Households | % Households |
| Less than $10,000 | 71 | 5.2% |
| $10,000 to $14,999 | 102 | 7.5% |
| $15,000 to $24,999 | 73 | 5.4% |
| $25,000 to $34,999 | 133 | 9.8% |
| $35,000 to $49,999 | 122 | 9.0% |
| $50,000 to $74,999 | 230 | 16.9% |
| $75,000 to $99,999 | 219 | 16.1% |
| $100,000 to $149,999 | 244 | 17.9% |
| $150,000 to $199,999 | 103 | 7.6% |
| $200,000+ | 65 | 4.8% |
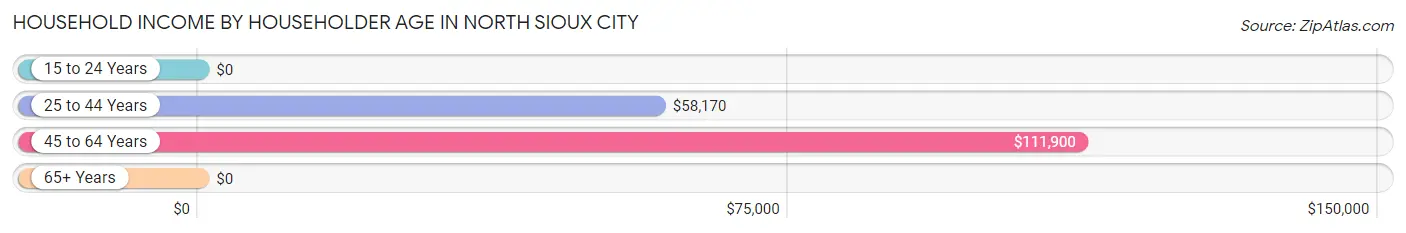
Household Income by Householder Age in North Sioux City
The median household income in North Sioux City is $62,284, with the highest median household income of $111,900 found in the 45 to 64 years age bracket for the primary householder. A total of 462 households (34.0%) fall into this category. Meanwhile, the 15 to 24 years age bracket for the primary householder has the lowest median household income of $0, with 187 households (13.7%) in this group.
| Income Bracket | # Households | Median Income |
| 15 to 24 Years | 187 (13.7%) | $0 |
| 25 to 44 Years | 435 (32.0%) | $58,170 |
| 45 to 64 Years | 462 (34.0%) | $111,900 |
| 65+ Years | 277 (20.3%) | $0 |
| Total | 1,361 (100.0%) | $62,284 |
Poverty in North Sioux City
Income Below Poverty by Sex and Age in North Sioux City
With 6.3% poverty level for males and 22.8% for females among the residents of North Sioux City, 15 year old males and 15 year old females are the most vulnerable to poverty, with 8 males (57.1%) and 22 females (100.0%) in their respective age groups living below the poverty level.
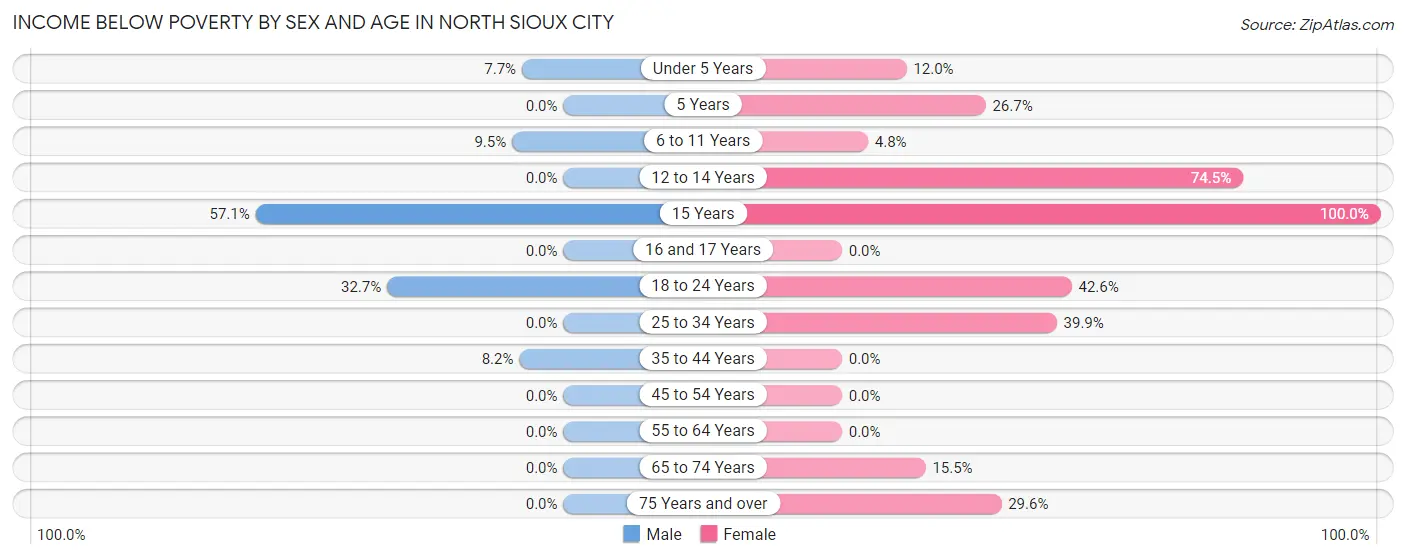
| Age Bracket | Male | Female |
| Under 5 Years | 7 (7.7%) | 9 (12.0%) |
| 5 Years | 0 (0.0%) | 8 (26.7%) |
| 6 to 11 Years | 8 (9.5%) | 6 (4.8%) |
| 12 to 14 Years | 0 (0.0%) | 70 (74.5%) |
| 15 Years | 8 (57.1%) | 22 (100.0%) |
| 16 and 17 Years | 0 (0.0%) | 0 (0.0%) |
| 18 to 24 Years | 53 (32.7%) | 84 (42.6%) |
| 25 to 34 Years | 0 (0.0%) | 120 (39.9%) |
| 35 to 44 Years | 9 (8.2%) | 0 (0.0%) |
| 45 to 54 Years | 0 (0.0%) | 0 (0.0%) |
| 55 to 64 Years | 0 (0.0%) | 0 (0.0%) |
| 65 to 74 Years | 0 (0.0%) | 25 (15.5%) |
| 75 Years and over | 0 (0.0%) | 29 (29.6%) |
| Total | 85 (6.3%) | 373 (22.8%) |
Income Above Poverty by Sex and Age in North Sioux City
According to the poverty statistics in North Sioux City, males aged 5 years and females aged 16 and 17 years are the age groups that are most secure financially, with 100.0% of males and 100.0% of females in these age groups living above the poverty line.
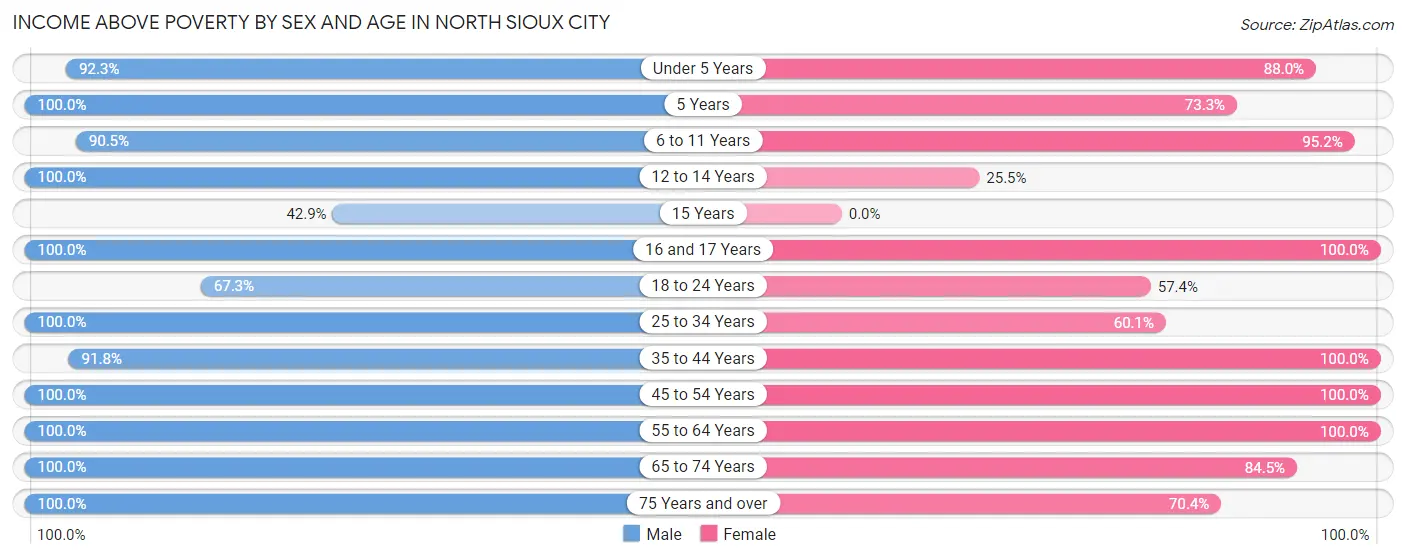
| Age Bracket | Male | Female |
| Under 5 Years | 84 (92.3%) | 66 (88.0%) |
| 5 Years | 26 (100.0%) | 22 (73.3%) |
| 6 to 11 Years | 76 (90.5%) | 118 (95.2%) |
| 12 to 14 Years | 47 (100.0%) | 24 (25.5%) |
| 15 Years | 6 (42.9%) | 0 (0.0%) |
| 16 and 17 Years | 6 (100.0%) | 40 (100.0%) |
| 18 to 24 Years | 109 (67.3%) | 113 (57.4%) |
| 25 to 34 Years | 245 (100.0%) | 181 (60.1%) |
| 35 to 44 Years | 101 (91.8%) | 97 (100.0%) |
| 45 to 54 Years | 165 (100.0%) | 163 (100.0%) |
| 55 to 64 Years | 166 (100.0%) | 234 (100.0%) |
| 65 to 74 Years | 198 (100.0%) | 136 (84.5%) |
| 75 Years and over | 28 (100.0%) | 69 (70.4%) |
| Total | 1,257 (93.7%) | 1,263 (77.2%) |
Income Below Poverty Among Married-Couple Families in North Sioux City
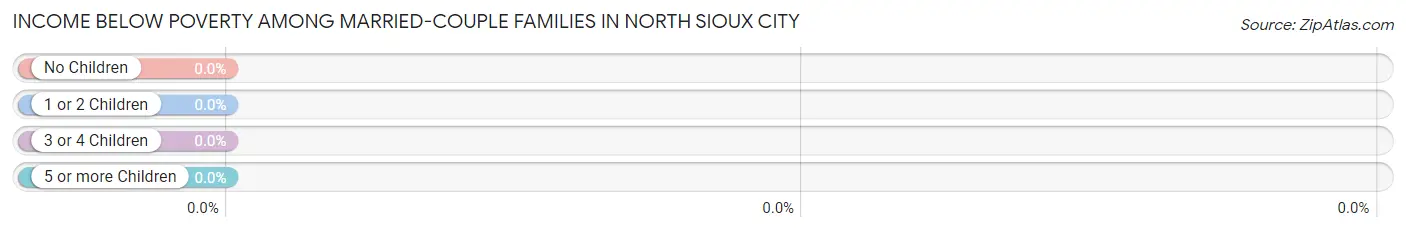
| Children | Above Poverty | Below Poverty |
| No Children | 399 (100.0%) | 0 (0.0%) |
| 1 or 2 Children | 101 (100.0%) | 0 (0.0%) |
| 3 or 4 Children | 11 (100.0%) | 0 (0.0%) |
| 5 or more Children | 0 (0.0%) | 0 (0.0%) |
| Total | 511 (100.0%) | 0 (0.0%) |
Income Below Poverty Among Single-Parent Households in North Sioux City
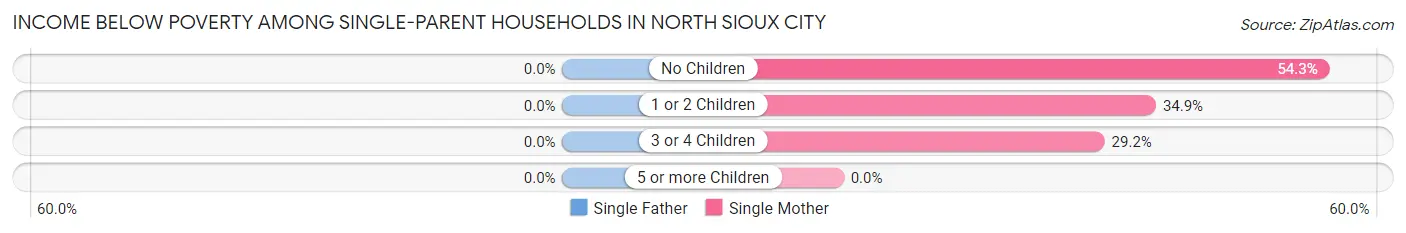
| Children | Single Father | Single Mother |
| No Children | 0 (0.0%) | 19 (54.3%) |
| 1 or 2 Children | 0 (0.0%) | 67 (34.9%) |
| 3 or 4 Children | 0 (0.0%) | 7 (29.2%) |
| 5 or more Children | 0 (0.0%) | 0 (0.0%) |
| Total | 0 (0.0%) | 93 (37.0%) |
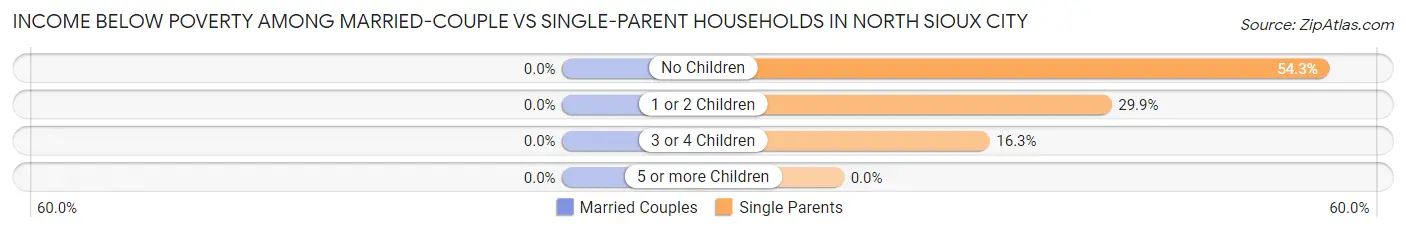
Income Below Poverty Among Married-Couple vs Single-Parent Households in North Sioux City
| Children | Married-Couple Families | Single-Parent Households |
| No Children | 0 (0.0%) | 19 (54.3%) |
| 1 or 2 Children | 0 (0.0%) | 67 (29.9%) |
| 3 or 4 Children | 0 (0.0%) | 7 (16.3%) |
| 5 or more Children | 0 (0.0%) | 0 (0.0%) |
| Total | 0 (0.0%) | 93 (30.8%) |
Employment Characteristics in North Sioux City
Employment by Class of Employer in North Sioux City
Among the 1,554 employed individuals in North Sioux City, private company employees (1,232 | 79.3%), not-for-profit organizations (116 | 7.5%), and local government employees (114 | 7.3%) make up the most common classes of employment.
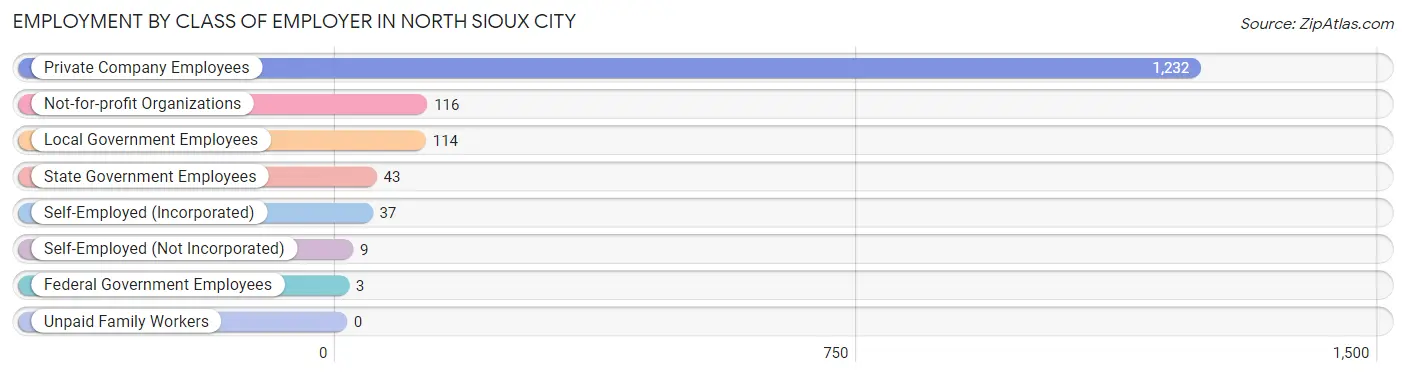
| Employer Class | # Employees | % Employees |
| Private Company Employees | 1,232 | 79.3% |
| Self-Employed (Incorporated) | 37 | 2.4% |
| Self-Employed (Not Incorporated) | 9 | 0.6% |
| Not-for-profit Organizations | 116 | 7.5% |
| Local Government Employees | 114 | 7.3% |
| State Government Employees | 43 | 2.8% |
| Federal Government Employees | 3 | 0.2% |
| Unpaid Family Workers | 0 | 0.0% |
| Total | 1,554 | 100.0% |
Employment Status by Age in North Sioux City
According to the labor force statistics for North Sioux City, out of the total population over 16 years of age (2,371), 69.5% or 1,648 individuals are in the labor force, with 5.2% or 86 of them unemployed. The age group with the highest labor force participation rate is 35 to 44 years, with 100.0% or 207 individuals in the labor force. Within the labor force, the 16 to 19 years age range has the highest percentage of unemployed individuals, with 48.5% or 33 of them being unemployed.
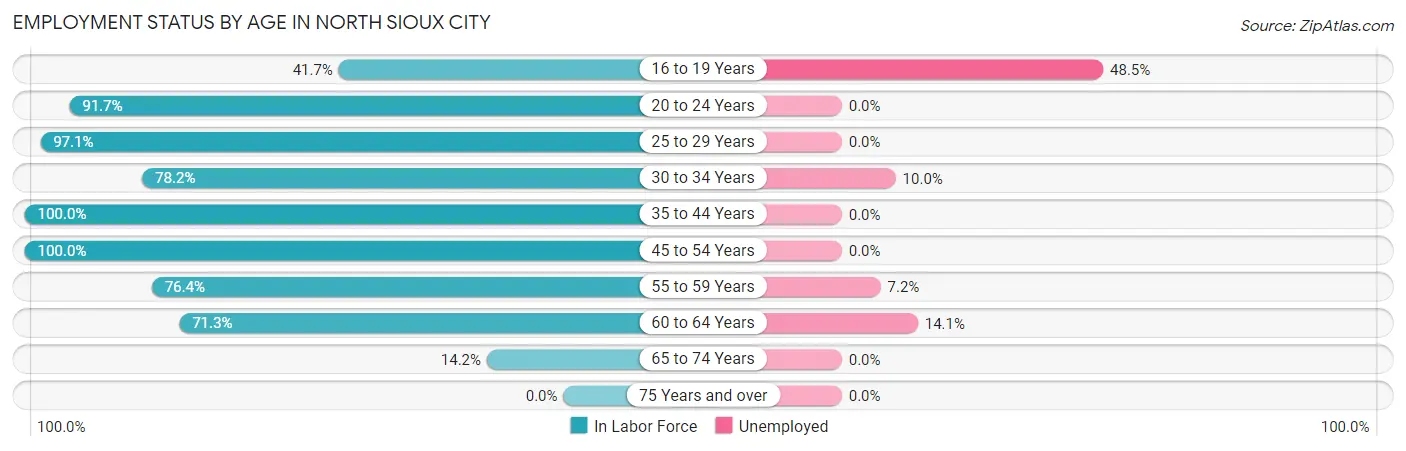
| Age Bracket | In Labor Force | Unemployed |
| 16 to 19 Years | 68 (41.7%) | 33 (48.5%) |
| 20 to 24 Years | 222 (91.7%) | 0 (0.0%) |
| 25 to 29 Years | 232 (97.1%) | 0 (0.0%) |
| 30 to 34 Years | 240 (78.2%) | 24 (10.0%) |
| 35 to 44 Years | 207 (100.0%) | 0 (0.0%) |
| 45 to 54 Years | 328 (100.0%) | 0 (0.0%) |
| 55 to 59 Years | 207 (76.4%) | 15 (7.2%) |
| 60 to 64 Years | 92 (71.3%) | 13 (14.1%) |
| 65 to 74 Years | 51 (14.2%) | 0 (0.0%) |
| 75 Years and over | 0 (0.0%) | 0 (0.0%) |
| Total | 1,648 (69.5%) | 86 (5.2%) |
Employment Status by Educational Attainment in North Sioux City
According to labor force statistics for North Sioux City, 88.2% of individuals (1,306) out of the total population between 25 and 64 years of age (1,481) are in the labor force, with 4.0% or 52 of them being unemployed. The group with the highest labor force participation rate are those with the educational attainment of college / associate degree, with 94.3% or 499 individuals in the labor force. Within the labor force, individuals with high school diploma education have the highest percentage of unemployment, with 12.1% or 39 of them being unemployed.
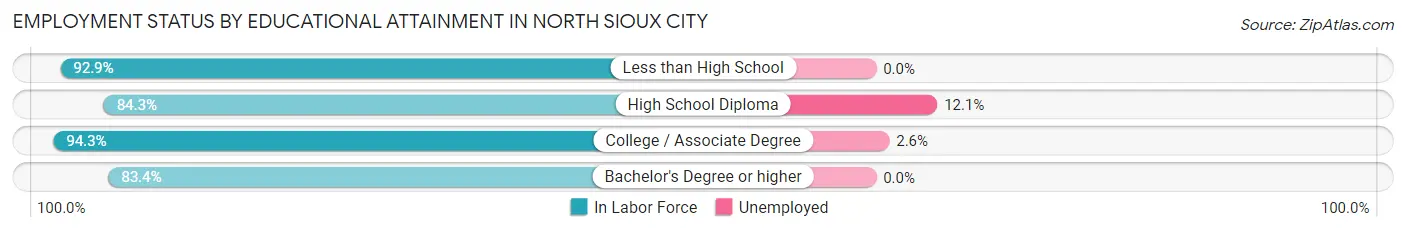
| Educational Attainment | In Labor Force | Unemployed |
| Less than High School | 92 (92.9%) | 0 (0.0%) |
| High School Diploma | 323 (84.3%) | 46 (12.1%) |
| College / Associate Degree | 499 (94.3%) | 14 (2.6%) |
| Bachelor's Degree or higher | 392 (83.4%) | 0 (0.0%) |
| Total | 1,306 (88.2%) | 59 (4.0%) |
Employment Occupations by Sex in North Sioux City
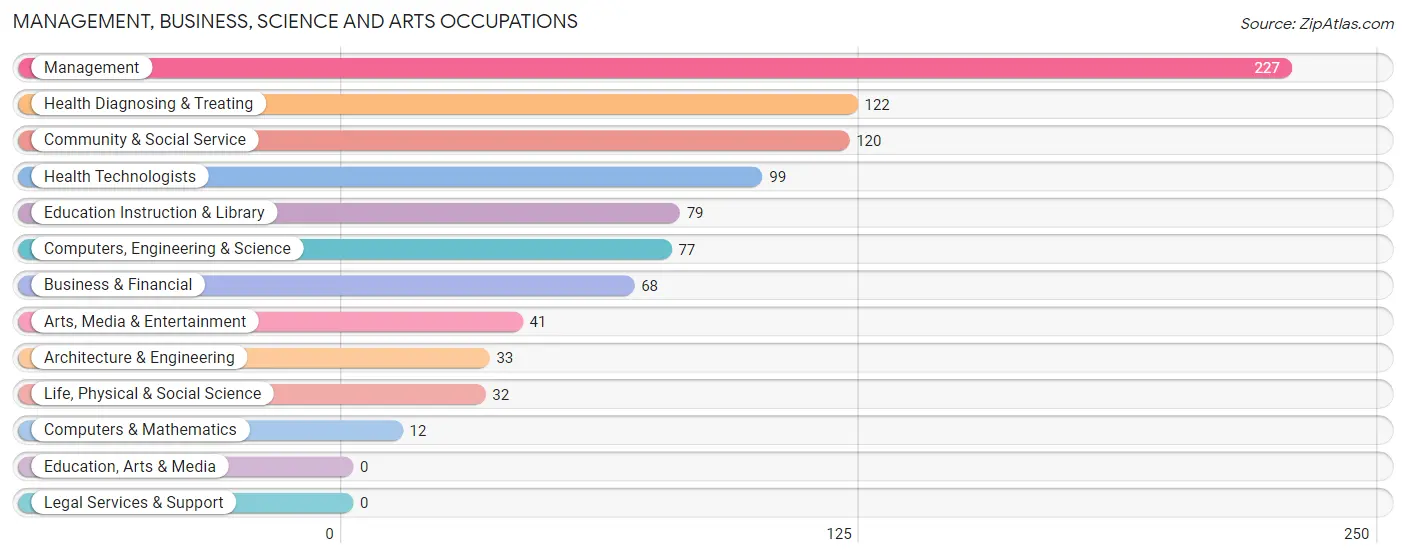
Management, Business, Science and Arts Occupations
The most common Management, Business, Science and Arts occupations in North Sioux City are Management (227 | 14.5%), Health Diagnosing & Treating (122 | 7.8%), Community & Social Service (120 | 7.7%), Health Technologists (99 | 6.3%), and Education Instruction & Library (79 | 5.1%).
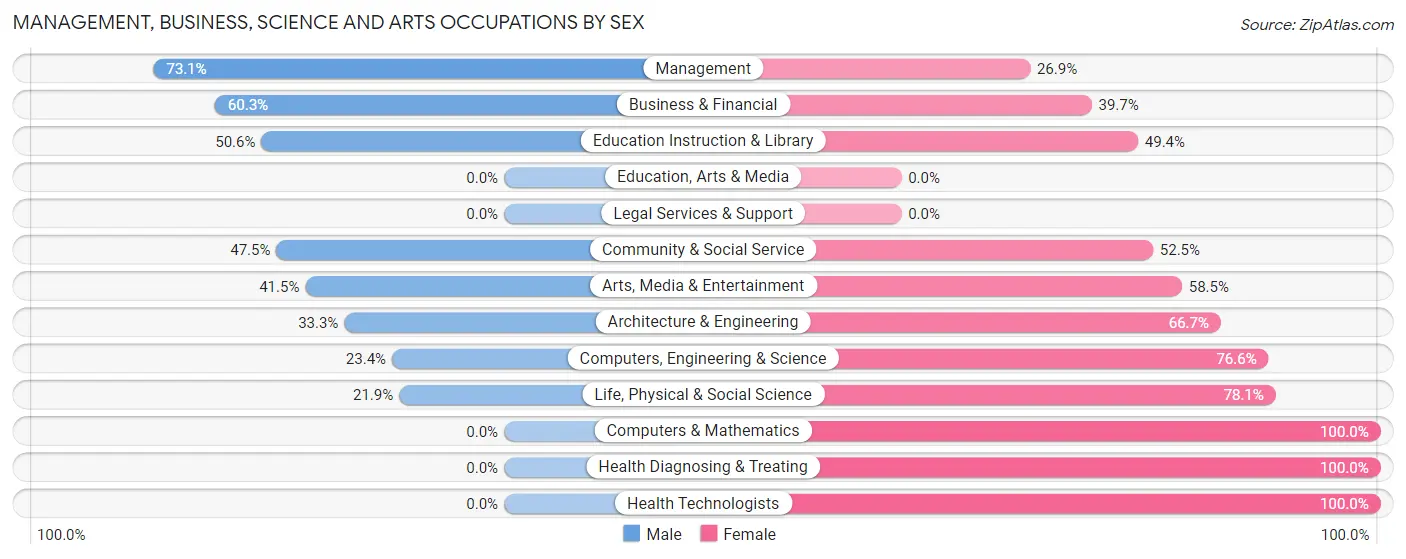
Management, Business, Science and Arts Occupations by Sex
Within the Management, Business, Science and Arts occupations in North Sioux City, the most male-oriented occupations are Management (73.1%), Business & Financial (60.3%), and Education Instruction & Library (50.6%), while the most female-oriented occupations are Computers & Mathematics (100.0%), Health Diagnosing & Treating (100.0%), and Health Technologists (100.0%).
| Occupation | Male | Female |
| Management | 166 (73.1%) | 61 (26.9%) |
| Business & Financial | 41 (60.3%) | 27 (39.7%) |
| Computers, Engineering & Science | 18 (23.4%) | 59 (76.6%) |
| Computers & Mathematics | 0 (0.0%) | 12 (100.0%) |
| Architecture & Engineering | 11 (33.3%) | 22 (66.7%) |
| Life, Physical & Social Science | 7 (21.9%) | 25 (78.1%) |
| Community & Social Service | 57 (47.5%) | 63 (52.5%) |
| Education, Arts & Media | 0 (0.0%) | 0 (0.0%) |
| Legal Services & Support | 0 (0.0%) | 0 (0.0%) |
| Education Instruction & Library | 40 (50.6%) | 39 (49.4%) |
| Arts, Media & Entertainment | 17 (41.5%) | 24 (58.5%) |
| Health Diagnosing & Treating | 0 (0.0%) | 122 (100.0%) |
| Health Technologists | 0 (0.0%) | 99 (100.0%) |
| Total (Category) | 282 (45.9%) | 332 (54.1%) |
| Total (Overall) | 770 (49.3%) | 792 (50.7%) |
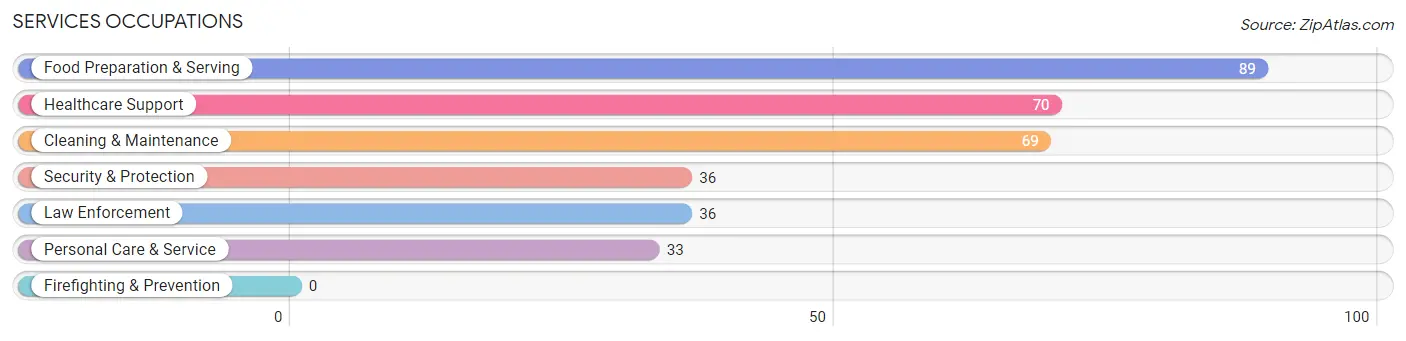
Services Occupations
The most common Services occupations in North Sioux City are Food Preparation & Serving (89 | 5.7%), Healthcare Support (70 | 4.5%), Cleaning & Maintenance (69 | 4.4%), Security & Protection (36 | 2.3%), and Law Enforcement (36 | 2.3%).
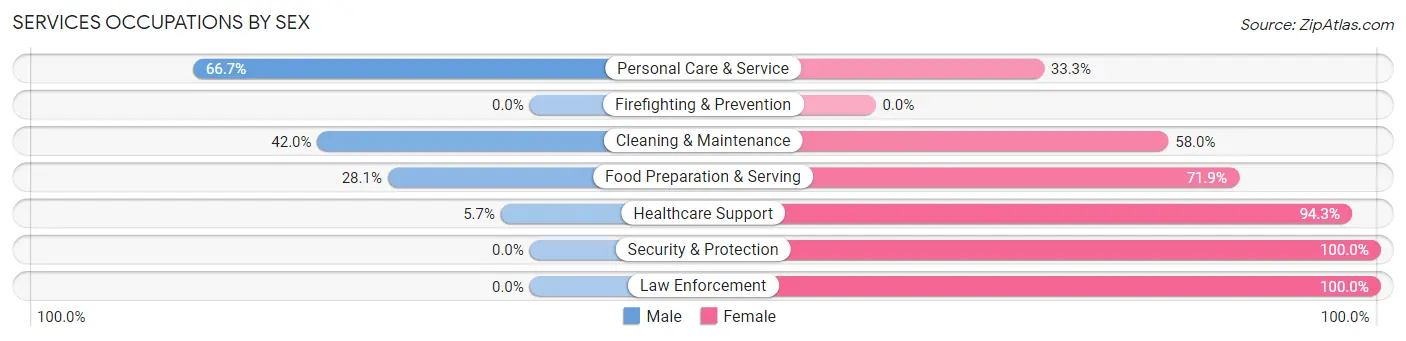
Services Occupations by Sex
Within the Services occupations in North Sioux City, the most male-oriented occupations are Personal Care & Service (66.7%), Cleaning & Maintenance (42.0%), and Food Preparation & Serving (28.1%), while the most female-oriented occupations are Security & Protection (100.0%), Law Enforcement (100.0%), and Healthcare Support (94.3%).
| Occupation | Male | Female |
| Healthcare Support | 4 (5.7%) | 66 (94.3%) |
| Security & Protection | 0 (0.0%) | 36 (100.0%) |
| Firefighting & Prevention | 0 (0.0%) | 0 (0.0%) |
| Law Enforcement | 0 (0.0%) | 36 (100.0%) |
| Food Preparation & Serving | 25 (28.1%) | 64 (71.9%) |
| Cleaning & Maintenance | 29 (42.0%) | 40 (58.0%) |
| Personal Care & Service | 22 (66.7%) | 11 (33.3%) |
| Total (Category) | 80 (26.9%) | 217 (73.1%) |
| Total (Overall) | 770 (49.3%) | 792 (50.7%) |
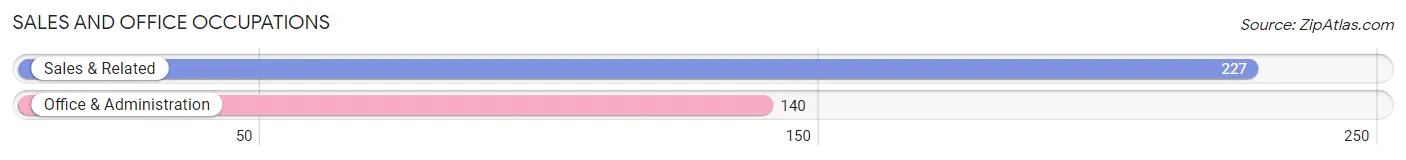
Sales and Office Occupations
The most common Sales and Office occupations in North Sioux City are Sales & Related (227 | 14.5%), and Office & Administration (140 | 9.0%).
Sales and Office Occupations by Sex
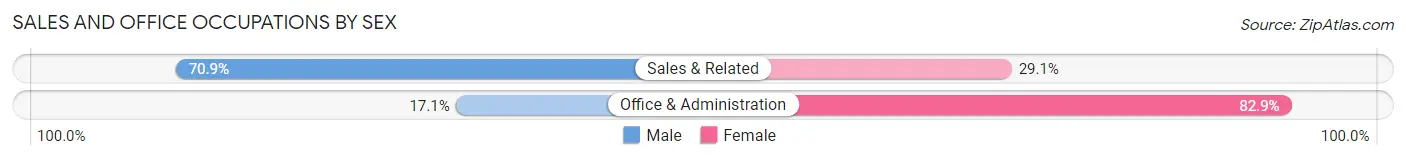
| Occupation | Male | Female |
| Sales & Related | 161 (70.9%) | 66 (29.1%) |
| Office & Administration | 24 (17.1%) | 116 (82.9%) |
| Total (Category) | 185 (50.4%) | 182 (49.6%) |
| Total (Overall) | 770 (49.3%) | 792 (50.7%) |
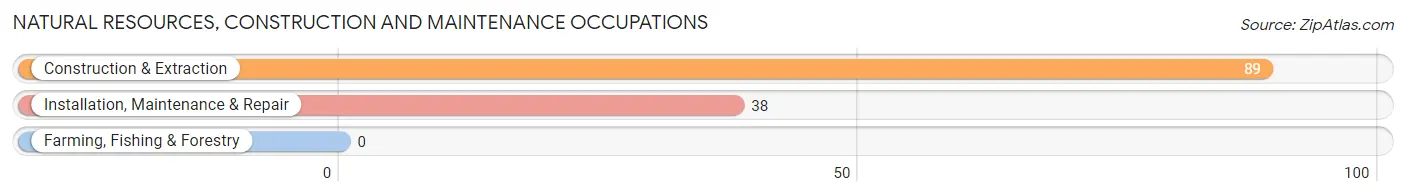
Natural Resources, Construction and Maintenance Occupations
The most common Natural Resources, Construction and Maintenance occupations in North Sioux City are Construction & Extraction (89 | 5.7%), and Installation, Maintenance & Repair (38 | 2.4%).
Natural Resources, Construction and Maintenance Occupations by Sex
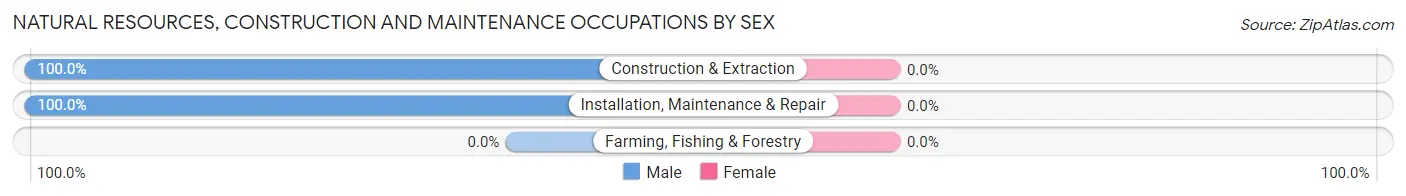
| Occupation | Male | Female |
| Farming, Fishing & Forestry | 0 (0.0%) | 0 (0.0%) |
| Construction & Extraction | 89 (100.0%) | 0 (0.0%) |
| Installation, Maintenance & Repair | 38 (100.0%) | 0 (0.0%) |
| Total (Category) | 127 (100.0%) | 0 (0.0%) |
| Total (Overall) | 770 (49.3%) | 792 (50.7%) |
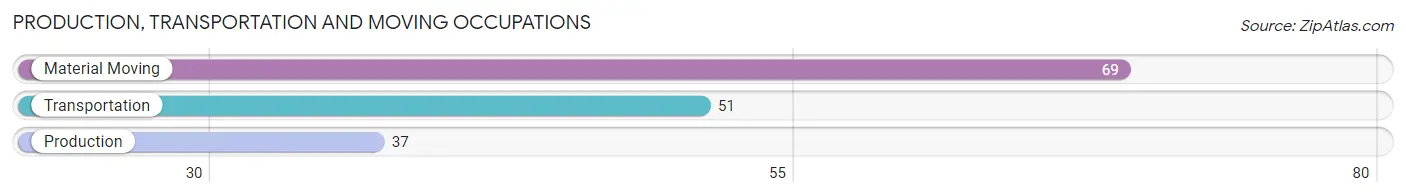
Production, Transportation and Moving Occupations
The most common Production, Transportation and Moving occupations in North Sioux City are Material Moving (69 | 4.4%), Transportation (51 | 3.3%), and Production (37 | 2.4%).
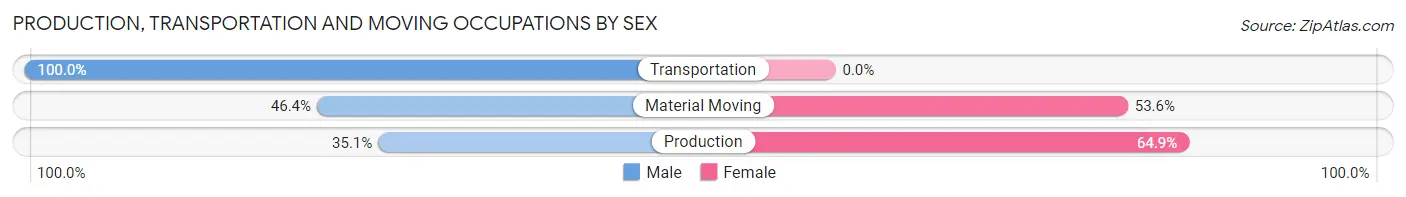
Production, Transportation and Moving Occupations by Sex
| Occupation | Male | Female |
| Production | 13 (35.1%) | 24 (64.9%) |
| Transportation | 51 (100.0%) | 0 (0.0%) |
| Material Moving | 32 (46.4%) | 37 (53.6%) |
| Total (Category) | 96 (61.2%) | 61 (38.9%) |
| Total (Overall) | 770 (49.3%) | 792 (50.7%) |
Employment Industries by Sex in North Sioux City
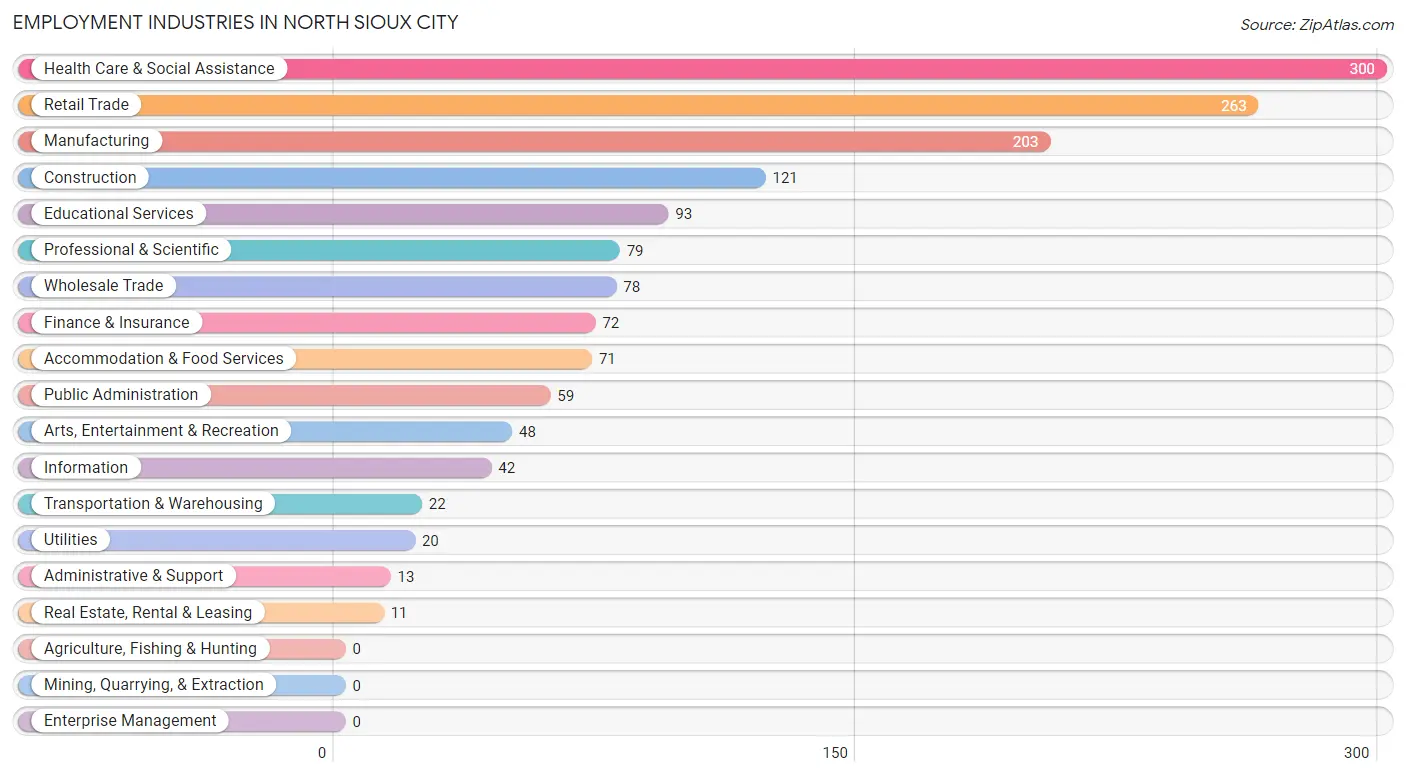
Employment Industries in North Sioux City
The major employment industries in North Sioux City include Health Care & Social Assistance (300 | 19.2%), Retail Trade (263 | 16.8%), Manufacturing (203 | 13.0%), Construction (121 | 7.7%), and Educational Services (93 | 5.9%).
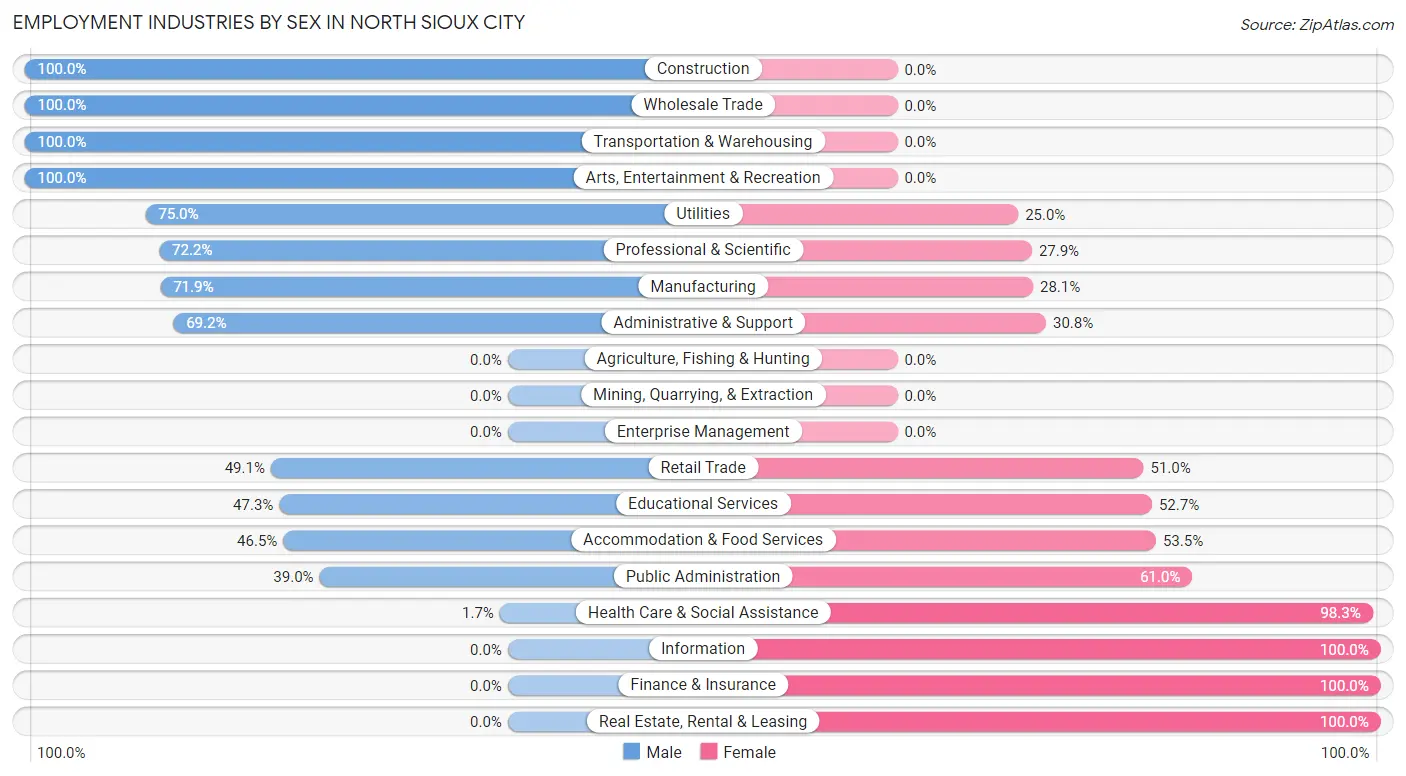
Employment Industries by Sex in North Sioux City
The North Sioux City industries that see more men than women are Construction (100.0%), Wholesale Trade (100.0%), and Transportation & Warehousing (100.0%), whereas the industries that tend to have a higher number of women are Information (100.0%), Finance & Insurance (100.0%), and Real Estate, Rental & Leasing (100.0%).
| Industry | Male | Female |
| Agriculture, Fishing & Hunting | 0 (0.0%) | 0 (0.0%) |
| Mining, Quarrying, & Extraction | 0 (0.0%) | 0 (0.0%) |
| Construction | 121 (100.0%) | 0 (0.0%) |
| Manufacturing | 146 (71.9%) | 57 (28.1%) |
| Wholesale Trade | 78 (100.0%) | 0 (0.0%) |
| Retail Trade | 129 (49.0%) | 134 (50.9%) |
| Transportation & Warehousing | 22 (100.0%) | 0 (0.0%) |
| Utilities | 15 (75.0%) | 5 (25.0%) |
| Information | 0 (0.0%) | 42 (100.0%) |
| Finance & Insurance | 0 (0.0%) | 72 (100.0%) |
| Real Estate, Rental & Leasing | 0 (0.0%) | 11 (100.0%) |
| Professional & Scientific | 57 (72.2%) | 22 (27.9%) |
| Enterprise Management | 0 (0.0%) | 0 (0.0%) |
| Administrative & Support | 9 (69.2%) | 4 (30.8%) |
| Educational Services | 44 (47.3%) | 49 (52.7%) |
| Health Care & Social Assistance | 5 (1.7%) | 295 (98.3%) |
| Arts, Entertainment & Recreation | 48 (100.0%) | 0 (0.0%) |
| Accommodation & Food Services | 33 (46.5%) | 38 (53.5%) |
| Public Administration | 23 (39.0%) | 36 (61.0%) |
| Total | 770 (49.3%) | 792 (50.7%) |
Education in North Sioux City
School Enrollment in North Sioux City
The most common levels of schooling among the 787 students in North Sioux City are college / undergraduate (223 | 28.3%), middle school (180 | 22.9%), and high school (155 | 19.7%).
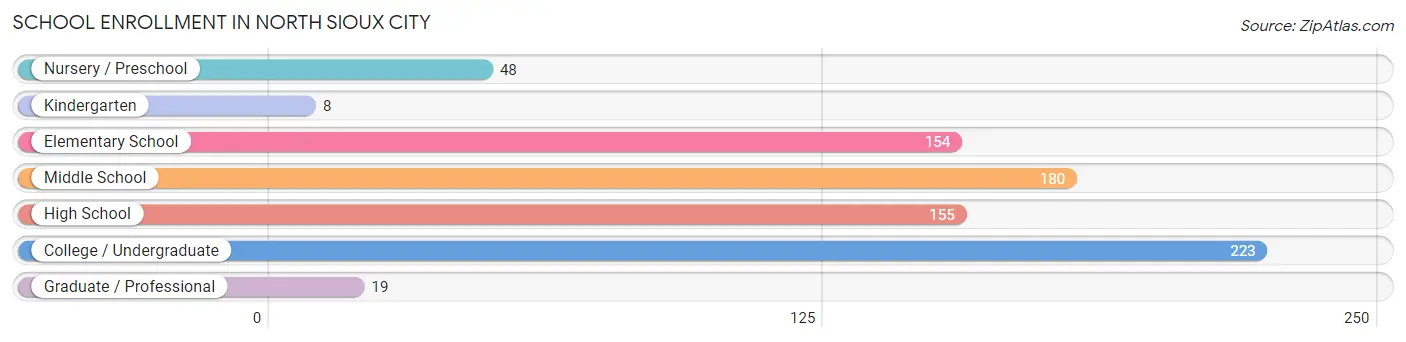
| School Level | # Students | % Students |
| Nursery / Preschool | 48 | 6.1% |
| Kindergarten | 8 | 1.0% |
| Elementary School | 154 | 19.6% |
| Middle School | 180 | 22.9% |
| High School | 155 | 19.7% |
| College / Undergraduate | 223 | 28.3% |
| Graduate / Professional | 19 | 2.4% |
| Total | 787 | 100.0% |
School Enrollment by Age by Funding Source in North Sioux City
Out of a total of 787 students who are enrolled in schools in North Sioux City, 54 (6.9%) attend a private institution, while the remaining 733 (93.1%) are enrolled in public schools. The age group of 5 to 9 year old has the highest likelihood of being enrolled in private schools, with 54 (25.7% in the age bracket) enrolled. Conversely, the age group of 10 to 14 year olds has the lowest likelihood of being enrolled in a private school, with 180 (100.0% in the age bracket) attending a public institution.
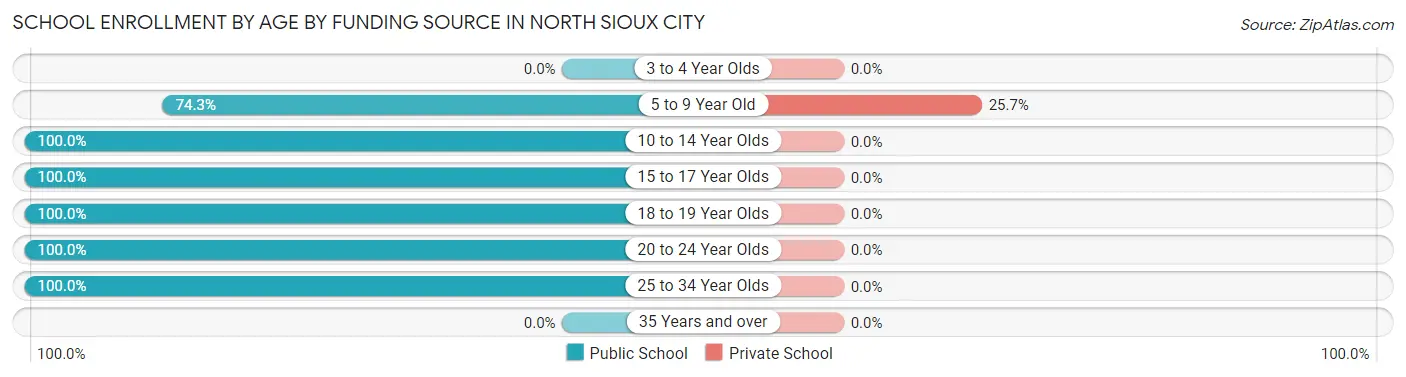
| Age Bracket | Public School | Private School |
| 3 to 4 Year Olds | 0 (0.0%) | 0 (0.0%) |
| 5 to 9 Year Old | 156 (74.3%) | 54 (25.7%) |
| 10 to 14 Year Olds | 180 (100.0%) | 0 (0.0%) |
| 15 to 17 Year Olds | 82 (100.0%) | 0 (0.0%) |
| 18 to 19 Year Olds | 95 (100.0%) | 0 (0.0%) |
| 20 to 24 Year Olds | 107 (100.0%) | 0 (0.0%) |
| 25 to 34 Year Olds | 113 (100.0%) | 0 (0.0%) |
| 35 Years and over | 0 (0.0%) | 0 (0.0%) |
| Total | 733 (93.1%) | 54 (6.9%) |
Educational Attainment by Field of Study in North Sioux City
Arts & humanities (130 | 19.4%), science & technology (109 | 16.2%), engineering (87 | 13.0%), education (76 | 11.3%), and psychology (73 | 10.9%) are the most common fields of study among 672 individuals in North Sioux City who have obtained a bachelor's degree or higher.
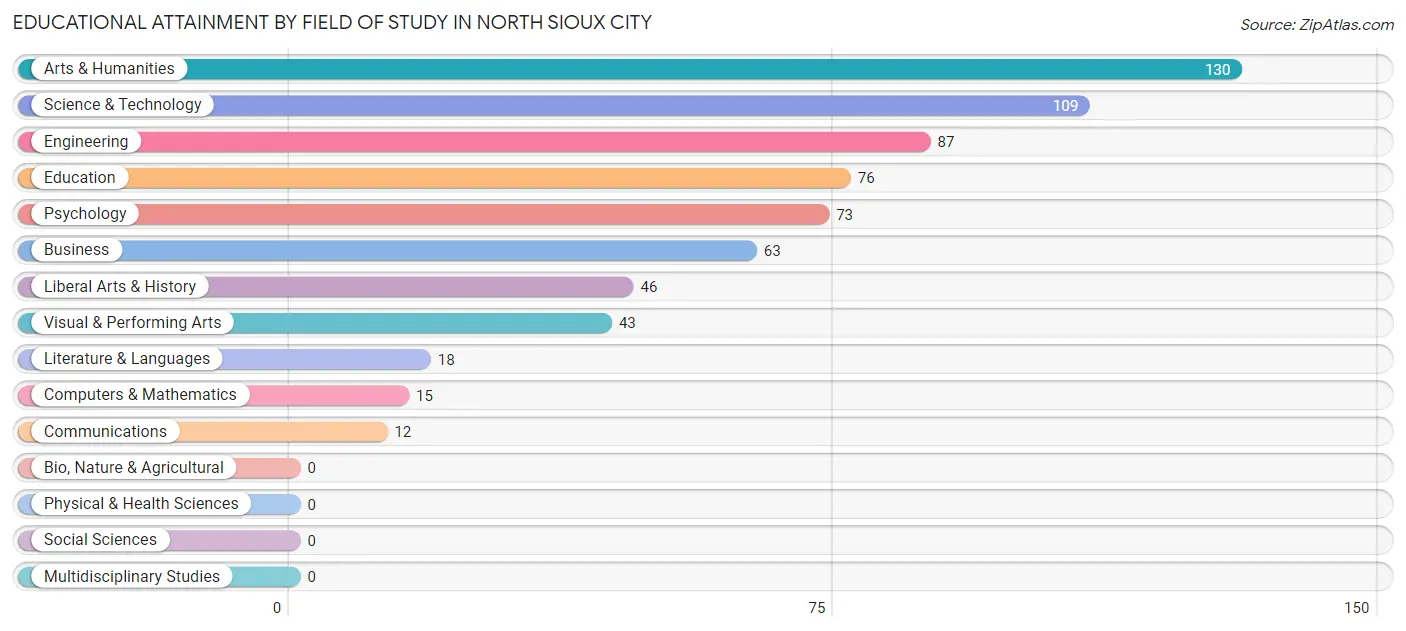
| Field of Study | # Graduates | % Graduates |
| Computers & Mathematics | 15 | 2.2% |
| Bio, Nature & Agricultural | 0 | 0.0% |
| Physical & Health Sciences | 0 | 0.0% |
| Psychology | 73 | 10.9% |
| Social Sciences | 0 | 0.0% |
| Engineering | 87 | 13.0% |
| Multidisciplinary Studies | 0 | 0.0% |
| Science & Technology | 109 | 16.2% |
| Business | 63 | 9.4% |
| Education | 76 | 11.3% |
| Literature & Languages | 18 | 2.7% |
| Liberal Arts & History | 46 | 6.9% |
| Visual & Performing Arts | 43 | 6.4% |
| Communications | 12 | 1.8% |
| Arts & Humanities | 130 | 19.4% |
| Total | 672 | 100.0% |
Transportation & Commute in North Sioux City
Vehicle Availability by Sex in North Sioux City
The most prevalent vehicle ownership categories in North Sioux City are males with 2 vehicles (374, accounting for 48.6%) and females with 2 vehicles (388, making up 47.7%).
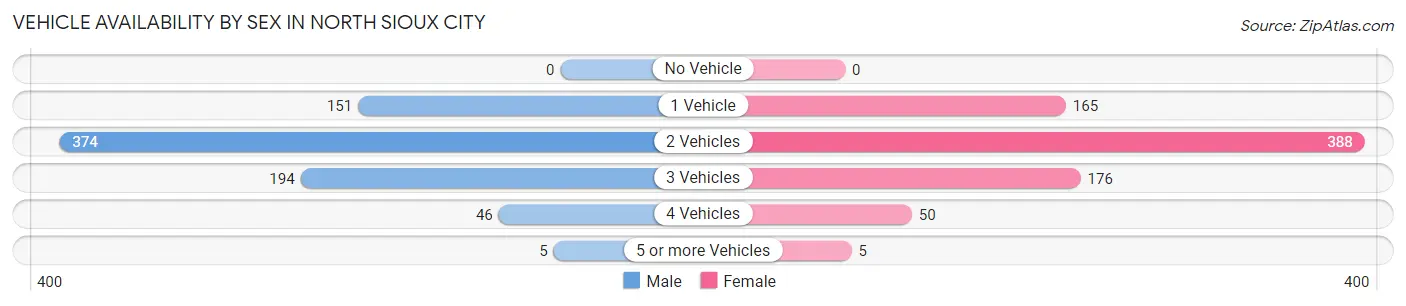
| Vehicles Available | Male | Female |
| No Vehicle | 0 (0.0%) | 0 (0.0%) |
| 1 Vehicle | 151 (19.6%) | 165 (21.0%) |
| 2 Vehicles | 374 (48.6%) | 388 (49.5%) |
| 3 Vehicles | 194 (25.2%) | 176 (22.5%) |
| 4 Vehicles | 46 (6.0%) | 50 (6.4%) |
| 5 or more Vehicles | 5 (0.6%) | 5 (0.6%) |
| Total | 770 (100.0%) | 784 (100.0%) |
Commute Time in North Sioux City
The most frequently occuring commute durations in North Sioux City are 15 to 19 minutes (377 commuters, 24.4%), 5 to 9 minutes (268 commuters, 17.3%), and 20 to 24 minutes (235 commuters, 15.2%).
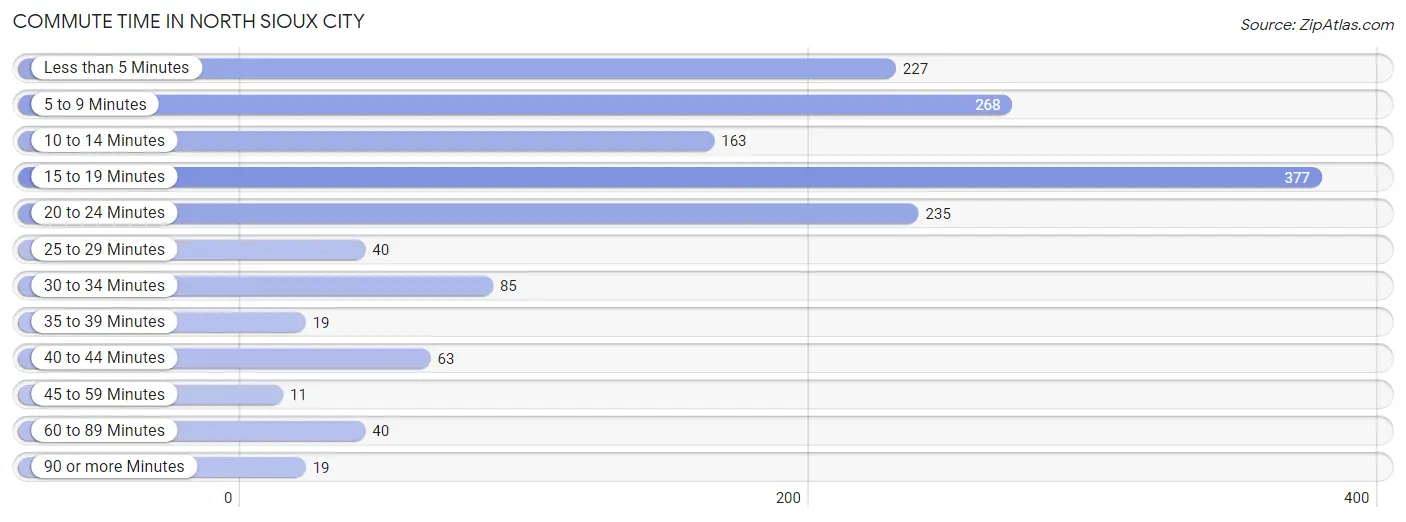
| Commute Time | # Commuters | % Commuters |
| Less than 5 Minutes | 227 | 14.7% |
| 5 to 9 Minutes | 268 | 17.3% |
| 10 to 14 Minutes | 163 | 10.5% |
| 15 to 19 Minutes | 377 | 24.4% |
| 20 to 24 Minutes | 235 | 15.2% |
| 25 to 29 Minutes | 40 | 2.6% |
| 30 to 34 Minutes | 85 | 5.5% |
| 35 to 39 Minutes | 19 | 1.2% |
| 40 to 44 Minutes | 63 | 4.1% |
| 45 to 59 Minutes | 11 | 0.7% |
| 60 to 89 Minutes | 40 | 2.6% |
| 90 or more Minutes | 19 | 1.2% |
Commute Time by Sex in North Sioux City
The most common commute times in North Sioux City are 15 to 19 minutes (209 commuters, 27.1%) for males and 5 to 9 minutes (169 commuters, 21.7%) for females.
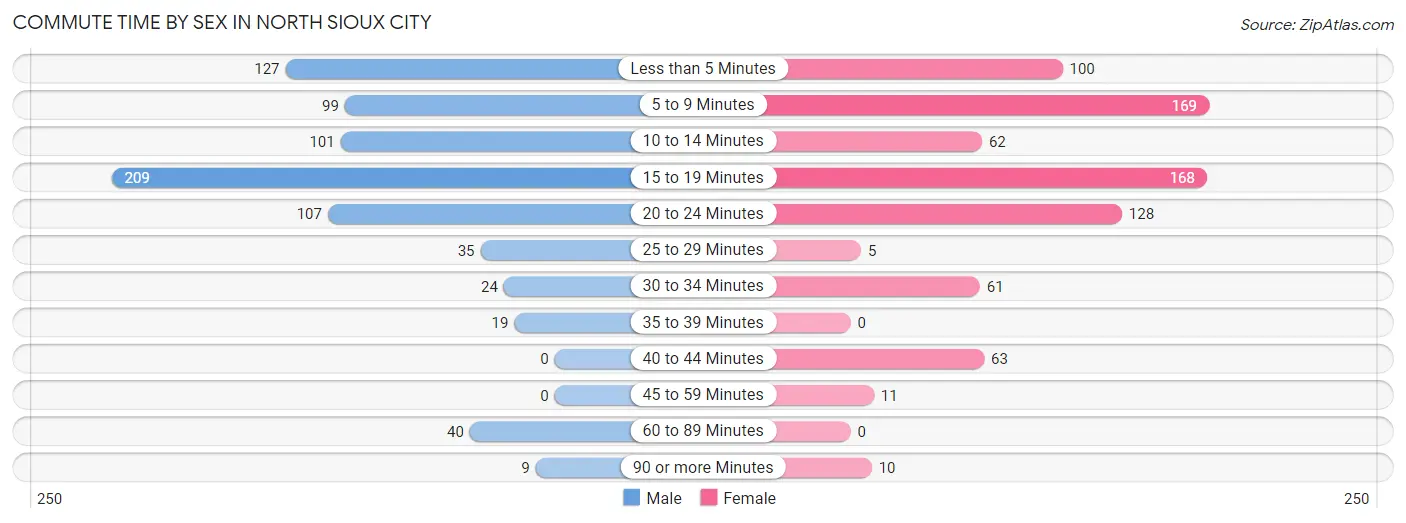
| Commute Time | Male | Female |
| Less than 5 Minutes | 127 (16.5%) | 100 (12.9%) |
| 5 to 9 Minutes | 99 (12.9%) | 169 (21.7%) |
| 10 to 14 Minutes | 101 (13.1%) | 62 (8.0%) |
| 15 to 19 Minutes | 209 (27.1%) | 168 (21.6%) |
| 20 to 24 Minutes | 107 (13.9%) | 128 (16.5%) |
| 25 to 29 Minutes | 35 (4.5%) | 5 (0.6%) |
| 30 to 34 Minutes | 24 (3.1%) | 61 (7.9%) |
| 35 to 39 Minutes | 19 (2.5%) | 0 (0.0%) |
| 40 to 44 Minutes | 0 (0.0%) | 63 (8.1%) |
| 45 to 59 Minutes | 0 (0.0%) | 11 (1.4%) |
| 60 to 89 Minutes | 40 (5.2%) | 0 (0.0%) |
| 90 or more Minutes | 9 (1.2%) | 10 (1.3%) |
Time of Departure to Work by Sex in North Sioux City
The most frequent times of departure to work in North Sioux City are 7:00 AM to 7:29 AM (145, 18.8%) for males and 7:00 AM to 7:29 AM (315, 40.5%) for females.
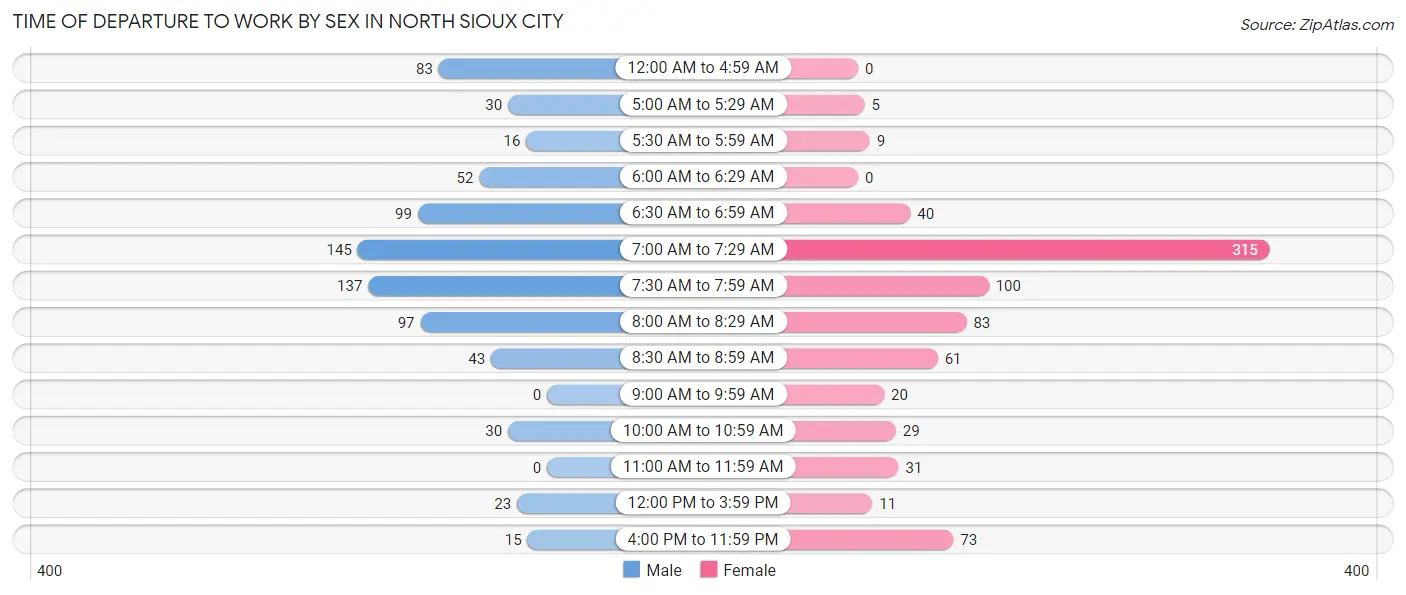
| Time of Departure | Male | Female |
| 12:00 AM to 4:59 AM | 83 (10.8%) | 0 (0.0%) |
| 5:00 AM to 5:29 AM | 30 (3.9%) | 5 (0.6%) |
| 5:30 AM to 5:59 AM | 16 (2.1%) | 9 (1.2%) |
| 6:00 AM to 6:29 AM | 52 (6.8%) | 0 (0.0%) |
| 6:30 AM to 6:59 AM | 99 (12.9%) | 40 (5.1%) |
| 7:00 AM to 7:29 AM | 145 (18.8%) | 315 (40.5%) |
| 7:30 AM to 7:59 AM | 137 (17.8%) | 100 (12.9%) |
| 8:00 AM to 8:29 AM | 97 (12.6%) | 83 (10.7%) |
| 8:30 AM to 8:59 AM | 43 (5.6%) | 61 (7.9%) |
| 9:00 AM to 9:59 AM | 0 (0.0%) | 20 (2.6%) |
| 10:00 AM to 10:59 AM | 30 (3.9%) | 29 (3.7%) |
| 11:00 AM to 11:59 AM | 0 (0.0%) | 31 (4.0%) |
| 12:00 PM to 3:59 PM | 23 (3.0%) | 11 (1.4%) |
| 4:00 PM to 11:59 PM | 15 (1.9%) | 73 (9.4%) |
| Total | 770 (100.0%) | 777 (100.0%) |
Housing Occupancy in North Sioux City
Occupancy by Ownership in North Sioux City
Of the total 1,361 dwellings in North Sioux City, owner-occupied units account for 687 (50.5%), while renter-occupied units make up 674 (49.5%).
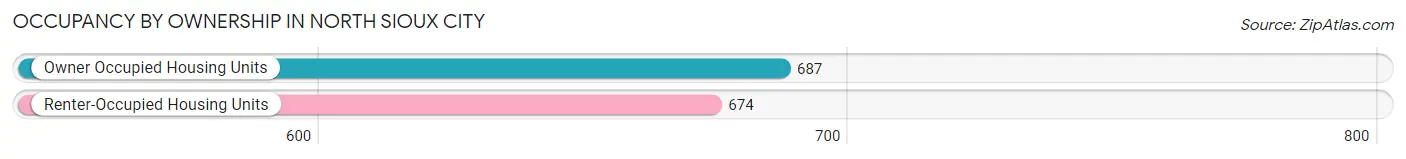
| Occupancy | # Housing Units | % Housing Units |
| Owner Occupied Housing Units | 687 | 50.5% |
| Renter-Occupied Housing Units | 674 | 49.5% |
| Total Occupied Housing Units | 1,361 | 100.0% |
Occupancy by Household Size in North Sioux City
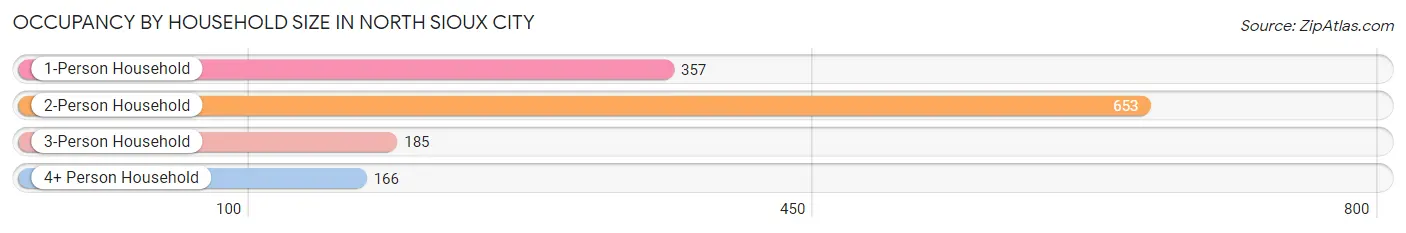
| Household Size | # Housing Units | % Housing Units |
| 1-Person Household | 357 | 26.2% |
| 2-Person Household | 653 | 48.0% |
| 3-Person Household | 185 | 13.6% |
| 4+ Person Household | 166 | 12.2% |
| Total Housing Units | 1,361 | 100.0% |
Occupancy by Ownership by Household Size in North Sioux City
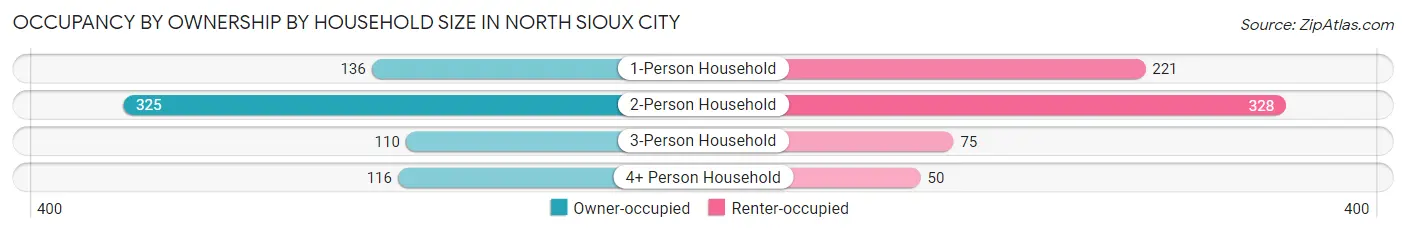
| Household Size | Owner-occupied | Renter-occupied |
| 1-Person Household | 136 (38.1%) | 221 (61.9%) |
| 2-Person Household | 325 (49.8%) | 328 (50.2%) |
| 3-Person Household | 110 (59.5%) | 75 (40.5%) |
| 4+ Person Household | 116 (69.9%) | 50 (30.1%) |
| Total Housing Units | 687 (50.5%) | 674 (49.5%) |
Occupancy by Educational Attainment in North Sioux City
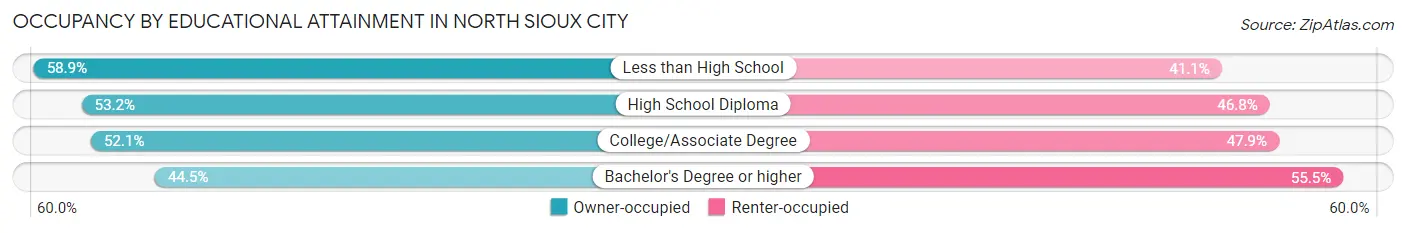
| Household Size | Owner-occupied | Renter-occupied |
| Less than High School | 76 (58.9%) | 53 (41.1%) |
| High School Diploma | 174 (53.2%) | 153 (46.8%) |
| College/Associate Degree | 236 (52.1%) | 217 (47.9%) |
| Bachelor's Degree or higher | 201 (44.5%) | 251 (55.5%) |
Occupancy by Age of Householder in North Sioux City
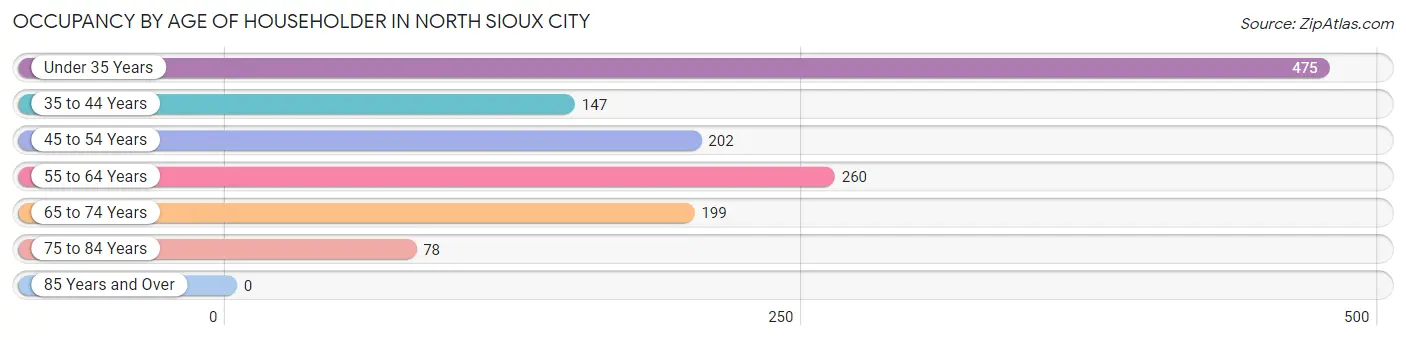
| Age Bracket | # Households | % Households |
| Under 35 Years | 475 | 34.9% |
| 35 to 44 Years | 147 | 10.8% |
| 45 to 54 Years | 202 | 14.8% |
| 55 to 64 Years | 260 | 19.1% |
| 65 to 74 Years | 199 | 14.6% |
| 75 to 84 Years | 78 | 5.7% |
| 85 Years and Over | 0 | 0.0% |
| Total | 1,361 | 100.0% |
Housing Finances in North Sioux City
Median Income by Occupancy in North Sioux City
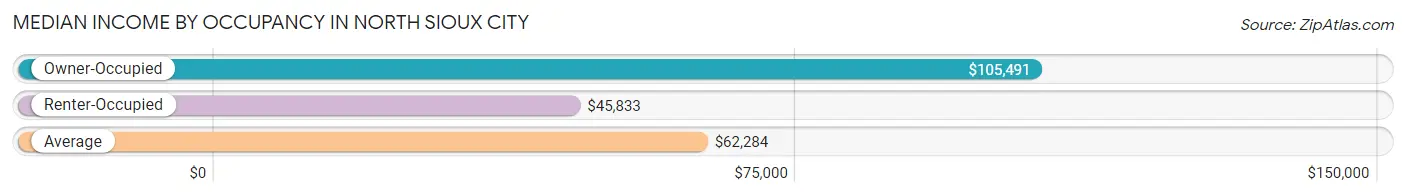
| Occupancy Type | # Households | Median Income |
| Owner-Occupied | 687 (50.5%) | $105,491 |
| Renter-Occupied | 674 (49.5%) | $45,833 |
| Average | 1,361 (100.0%) | $62,284 |
Occupancy by Householder Income Bracket in North Sioux City
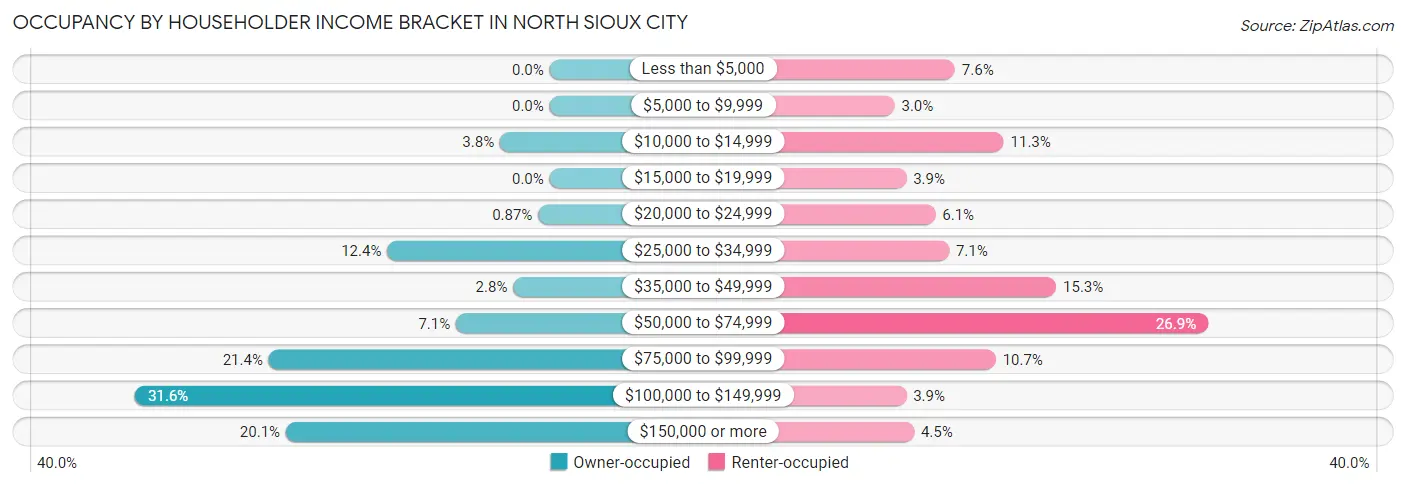
| Income Bracket | Owner-occupied | Renter-occupied |
| Less than $5,000 | 0 (0.0%) | 51 (7.6%) |
| $5,000 to $9,999 | 0 (0.0%) | 20 (3.0%) |
| $10,000 to $14,999 | 26 (3.8%) | 76 (11.3%) |
| $15,000 to $19,999 | 0 (0.0%) | 26 (3.9%) |
| $20,000 to $24,999 | 6 (0.9%) | 41 (6.1%) |
| $25,000 to $34,999 | 85 (12.4%) | 48 (7.1%) |
| $35,000 to $49,999 | 19 (2.8%) | 103 (15.3%) |
| $50,000 to $74,999 | 49 (7.1%) | 181 (26.9%) |
| $75,000 to $99,999 | 147 (21.4%) | 72 (10.7%) |
| $100,000 to $149,999 | 217 (31.6%) | 26 (3.9%) |
| $150,000 or more | 138 (20.1%) | 30 (4.4%) |
| Total | 687 (100.0%) | 674 (100.0%) |
Monthly Housing Cost Tiers in North Sioux City
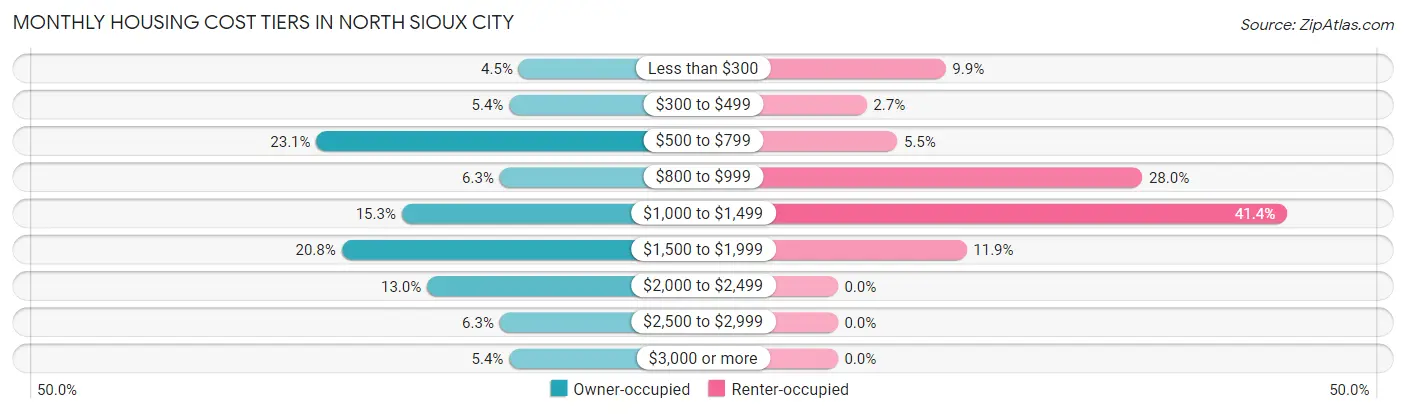
| Monthly Cost | Owner-occupied | Renter-occupied |
| Less than $300 | 31 (4.5%) | 67 (9.9%) |
| $300 to $499 | 37 (5.4%) | 18 (2.7%) |
| $500 to $799 | 159 (23.1%) | 37 (5.5%) |
| $800 to $999 | 43 (6.3%) | 189 (28.0%) |
| $1,000 to $1,499 | 105 (15.3%) | 279 (41.4%) |
| $1,500 to $1,999 | 143 (20.8%) | 80 (11.9%) |
| $2,000 to $2,499 | 89 (13.0%) | 0 (0.0%) |
| $2,500 to $2,999 | 43 (6.3%) | 0 (0.0%) |
| $3,000 or more | 37 (5.4%) | 0 (0.0%) |
| Total | 687 (100.0%) | 674 (100.0%) |
Physical Housing Characteristics in North Sioux City
Housing Structures in North Sioux City
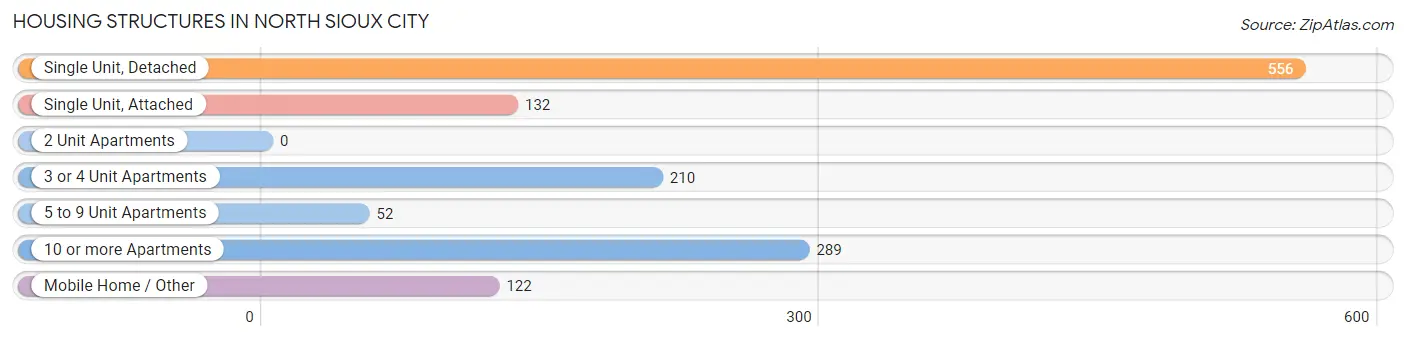
| Structure Type | # Housing Units | % Housing Units |
| Single Unit, Detached | 556 | 40.8% |
| Single Unit, Attached | 132 | 9.7% |
| 2 Unit Apartments | 0 | 0.0% |
| 3 or 4 Unit Apartments | 210 | 15.4% |
| 5 to 9 Unit Apartments | 52 | 3.8% |
| 10 or more Apartments | 289 | 21.2% |
| Mobile Home / Other | 122 | 9.0% |
| Total | 1,361 | 100.0% |
Housing Structures by Occupancy in North Sioux City
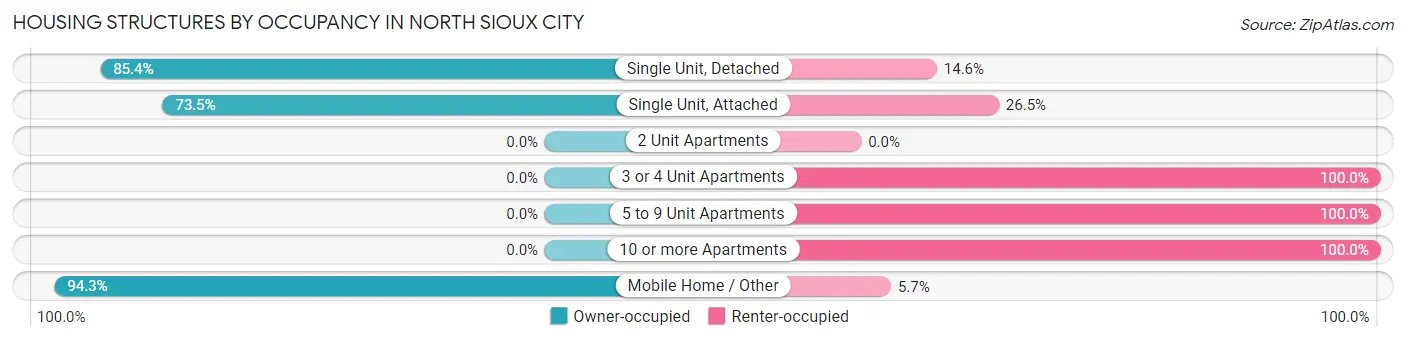
| Structure Type | Owner-occupied | Renter-occupied |
| Single Unit, Detached | 475 (85.4%) | 81 (14.6%) |
| Single Unit, Attached | 97 (73.5%) | 35 (26.5%) |
| 2 Unit Apartments | 0 (0.0%) | 0 (0.0%) |
| 3 or 4 Unit Apartments | 0 (0.0%) | 210 (100.0%) |
| 5 to 9 Unit Apartments | 0 (0.0%) | 52 (100.0%) |
| 10 or more Apartments | 0 (0.0%) | 289 (100.0%) |
| Mobile Home / Other | 115 (94.3%) | 7 (5.7%) |
| Total | 687 (50.5%) | 674 (49.5%) |
Housing Structures by Number of Rooms in North Sioux City
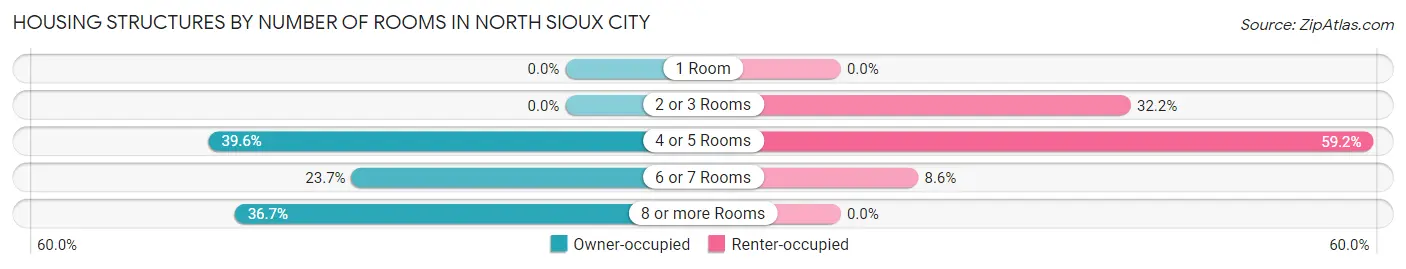
| Number of Rooms | Owner-occupied | Renter-occupied |
| 1 Room | 0 (0.0%) | 0 (0.0%) |
| 2 or 3 Rooms | 0 (0.0%) | 217 (32.2%) |
| 4 or 5 Rooms | 272 (39.6%) | 399 (59.2%) |
| 6 or 7 Rooms | 163 (23.7%) | 58 (8.6%) |
| 8 or more Rooms | 252 (36.7%) | 0 (0.0%) |
| Total | 687 (100.0%) | 674 (100.0%) |
Housing Structure by Heating Type in North Sioux City
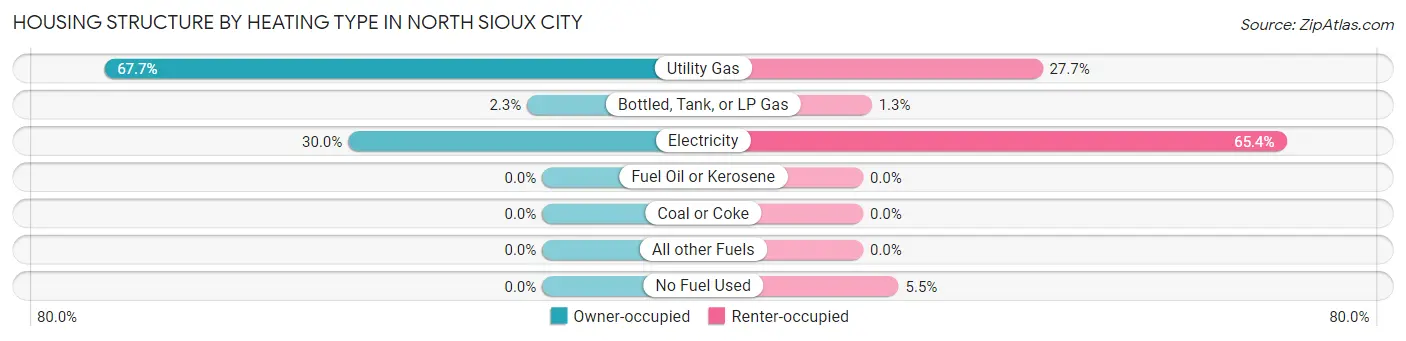
| Heating Type | Owner-occupied | Renter-occupied |
| Utility Gas | 465 (67.7%) | 187 (27.7%) |
| Bottled, Tank, or LP Gas | 16 (2.3%) | 9 (1.3%) |
| Electricity | 206 (30.0%) | 441 (65.4%) |
| Fuel Oil or Kerosene | 0 (0.0%) | 0 (0.0%) |
| Coal or Coke | 0 (0.0%) | 0 (0.0%) |
| All other Fuels | 0 (0.0%) | 0 (0.0%) |
| No Fuel Used | 0 (0.0%) | 37 (5.5%) |
| Total | 687 (100.0%) | 674 (100.0%) |
Household Vehicle Usage in North Sioux City
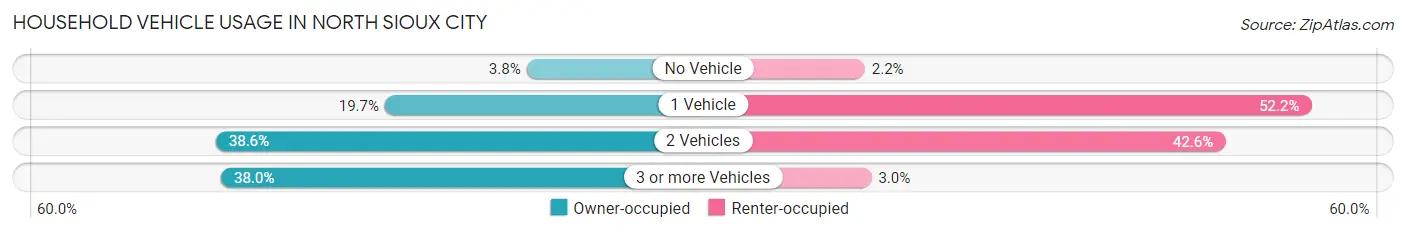
| Vehicles per Household | Owner-occupied | Renter-occupied |
| No Vehicle | 26 (3.8%) | 15 (2.2%) |
| 1 Vehicle | 135 (19.7%) | 352 (52.2%) |
| 2 Vehicles | 265 (38.6%) | 287 (42.6%) |
| 3 or more Vehicles | 261 (38.0%) | 20 (3.0%) |
| Total | 687 (100.0%) | 674 (100.0%) |
Real Estate & Mortgages in North Sioux City
Real Estate and Mortgage Overview in North Sioux City
| Characteristic | Without Mortgage | With Mortgage |
| Housing Units | 277 | 410 |
| Median Property Value | $134,500 | $225,000 |
| Median Household Income | $79,583 | $106 |
| Monthly Housing Costs | $588 | $11 |
| Real Estate Taxes | $2,108 | $0 |
Property Value by Mortgage Status in North Sioux City
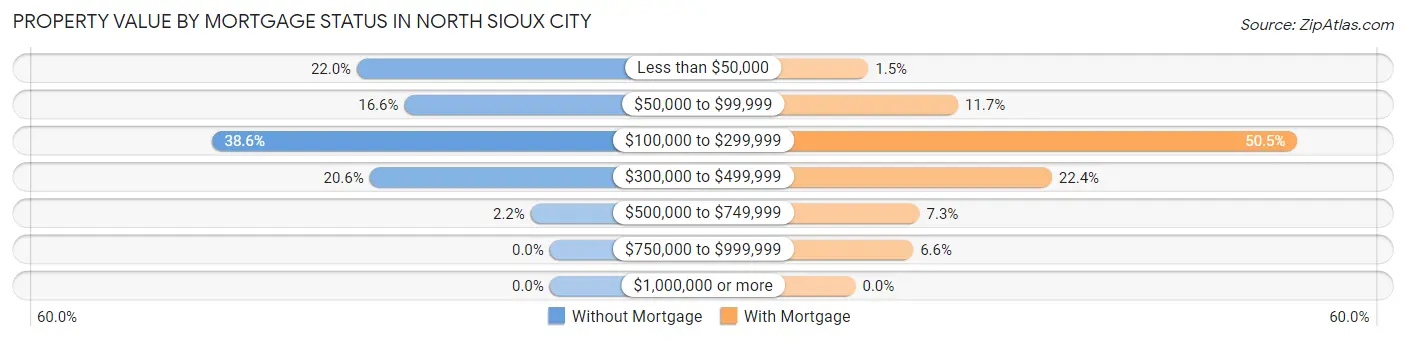
| Property Value | Without Mortgage | With Mortgage |
| Less than $50,000 | 61 (22.0%) | 6 (1.5%) |
| $50,000 to $99,999 | 46 (16.6%) | 48 (11.7%) |
| $100,000 to $299,999 | 107 (38.6%) | 207 (50.5%) |
| $300,000 to $499,999 | 57 (20.6%) | 92 (22.4%) |
| $500,000 to $749,999 | 6 (2.2%) | 30 (7.3%) |
| $750,000 to $999,999 | 0 (0.0%) | 27 (6.6%) |
| $1,000,000 or more | 0 (0.0%) | 0 (0.0%) |
| Total | 277 (100.0%) | 410 (100.0%) |
Household Income by Mortgage Status in North Sioux City
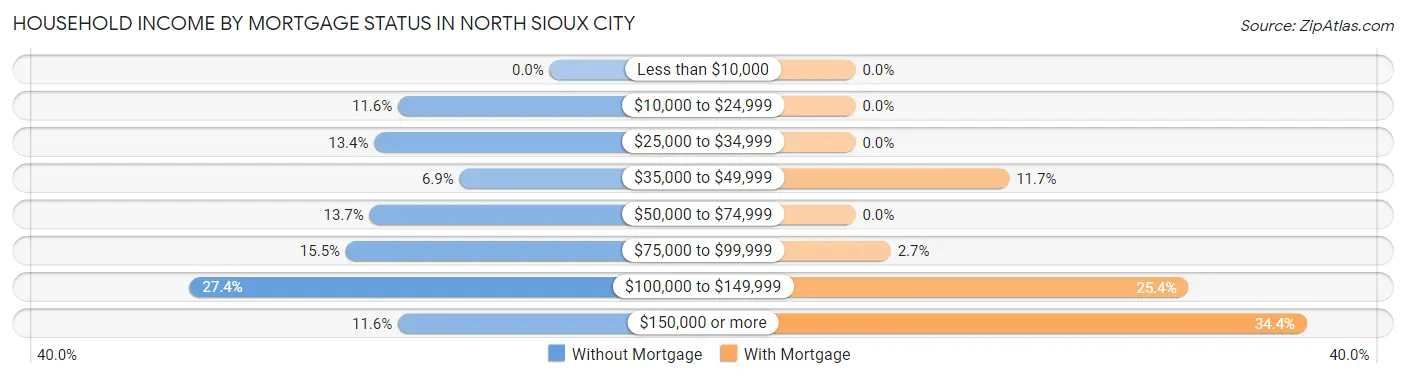
| Household Income | Without Mortgage | With Mortgage |
| Less than $10,000 | 0 (0.0%) | 0 (0.0%) |
| $10,000 to $24,999 | 32 (11.6%) | 0 (0.0%) |
| $25,000 to $34,999 | 37 (13.4%) | 0 (0.0%) |
| $35,000 to $49,999 | 19 (6.9%) | 48 (11.7%) |
| $50,000 to $74,999 | 38 (13.7%) | 0 (0.0%) |
| $75,000 to $99,999 | 43 (15.5%) | 11 (2.7%) |
| $100,000 to $149,999 | 76 (27.4%) | 104 (25.4%) |
| $150,000 or more | 32 (11.6%) | 141 (34.4%) |
| Total | 277 (100.0%) | 410 (100.0%) |
Property Value to Household Income Ratio in North Sioux City
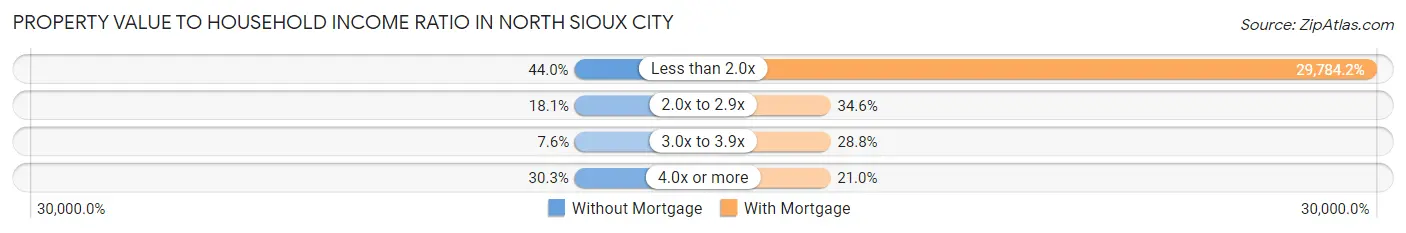
| Value-to-Income Ratio | Without Mortgage | With Mortgage |
| Less than 2.0x | 122 (44.0%) | 122,115 (29,784.1%) |
| 2.0x to 2.9x | 50 (18.0%) | 142 (34.6%) |
| 3.0x to 3.9x | 21 (7.6%) | 118 (28.8%) |
| 4.0x or more | 84 (30.3%) | 86 (21.0%) |
| Total | 277 (100.0%) | 410 (100.0%) |
Real Estate Taxes by Mortgage Status in North Sioux City
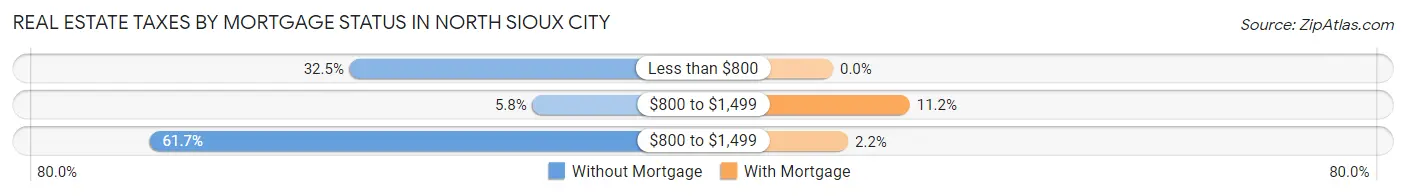
| Property Taxes | Without Mortgage | With Mortgage |
| Less than $800 | 90 (32.5%) | 0 (0.0%) |
| $800 to $1,499 | 16 (5.8%) | 46 (11.2%) |
| $800 to $1,499 | 171 (61.7%) | 9 (2.2%) |
| Total | 277 (100.0%) | 410 (100.0%) |
Health & Disability in North Sioux City
Health Insurance Coverage by Age in North Sioux City
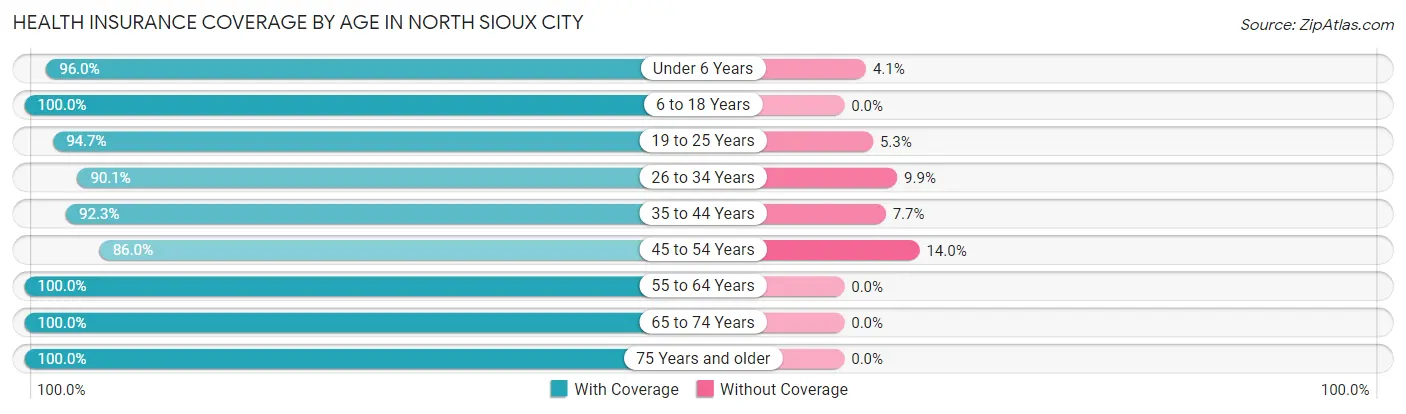
| Age Bracket | With Coverage | Without Coverage |
| Under 6 Years | 213 (96.0%) | 9 (4.1%) |
| 6 to 18 Years | 494 (100.0%) | 0 (0.0%) |
| 19 to 25 Years | 390 (94.7%) | 22 (5.3%) |
| 26 to 34 Years | 393 (90.1%) | 43 (9.9%) |
| 35 to 44 Years | 191 (92.3%) | 16 (7.7%) |
| 45 to 54 Years | 282 (86.0%) | 46 (14.0%) |
| 55 to 64 Years | 400 (100.0%) | 0 (0.0%) |
| 65 to 74 Years | 359 (100.0%) | 0 (0.0%) |
| 75 Years and older | 126 (100.0%) | 0 (0.0%) |
| Total | 2,848 (95.4%) | 136 (4.6%) |
Health Insurance Coverage by Citizenship Status in North Sioux City
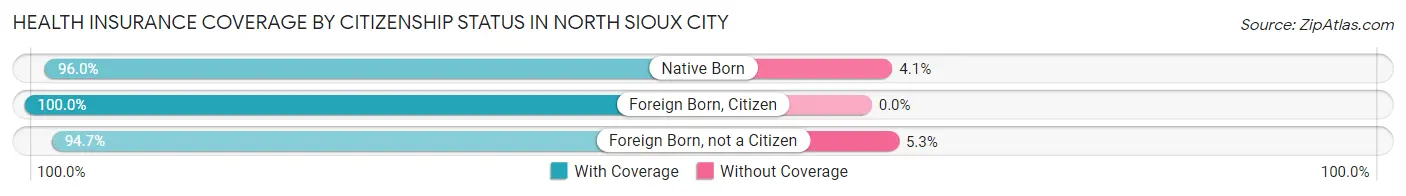
| Citizenship Status | With Coverage | Without Coverage |
| Native Born | 213 (96.0%) | 9 (4.1%) |
| Foreign Born, Citizen | 494 (100.0%) | 0 (0.0%) |
| Foreign Born, not a Citizen | 390 (94.7%) | 22 (5.3%) |
Health Insurance Coverage by Household Income in North Sioux City
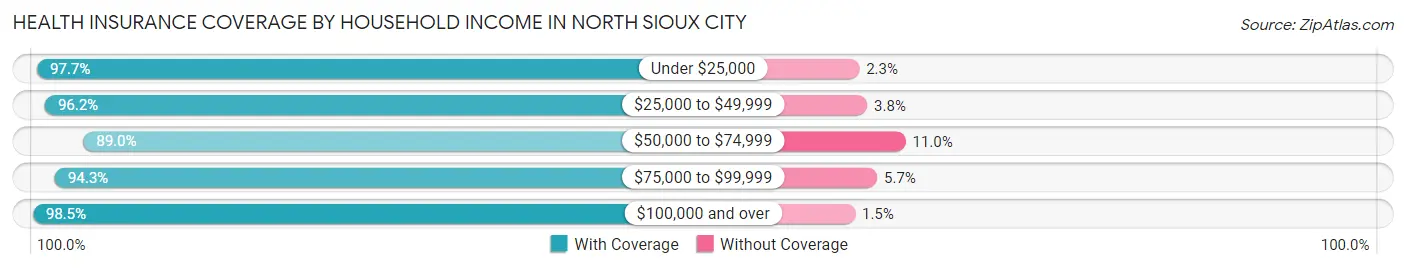
| Household Income | With Coverage | Without Coverage |
| Under $25,000 | 378 (97.7%) | 9 (2.3%) |
| $25,000 to $49,999 | 403 (96.2%) | 16 (3.8%) |
| $50,000 to $74,999 | 550 (89.0%) | 68 (11.0%) |
| $75,000 to $99,999 | 432 (94.3%) | 26 (5.7%) |
| $100,000 and over | 1,085 (98.5%) | 17 (1.5%) |
Public vs Private Health Insurance Coverage by Age in North Sioux City
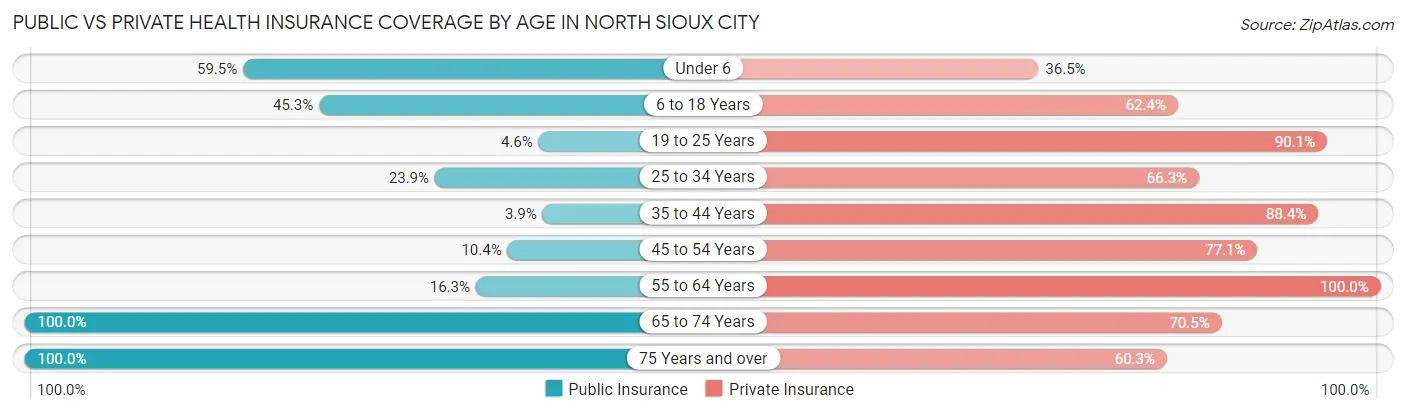
| Age Bracket | Public Insurance | Private Insurance |
| Under 6 | 132 (59.5%) | 81 (36.5%) |
| 6 to 18 Years | 224 (45.3%) | 308 (62.4%) |
| 19 to 25 Years | 19 (4.6%) | 371 (90.0%) |
| 25 to 34 Years | 104 (23.8%) | 289 (66.3%) |
| 35 to 44 Years | 8 (3.9%) | 183 (88.4%) |
| 45 to 54 Years | 34 (10.4%) | 253 (77.1%) |
| 55 to 64 Years | 65 (16.3%) | 400 (100.0%) |
| 65 to 74 Years | 359 (100.0%) | 253 (70.5%) |
| 75 Years and over | 126 (100.0%) | 76 (60.3%) |
| Total | 1,071 (35.9%) | 2,214 (74.2%) |
Disability Status by Sex by Age in North Sioux City
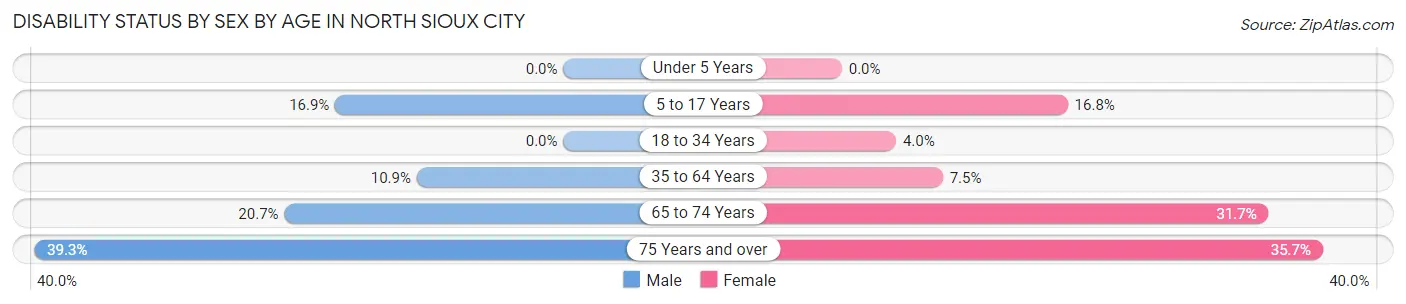
| Age Bracket | Male | Female |
| Under 5 Years | 0 (0.0%) | 0 (0.0%) |
| 5 to 17 Years | 31 (16.9%) | 52 (16.8%) |
| 18 to 34 Years | 0 (0.0%) | 20 (4.0%) |
| 35 to 64 Years | 48 (10.9%) | 37 (7.5%) |
| 65 to 74 Years | 41 (20.7%) | 51 (31.7%) |
| 75 Years and over | 11 (39.3%) | 35 (35.7%) |
Disability Class by Sex by Age in North Sioux City
Disability Class: Hearing Difficulty
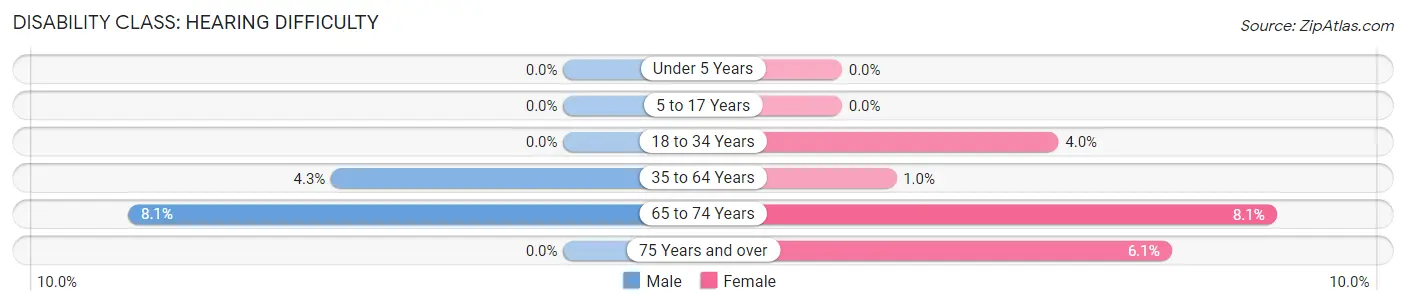
| Age Bracket | Male | Female |
| Under 5 Years | 0 (0.0%) | 0 (0.0%) |
| 5 to 17 Years | 0 (0.0%) | 0 (0.0%) |
| 18 to 34 Years | 0 (0.0%) | 20 (4.0%) |
| 35 to 64 Years | 19 (4.3%) | 5 (1.0%) |
| 65 to 74 Years | 16 (8.1%) | 13 (8.1%) |
| 75 Years and over | 0 (0.0%) | 6 (6.1%) |
Disability Class: Vision Difficulty
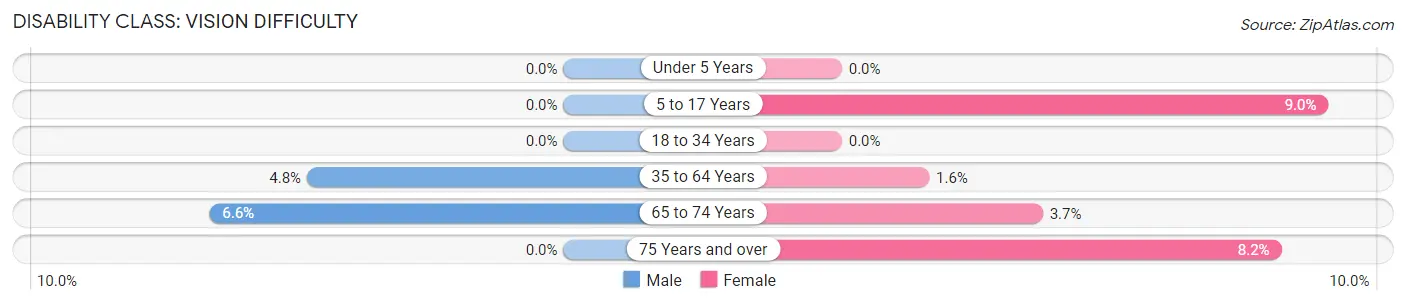
| Age Bracket | Male | Female |
| Under 5 Years | 0 (0.0%) | 0 (0.0%) |
| 5 to 17 Years | 0 (0.0%) | 28 (9.0%) |
| 18 to 34 Years | 0 (0.0%) | 0 (0.0%) |
| 35 to 64 Years | 21 (4.8%) | 8 (1.6%) |
| 65 to 74 Years | 13 (6.6%) | 6 (3.7%) |
| 75 Years and over | 0 (0.0%) | 8 (8.2%) |
Disability Class: Cognitive Difficulty
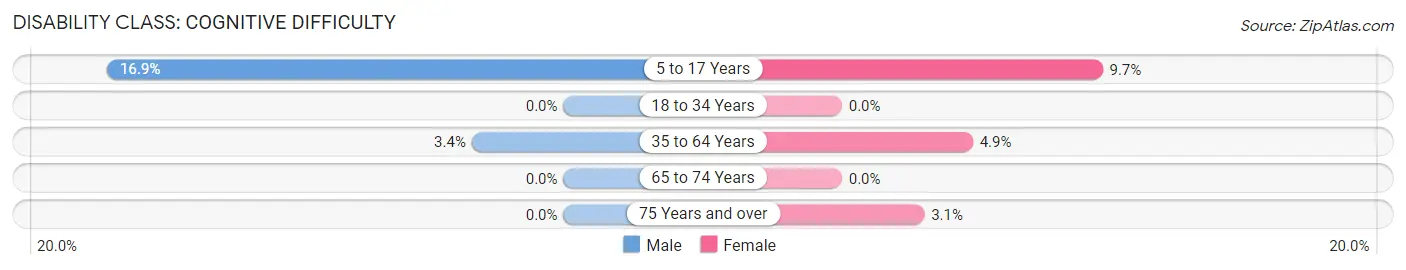
| Age Bracket | Male | Female |
| 5 to 17 Years | 31 (16.9%) | 30 (9.7%) |
| 18 to 34 Years | 0 (0.0%) | 0 (0.0%) |
| 35 to 64 Years | 15 (3.4%) | 24 (4.9%) |
| 65 to 74 Years | 0 (0.0%) | 0 (0.0%) |
| 75 Years and over | 0 (0.0%) | 3 (3.1%) |
Disability Class: Ambulatory Difficulty
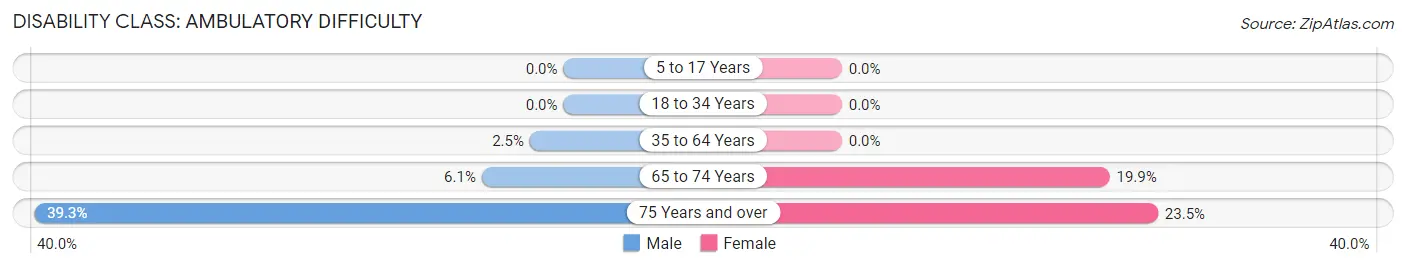
| Age Bracket | Male | Female |
| 5 to 17 Years | 0 (0.0%) | 0 (0.0%) |
| 18 to 34 Years | 0 (0.0%) | 0 (0.0%) |
| 35 to 64 Years | 11 (2.5%) | 0 (0.0%) |
| 65 to 74 Years | 12 (6.1%) | 32 (19.9%) |
| 75 Years and over | 11 (39.3%) | 23 (23.5%) |
Disability Class: Self-Care Difficulty
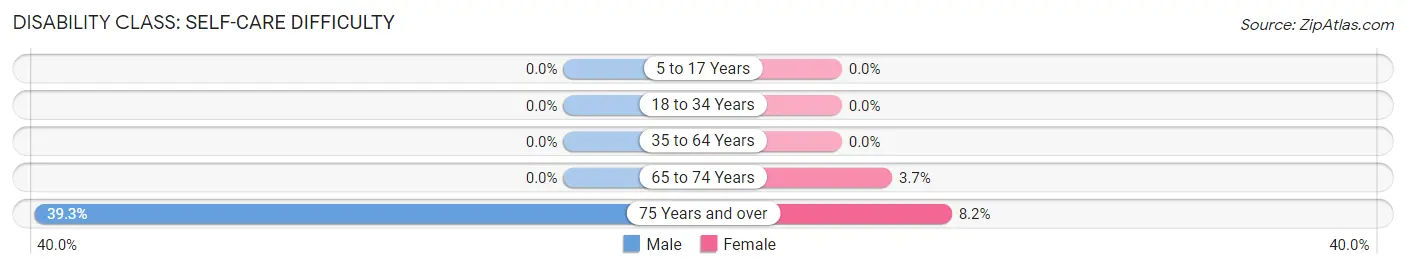
| Age Bracket | Male | Female |
| 5 to 17 Years | 0 (0.0%) | 0 (0.0%) |
| 18 to 34 Years | 0 (0.0%) | 0 (0.0%) |
| 35 to 64 Years | 0 (0.0%) | 0 (0.0%) |
| 65 to 74 Years | 0 (0.0%) | 6 (3.7%) |
| 75 Years and over | 11 (39.3%) | 8 (8.2%) |
Technology Access in North Sioux City
Computing Device Access in North Sioux City
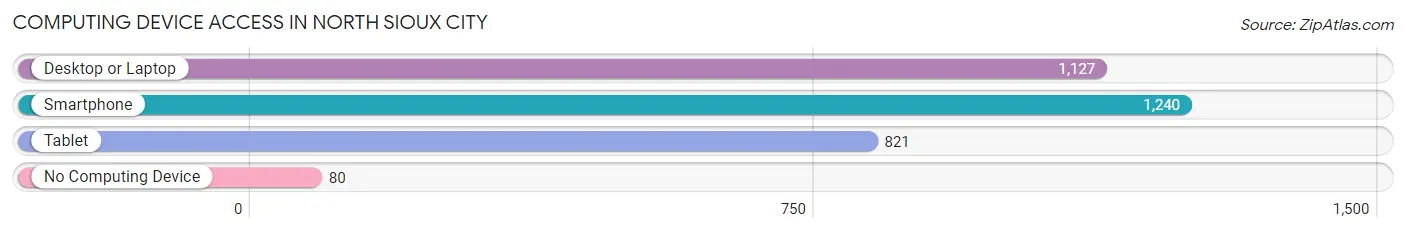
| Device Type | # Households | % Households |
| Desktop or Laptop | 1,127 | 82.8% |
| Smartphone | 1,240 | 91.1% |
| Tablet | 821 | 60.3% |
| No Computing Device | 80 | 5.9% |
| Total | 1,361 | 100.0% |
Internet Access in North Sioux City
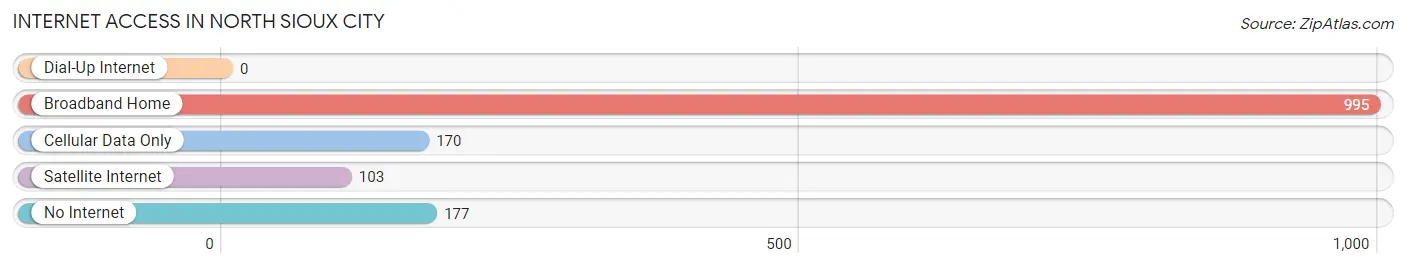
| Internet Type | # Households | % Households |
| Dial-Up Internet | 0 | 0.0% |
| Broadband Home | 995 | 73.1% |
| Cellular Data Only | 170 | 12.5% |
| Satellite Internet | 103 | 7.6% |
| No Internet | 177 | 13.0% |
| Total | 1,361 | 100.0% |
North Sioux City Summary
History
North Sioux City is a city located in Union County, South Dakota, United States. It is situated on the Missouri River, just across the state line from Sioux City, Iowa. The city was founded in 1867 by a group of settlers from Sioux City, Iowa, who were looking for a place to settle on the Missouri River. The city was originally known as "Sioux City North" and was incorporated in 1887.
The city was originally a farming community, but in the early 1900s, it began to develop into an industrial center. The city was home to several factories, including a flour mill, a brickyard, a canning factory, and a meat packing plant. The city also had a large lumber yard and a railroad depot.
In the 1950s, the city began to experience a population boom, as many people moved to the area to take advantage of the city's industrial opportunities. The city's population grew from 1,500 in 1950 to over 5,000 by the end of the decade.
In the 1960s, the city began to experience a decline in its industrial base, as many of the factories closed or moved away. The city's population also began to decline, as people moved away in search of better job opportunities.
In the 1970s, the city began to experience a resurgence, as new businesses moved into the area and the population began to grow again. The city's population grew to over 8,000 by the end of the decade.
Today, North Sioux City is a thriving community with a population of over 10,000. The city is home to several businesses, including a casino, a shopping mall, and a variety of restaurants and bars. The city is also home to a number of parks and recreational facilities, including a golf course, a swimming pool, and a skate park.
Geography
North Sioux City is located in Union County, South Dakota, on the Missouri River. The city is situated on the eastern bank of the river, just across the state line from Sioux City, Iowa. The city is located in the Central Plains region of the United States, and is part of the Sioux City metropolitan area.
The city has a total area of 4.2 square miles, all of which is land. The city is located at an elevation of 1,072 feet above sea level.
Economy
North Sioux City is a thriving community with a diverse economy. The city is home to several businesses, including a casino, a shopping mall, and a variety of restaurants and bars. The city is also home to a number of parks and recreational facilities, including a golf course, a swimming pool, and a skate park.
The city is also home to several manufacturing and industrial businesses, including a flour mill, a brickyard, a canning factory, and a meat packing plant. The city is also home to a number of retail stores, including a grocery store, a hardware store, and a variety of other shops.
Demographics
As of the 2010 census, North Sioux City had a population of 10,087. The racial makeup of the city was 92.2% White, 0.7% African American, 0.3% Native American, 0.7% Asian, 0.1% Pacific Islander, 4.2% from other races, and 1.9% from two or more races. Hispanic or Latino of any race were 8.2% of the population.
The median income for a household in the city was $45,938, and the median income for a family was $51,938. The per capita income for the city was $20,938. About 8.2% of families and 10.2% of the population were below the poverty line, including 14.2% of those under age 18 and 6.2% of those age 65 or over.
Common Questions
What is the Total Population of North Sioux City?
Total Population of North Sioux City is 2,984.
What is the Total Male Population of North Sioux City?
Total Male Population of North Sioux City is 1,348.
What is the Total Female Population of North Sioux City?
Total Female Population of North Sioux City is 1,636.
What is the Ratio of Males per 100 Females in North Sioux City?
There are 82.40 Males per 100 Females in North Sioux City.
What is the Ratio of Females per 100 Males in North Sioux City?
There are 121.36 Females per 100 Males in North Sioux City.
What is the Median Population Age in North Sioux City?
Median Population Age in North Sioux City is 33.5 Years.
What is the Average Family Size in North Sioux City
Average Family Size in North Sioux City is 2.6 People.
What is the Average Household Size in North Sioux City
Average Household Size in North Sioux City is 2.2 People.
What is Per Capita Income in North Sioux City?
Per Capita income in North Sioux City is $39,217.
What is the Median Family Income in North Sioux City?
Median Family Income in North Sioux City is $92,862.
What is the Median Household income in North Sioux City?
Median Household Income in North Sioux City is $62,284.
What is Income or Wage Gap in North Sioux City?
Income or Wage Gap in North Sioux City is 35.0%.
Women in North Sioux City earn 65.0 cents for every dollar earned by a man.
What is Family Income Deficit in North Sioux City?
Family Income Deficit in North Sioux City is $6,806.
Families that are below poverty line in North Sioux City earn $6,806 less on average than the poverty threshold level.
What is Inequality or Gini Index in North Sioux City?
Inequality or Gini Index in North Sioux City is 0.45.
How Large is the Labor Force in North Sioux City?
There are 1,648 People in the Labor Forcein in North Sioux City.
What is the Percentage of People in the Labor Force in North Sioux City?
69.5% of People are in the Labor Force in North Sioux City.
What is the Unemployment Rate in North Sioux City?
Unemployment Rate in North Sioux City is 5.2%.