Hot Springs, SD
Hot Springs Map
Hot Springs Overview
3,465
TOTAL POPULATION
1,727
MALE POPULATION
1,738
FEMALE POPULATION
99.37
MALES / 100 FEMALES
100.64
FEMALES / 100 MALES
56.3
MEDIAN AGE
2.6
AVG FAMILY SIZE
1.9
AVG HOUSEHOLD SIZE
$33,368
PER CAPITA INCOME
$60,972
AVG FAMILY INCOME
$47,337
AVG HOUSEHOLD INCOME
38.3%
WAGE / INCOME GAP [ % ]
61.7¢/ $1
WAGE / INCOME GAP [ $ ]
$8,896
FAMILY INCOME DEFICIT
0.47
INEQUALITY / GINI INDEX
1,552
LABOR FORCE [ PEOPLE ]
50.7%
PERCENT IN LABOR FORCE
3.1%
UNEMPLOYMENT RATE
Hot Springs Zip Codes
Hot Springs Area Codes
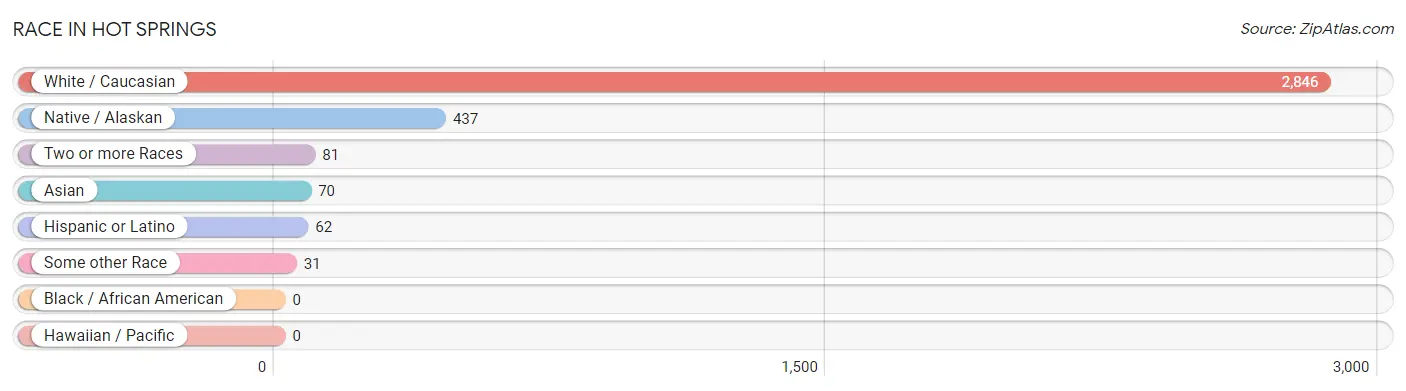
Race in Hot Springs
The most populous races in Hot Springs are White / Caucasian (2,846 | 82.1%), Native / Alaskan (437 | 12.6%), and Two or more Races (81 | 2.3%).
| Race | # Population | % Population |
| Asian | 70 | 2.0% |
| Black / African American | 0 | 0.0% |
| Hawaiian / Pacific | 0 | 0.0% |
| Hispanic or Latino | 62 | 1.8% |
| Native / Alaskan | 437 | 12.6% |
| White / Caucasian | 2,846 | 82.1% |
| Two or more Races | 81 | 2.3% |
| Some other Race | 31 | 0.9% |
| Total | 3,465 | 100.0% |
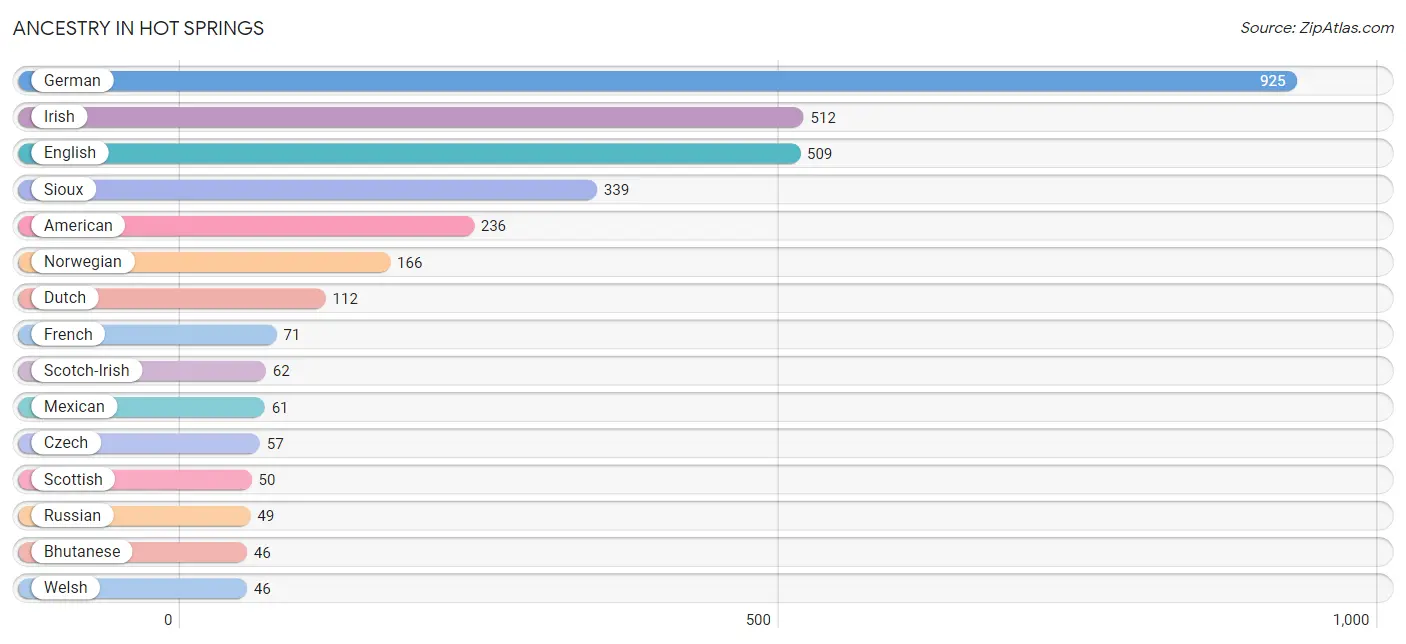
Ancestry in Hot Springs
The most populous ancestries reported in Hot Springs are German (925 | 26.7%), Irish (512 | 14.8%), English (509 | 14.7%), Sioux (339 | 9.8%), and American (236 | 6.8%), together accounting for 72.8% of all Hot Springs residents.
| Ancestry | # Population | % Population |
| American | 236 | 6.8% |
| Austrian | 22 | 0.6% |
| Bhutanese | 46 | 1.3% |
| British | 18 | 0.5% |
| Czech | 57 | 1.7% |
| Czechoslovakian | 9 | 0.3% |
| Danish | 21 | 0.6% |
| Dutch | 112 | 3.2% |
| English | 509 | 14.7% |
| French | 71 | 2.1% |
| French Canadian | 10 | 0.3% |
| German | 925 | 26.7% |
| Indian (Asian) | 16 | 0.5% |
| Irish | 512 | 14.8% |
| Italian | 16 | 0.5% |
| Mexican | 61 | 1.8% |
| Mexican American Indian | 30 | 0.9% |
| Northern European | 7 | 0.2% |
| Norwegian | 166 | 4.8% |
| Pennsylvania German | 34 | 1.0% |
| Polish | 28 | 0.8% |
| Portuguese | 19 | 0.5% |
| Puerto Rican | 1 | 0.0% |
| Russian | 49 | 1.4% |
| Scandinavian | 13 | 0.4% |
| Scotch-Irish | 62 | 1.8% |
| Scottish | 50 | 1.4% |
| Sioux | 339 | 9.8% |
| Swedish | 33 | 0.9% |
| Thai | 8 | 0.2% |
| Welsh | 46 | 1.3% | View All 31 Rows |
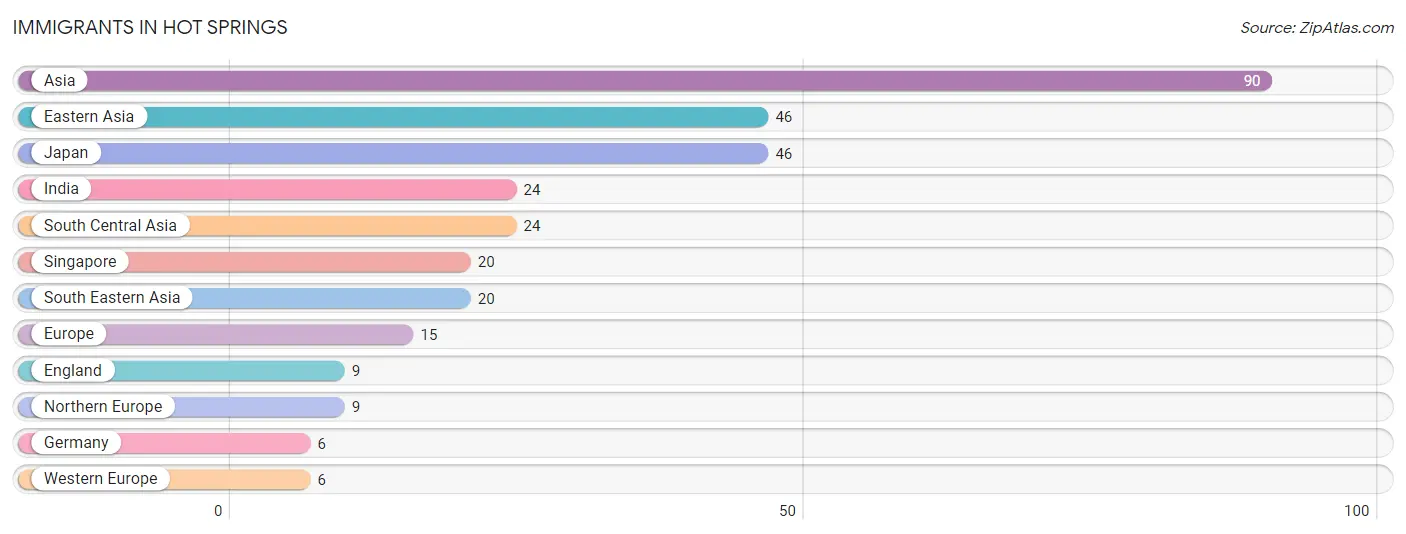
Immigrants in Hot Springs
The most numerous immigrant groups reported in Hot Springs came from Asia (90 | 2.6%), Eastern Asia (46 | 1.3%), Japan (46 | 1.3%), India (24 | 0.7%), and South Central Asia (24 | 0.7%), together accounting for 6.6% of all Hot Springs residents.
| Immigration Origin | # Population | % Population |
| Asia | 90 | 2.6% |
| Eastern Asia | 46 | 1.3% |
| England | 9 | 0.3% |
| Europe | 15 | 0.4% |
| Germany | 6 | 0.2% |
| India | 24 | 0.7% |
| Japan | 46 | 1.3% |
| Northern Europe | 9 | 0.3% |
| Singapore | 20 | 0.6% |
| South Central Asia | 24 | 0.7% |
| South Eastern Asia | 20 | 0.6% |
| Western Europe | 6 | 0.2% | View All 12 Rows |
Sex and Age in Hot Springs
Sex and Age in Hot Springs
The most populous age groups in Hot Springs are 60 to 64 Years (158 | 9.1%) for men and 70 to 74 Years (222 | 12.8%) for women.
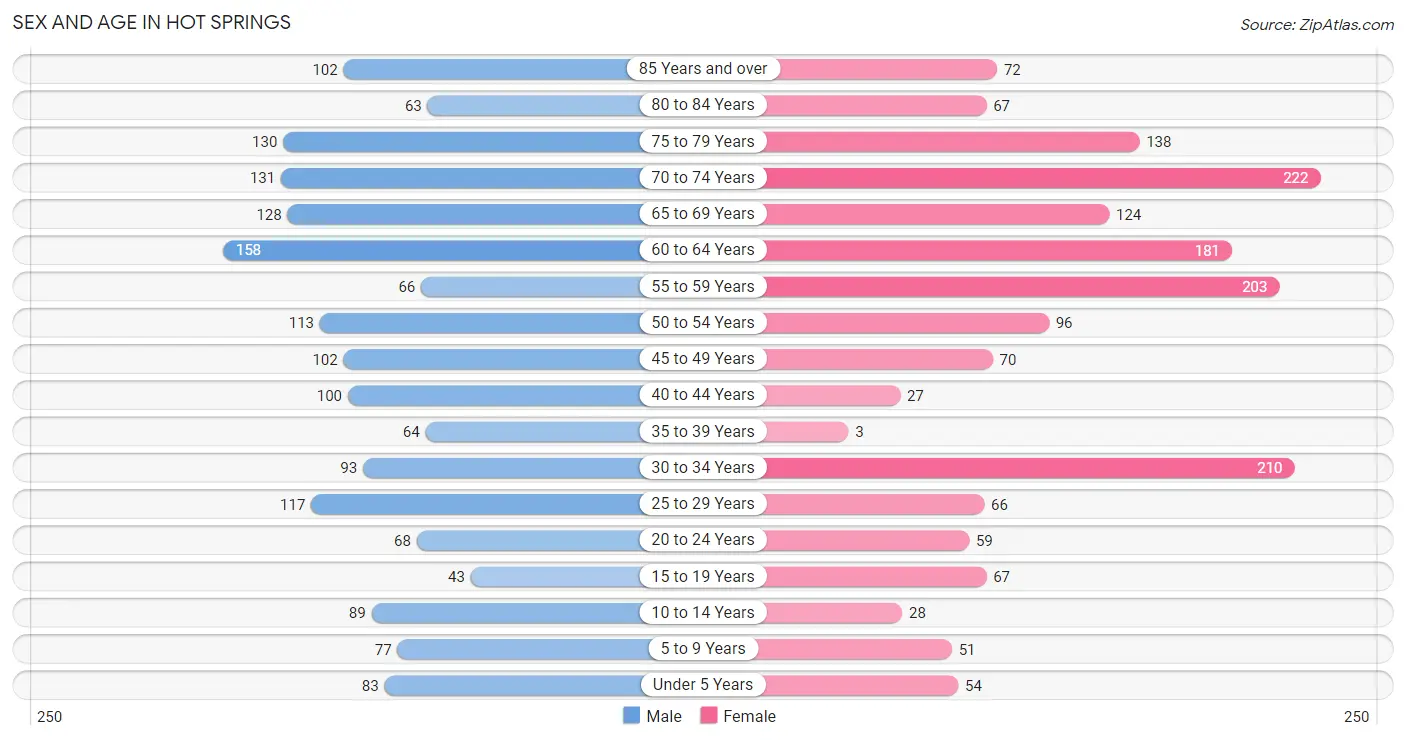
| Age Bracket | Male | Female |
| Under 5 Years | 83 (4.8%) | 54 (3.1%) |
| 5 to 9 Years | 77 (4.5%) | 51 (2.9%) |
| 10 to 14 Years | 89 (5.1%) | 28 (1.6%) |
| 15 to 19 Years | 43 (2.5%) | 67 (3.9%) |
| 20 to 24 Years | 68 (3.9%) | 59 (3.4%) |
| 25 to 29 Years | 117 (6.8%) | 66 (3.8%) |
| 30 to 34 Years | 93 (5.4%) | 210 (12.1%) |
| 35 to 39 Years | 64 (3.7%) | 3 (0.2%) |
| 40 to 44 Years | 100 (5.8%) | 27 (1.5%) |
| 45 to 49 Years | 102 (5.9%) | 70 (4.0%) |
| 50 to 54 Years | 113 (6.5%) | 96 (5.5%) |
| 55 to 59 Years | 66 (3.8%) | 203 (11.7%) |
| 60 to 64 Years | 158 (9.1%) | 181 (10.4%) |
| 65 to 69 Years | 128 (7.4%) | 124 (7.1%) |
| 70 to 74 Years | 131 (7.6%) | 222 (12.8%) |
| 75 to 79 Years | 130 (7.5%) | 138 (7.9%) |
| 80 to 84 Years | 63 (3.6%) | 67 (3.9%) |
| 85 Years and over | 102 (5.9%) | 72 (4.1%) |
| Total | 1,727 (100.0%) | 1,738 (100.0%) |
Families and Households in Hot Springs
Median Family Size in Hot Springs
The median family size in Hot Springs is 2.58 persons per family, with single male/father families (84 | 9.9%) accounting for the largest median family size of 2.8 persons per family. On the other hand, married-couple families (446 | 52.5%) represent the smallest median family size with 2.42 persons per family.
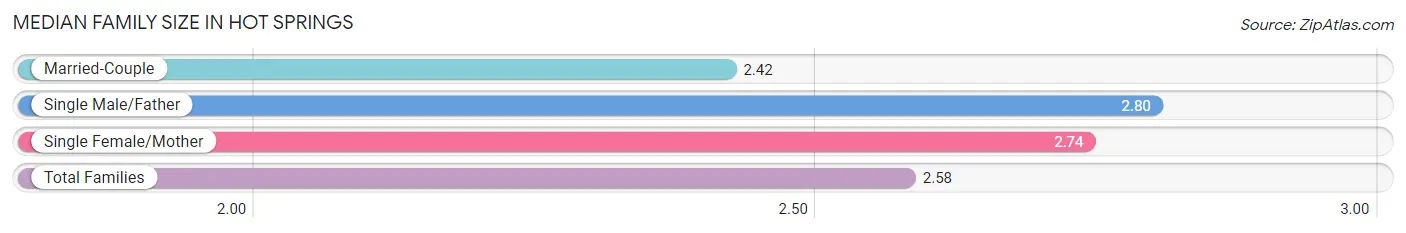
| Family Type | # Families | Family Size |
| Married-Couple | 446 (52.5%) | 2.42 |
| Single Male/Father | 84 (9.9%) | 2.80 |
| Single Female/Mother | 319 (37.6%) | 2.74 |
| Total Families | 849 (100.0%) | 2.58 |
Median Household Size in Hot Springs
The median household size in Hot Springs is 1.88 persons per household, with single female/mother households (319 | 18.8%) accounting for the largest median household size of 2.95 persons per household. non-family households (848 | 50.0%) represent the smallest median household size with 1.09 persons per household.
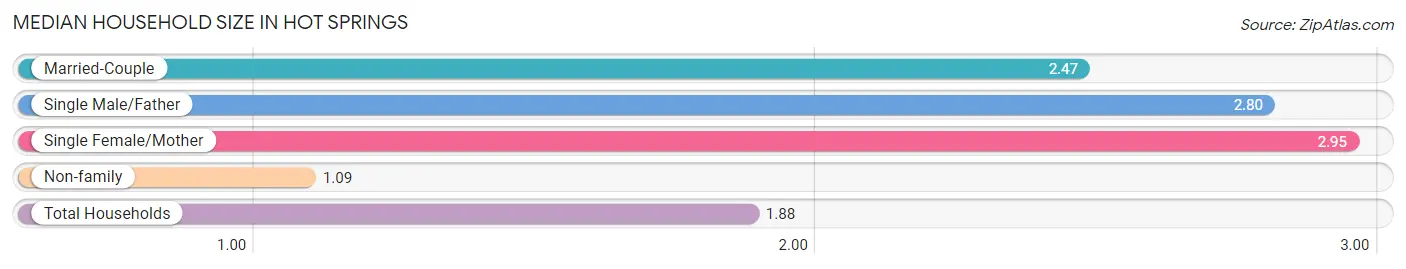
| Household Type | # Households | Household Size |
| Married-Couple | 446 (26.3%) | 2.47 |
| Single Male/Father | 84 (5.0%) | 2.80 |
| Single Female/Mother | 319 (18.8%) | 2.95 |
| Non-family | 848 (50.0%) | 1.09 |
| Total Households | 1,697 (100.0%) | 1.88 |
Household Size by Marriage Status in Hot Springs
Out of a total of 1,697 households in Hot Springs, 849 (50.0%) are family households, while 848 (50.0%) are nonfamily households. The most numerous type of family households are 2-person households, comprising 591, and the most common type of nonfamily households are 1-person households, comprising 765.
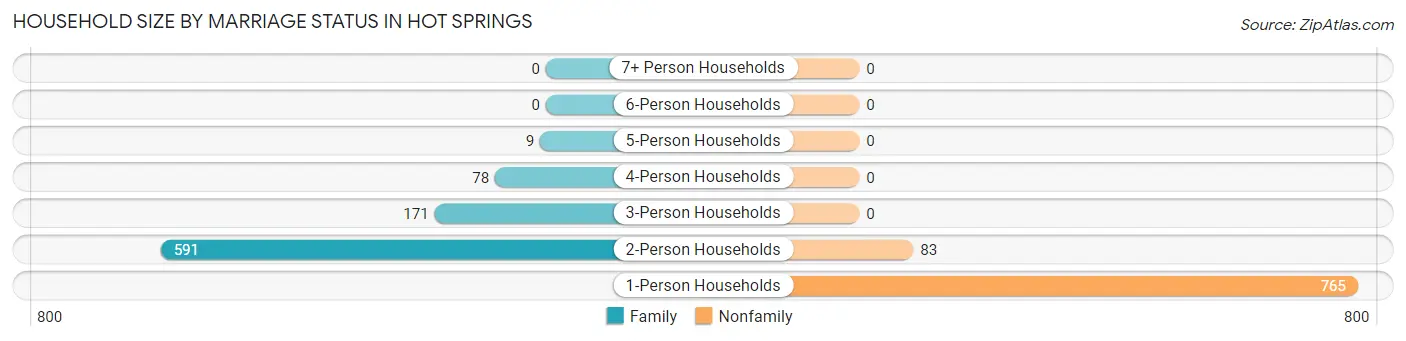
| Household Size | Family Households | Nonfamily Households |
| 1-Person Households | - | 765 (45.1%) |
| 2-Person Households | 591 (34.8%) | 83 (4.9%) |
| 3-Person Households | 171 (10.1%) | 0 (0.0%) |
| 4-Person Households | 78 (4.6%) | 0 (0.0%) |
| 5-Person Households | 9 (0.5%) | 0 (0.0%) |
| 6-Person Households | 0 (0.0%) | 0 (0.0%) |
| 7+ Person Households | 0 (0.0%) | 0 (0.0%) |
| Total | 849 (50.0%) | 848 (50.0%) |
Female Fertility in Hot Springs
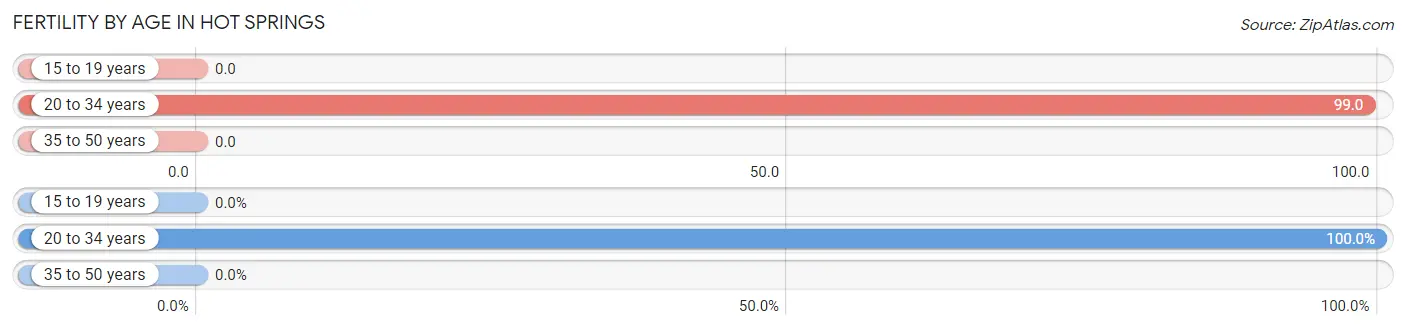
Fertility by Age in Hot Springs
Average fertility rate in Hot Springs is 66.0 births per 1,000 women. Women in the age bracket of 20 to 34 years have the highest fertility rate with 99.0 births per 1,000 women. Women in the age bracket of 20 to 34 years acount for 100.0% of all women with births.
| Age Bracket | Women with Births | Births / 1,000 Women |
| 15 to 19 years | 0 (0.0%) | 0.0 |
| 20 to 34 years | 33 (100.0%) | 99.0 |
| 35 to 50 years | 0 (0.0%) | 0.0 |
| Total | 33 (100.0%) | 66.0 |
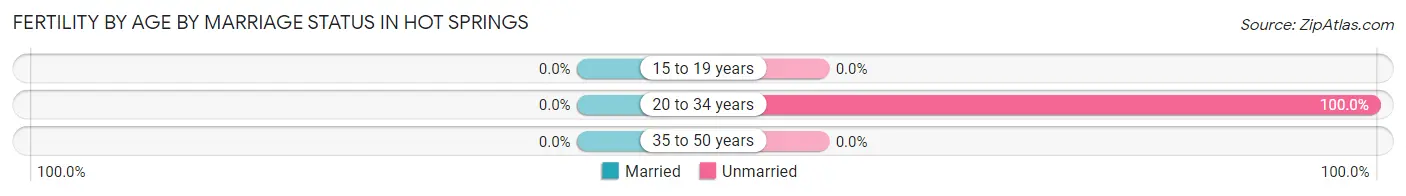
Fertility by Age by Marriage Status in Hot Springs
| Age Bracket | Married | Unmarried |
| 15 to 19 years | 0 (0.0%) | 0 (0.0%) |
| 20 to 34 years | 0 (0.0%) | 33 (100.0%) |
| 35 to 50 years | 0 (0.0%) | 0 (0.0%) |
| Total | 0 (0.0%) | 33 (100.0%) |
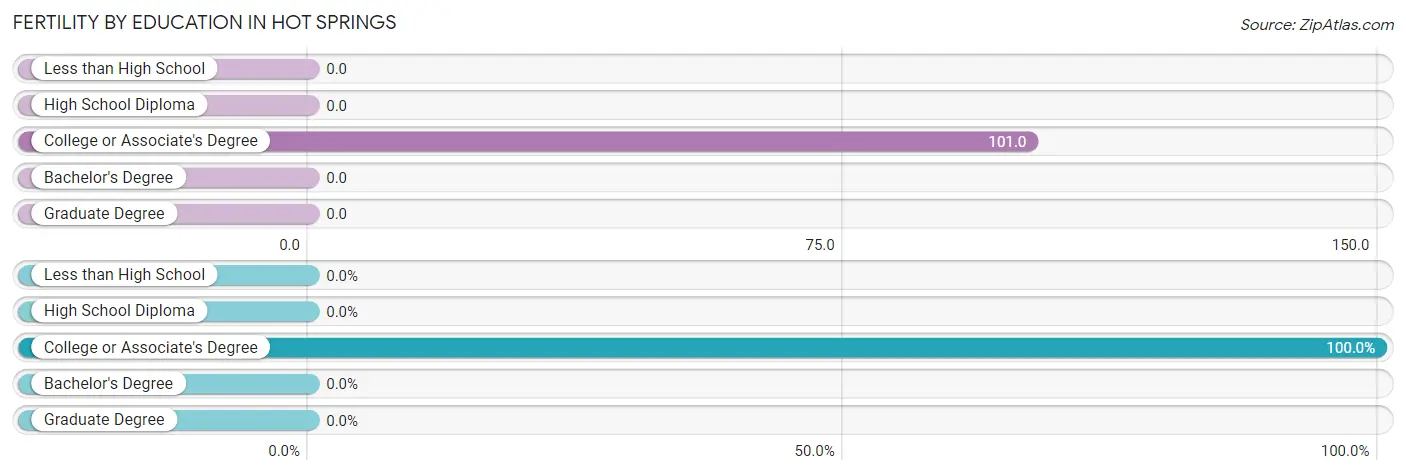
Fertility by Education in Hot Springs
| Educational Attainment | Women with Births | Births / 1,000 Women |
| Less than High School | 0 (0.0%) | 0.0 |
| High School Diploma | 0 (0.0%) | 0.0 |
| College or Associate's Degree | 33 (100.0%) | 101.0 |
| Bachelor's Degree | 0 (0.0%) | 0.0 |
| Graduate Degree | 0 (0.0%) | 0.0 |
| Total | 33 (100.0%) | 66.0 |
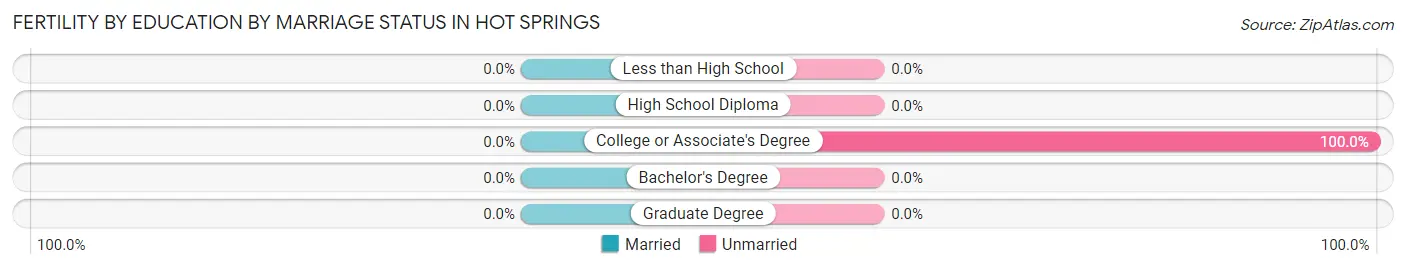
Fertility by Education by Marriage Status in Hot Springs
| Educational Attainment | Married | Unmarried |
| Less than High School | 0 (0.0%) | 0 (0.0%) |
| High School Diploma | 0 (0.0%) | 0 (0.0%) |
| College or Associate's Degree | 0 (0.0%) | 33 (100.0%) |
| Bachelor's Degree | 0 (0.0%) | 0 (0.0%) |
| Graduate Degree | 0 (0.0%) | 0 (0.0%) |
| Total | 0 (0.0%) | 33 (100.0%) |
Income in Hot Springs
Income Overview in Hot Springs
Per Capita Income in Hot Springs is $33,368, while median incomes of families and households are $60,972 and $47,337 respectively.
| Characteristic | Number | Measure |
| Per Capita Income | 3,465 | $33,368 |
| Median Family Income | 849 | $60,972 |
| Mean Family Income | 849 | $66,263 |
| Median Household Income | 1,697 | $47,337 |
| Mean Household Income | 1,697 | $62,744 |
| Income Deficit | 849 | $8,896 |
| Wage / Income Gap (%) | 3,465 | 38.34% |
| Wage / Income Gap ($) | 3,465 | 61.66¢ per $1 |
| Gini / Inequality Index | 3,465 | 0.47 |
Earnings by Sex in Hot Springs
Average Earnings in Hot Springs are $19,769, $28,981 for men and $17,871 for women, a difference of 38.3%.
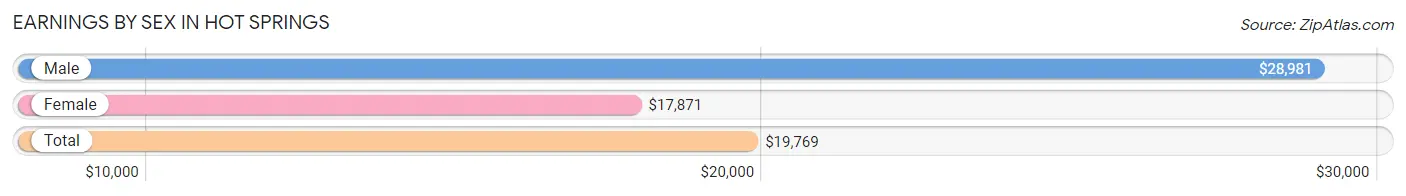
| Sex | Number | Average Earnings |
| Male | 754 (43.8%) | $28,981 |
| Female | 966 (56.2%) | $17,871 |
| Total | 1,720 (100.0%) | $19,769 |
Earnings by Sex by Income Bracket in Hot Springs
The most common earnings brackets in Hot Springs are $40,000 to $44,999 for men (85 | 11.3%) and $12,500 to $14,999 for women (136 | 14.1%).
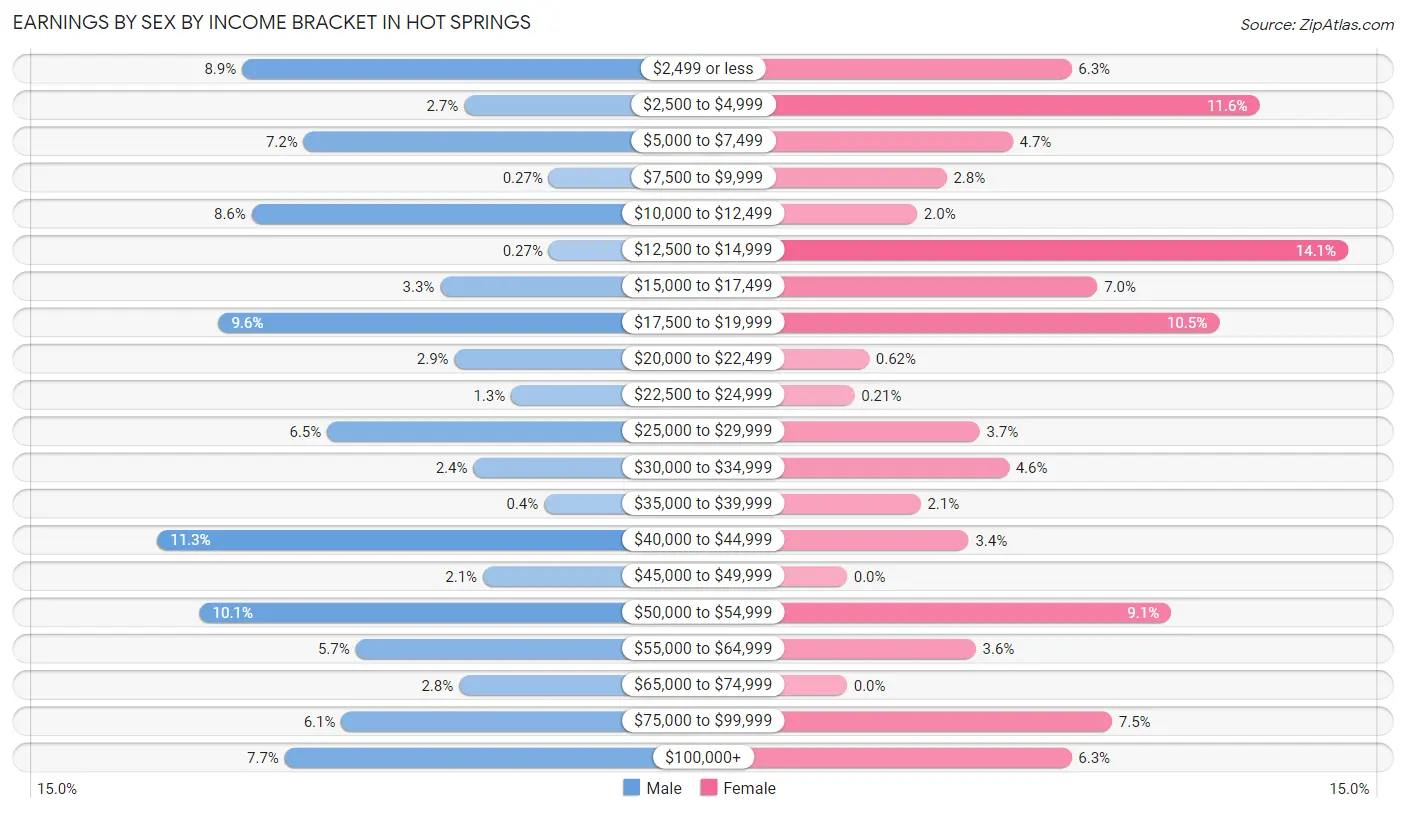
| Income | Male | Female |
| $2,499 or less | 67 (8.9%) | 61 (6.3%) |
| $2,500 to $4,999 | 20 (2.6%) | 112 (11.6%) |
| $5,000 to $7,499 | 54 (7.2%) | 45 (4.7%) |
| $7,500 to $9,999 | 2 (0.3%) | 27 (2.8%) |
| $10,000 to $12,499 | 65 (8.6%) | 19 (2.0%) |
| $12,500 to $14,999 | 2 (0.3%) | 136 (14.1%) |
| $15,000 to $17,499 | 25 (3.3%) | 68 (7.0%) |
| $17,500 to $19,999 | 72 (9.6%) | 101 (10.5%) |
| $20,000 to $22,499 | 22 (2.9%) | 6 (0.6%) |
| $22,500 to $24,999 | 10 (1.3%) | 2 (0.2%) |
| $25,000 to $29,999 | 49 (6.5%) | 36 (3.7%) |
| $30,000 to $34,999 | 18 (2.4%) | 44 (4.5%) |
| $35,000 to $39,999 | 3 (0.4%) | 20 (2.1%) |
| $40,000 to $44,999 | 85 (11.3%) | 33 (3.4%) |
| $45,000 to $49,999 | 16 (2.1%) | 0 (0.0%) |
| $50,000 to $54,999 | 76 (10.1%) | 88 (9.1%) |
| $55,000 to $64,999 | 43 (5.7%) | 35 (3.6%) |
| $65,000 to $74,999 | 21 (2.8%) | 0 (0.0%) |
| $75,000 to $99,999 | 46 (6.1%) | 72 (7.4%) |
| $100,000+ | 58 (7.7%) | 61 (6.3%) |
| Total | 754 (100.0%) | 966 (100.0%) |
Earnings by Sex by Educational Attainment in Hot Springs
Average earnings in Hot Springs are $40,153 for men and $19,158 for women, a difference of 52.3%. Men with an educational attainment of graduate degree enjoy the highest average annual earnings of $213,750, while those with less than high school education earn the least with $40,250. Women with an educational attainment of graduate degree earn the most with the average annual earnings of $113,279, while those with less than high school education have the smallest earnings of $13,526.
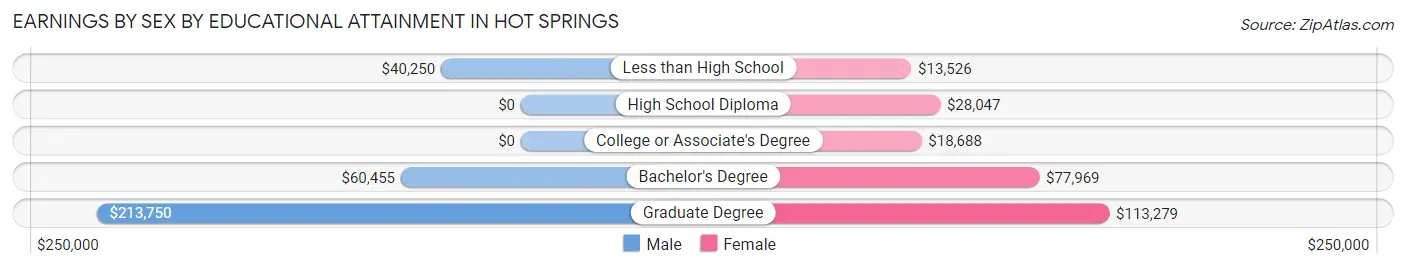
| Educational Attainment | Male Income | Female Income |
| Less than High School | $40,250 | $13,526 |
| High School Diploma | - | - |
| College or Associate's Degree | - | - |
| Bachelor's Degree | $60,455 | $77,969 |
| Graduate Degree | $213,750 | $113,279 |
| Total | $40,153 | $19,158 |
Family Income in Hot Springs
Family Income Brackets in Hot Springs
According to the Hot Springs family income data, there are 159 families falling into the $100,000 to $149,999 income range, which is the most common income bracket and makes up 18.7% of all families.
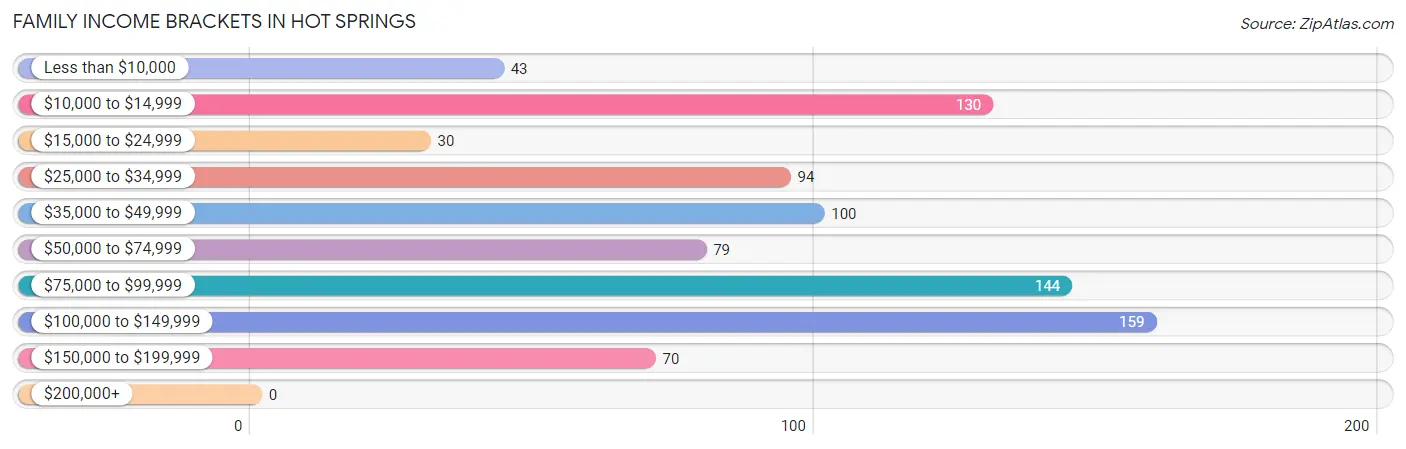
| Income Bracket | # Families | % Families |
| Less than $10,000 | 43 | 5.1% |
| $10,000 to $14,999 | 130 | 15.3% |
| $15,000 to $24,999 | 30 | 3.5% |
| $25,000 to $34,999 | 94 | 11.1% |
| $35,000 to $49,999 | 100 | 11.8% |
| $50,000 to $74,999 | 79 | 9.3% |
| $75,000 to $99,999 | 144 | 17.0% |
| $100,000 to $149,999 | 159 | 18.7% |
| $150,000 to $199,999 | 70 | 8.2% |
| $200,000+ | 0 | 0.0% |
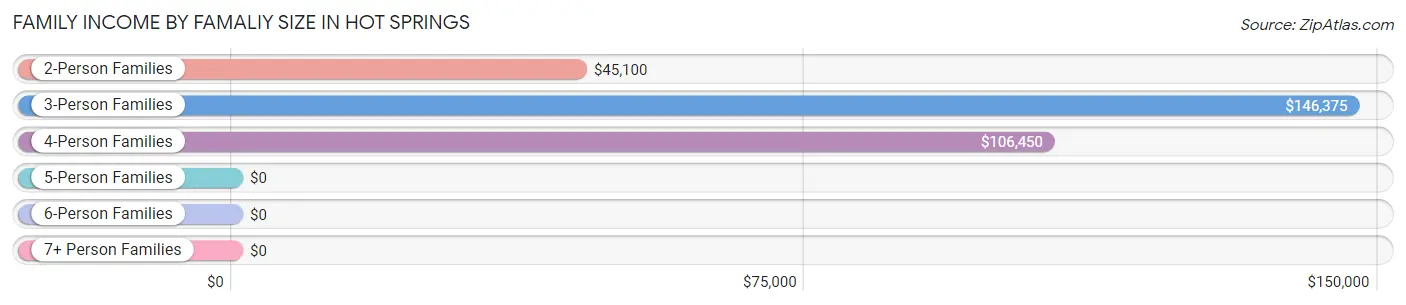
Family Income by Famaliy Size in Hot Springs
3-person families (131 | 15.4%) account for the highest median family income in Hot Springs with $146,375 per family, while 3-person families (131 | 15.4%) have the highest median income of $48,792 per family member.
| Income Bracket | # Families | Median Income |
| 2-Person Families | 644 (75.8%) | $45,100 |
| 3-Person Families | 131 (15.4%) | $146,375 |
| 4-Person Families | 65 (7.7%) | $106,450 |
| 5-Person Families | 9 (1.1%) | $0 |
| 6-Person Families | 0 (0.0%) | $0 |
| 7+ Person Families | 0 (0.0%) | $0 |
| Total | 849 (100.0%) | $60,972 |
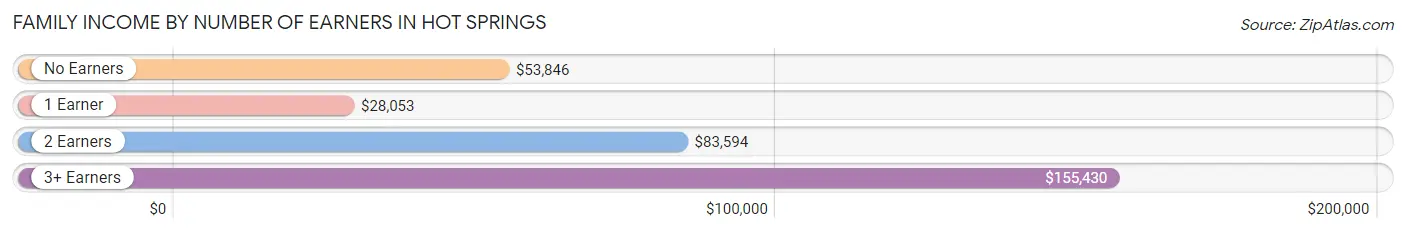
Family Income by Number of Earners in Hot Springs
The median family income in Hot Springs is $60,972, with families comprising 3+ earners (101) having the highest median family income of $155,430, while families with 1 earner (321) have the lowest median family income of $28,053, accounting for 11.9% and 37.8% of families, respectively.
| Number of Earners | # Families | Median Income |
| No Earners | 164 (19.3%) | $53,846 |
| 1 Earner | 321 (37.8%) | $28,053 |
| 2 Earners | 263 (31.0%) | $83,594 |
| 3+ Earners | 101 (11.9%) | $155,430 |
| Total | 849 (100.0%) | $60,972 |
Household Income in Hot Springs
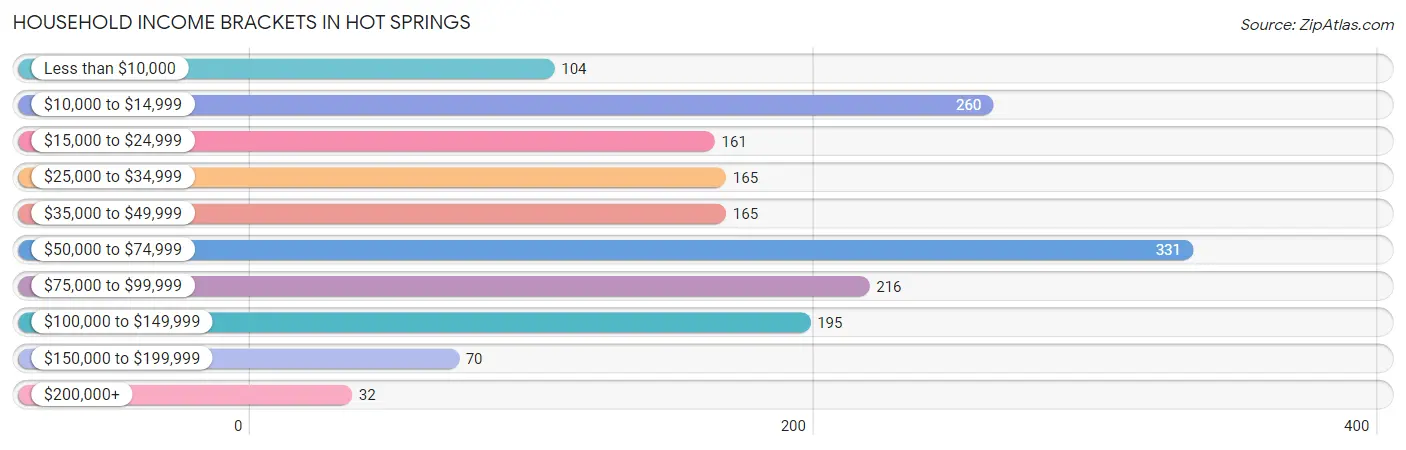
Household Income Brackets in Hot Springs
With 331 households falling in the category, the $50,000 to $74,999 income range is the most frequent in Hot Springs, accounting for 19.5% of all households. In contrast, only 32 households (1.9%) fall into the $200,000+ income bracket, making it the least populous group.
| Income Bracket | # Households | % Households |
| Less than $10,000 | 104 | 6.1% |
| $10,000 to $14,999 | 260 | 15.3% |
| $15,000 to $24,999 | 161 | 9.5% |
| $25,000 to $34,999 | 165 | 9.7% |
| $35,000 to $49,999 | 165 | 9.7% |
| $50,000 to $74,999 | 331 | 19.5% |
| $75,000 to $99,999 | 216 | 12.7% |
| $100,000 to $149,999 | 195 | 11.5% |
| $150,000 to $199,999 | 70 | 4.1% |
| $200,000+ | 32 | 1.9% |
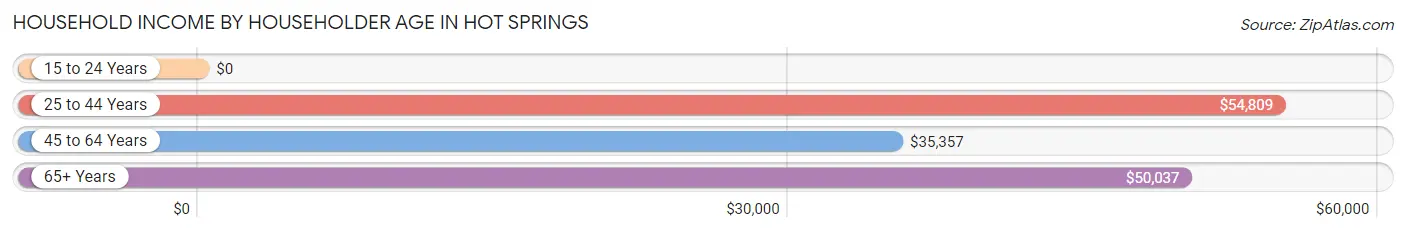
Household Income by Householder Age in Hot Springs
The median household income in Hot Springs is $47,337, with the highest median household income of $54,809 found in the 25 to 44 years age bracket for the primary householder. A total of 251 households (14.8%) fall into this category. Meanwhile, the 15 to 24 years age bracket for the primary householder has the lowest median household income of $0, with 49 households (2.9%) in this group.
| Income Bracket | # Households | Median Income |
| 15 to 24 Years | 49 (2.9%) | $0 |
| 25 to 44 Years | 251 (14.8%) | $54,809 |
| 45 to 64 Years | 730 (43.0%) | $35,357 |
| 65+ Years | 667 (39.3%) | $50,037 |
| Total | 1,697 (100.0%) | $47,337 |
Poverty in Hot Springs
Income Below Poverty by Sex and Age in Hot Springs
With 26.7% poverty level for males and 27.5% for females among the residents of Hot Springs, under 5 year old males and under 5 year old females are the most vulnerable to poverty, with 83 males (100.0%) and 54 females (100.0%) in their respective age groups living below the poverty level.
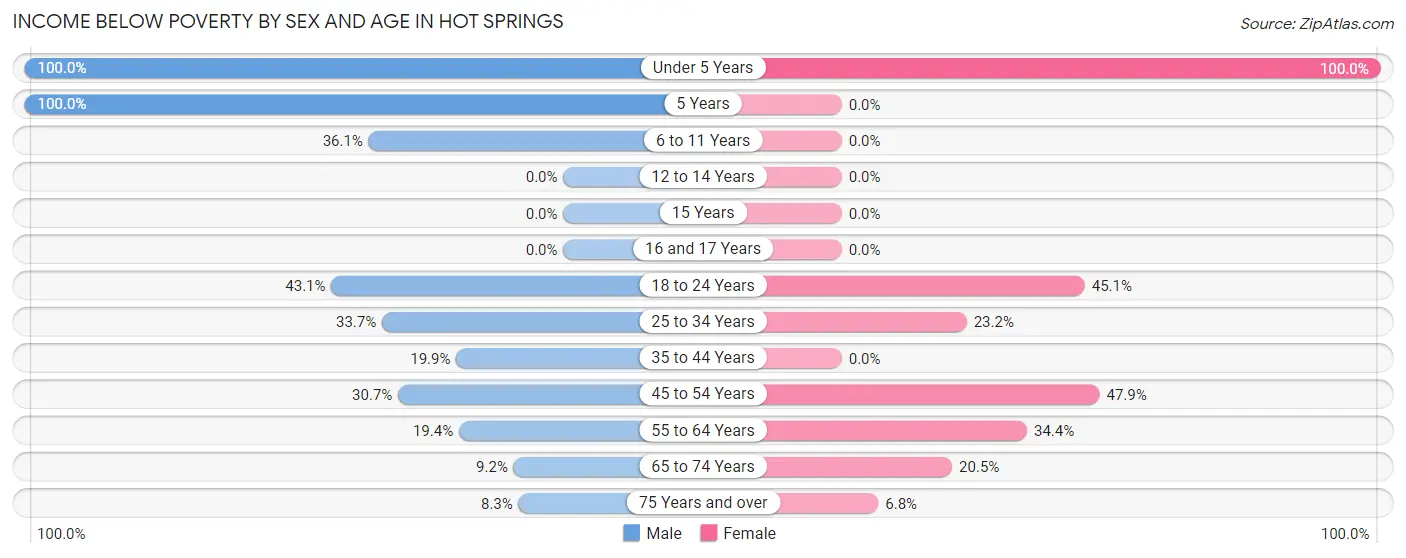
| Age Bracket | Male | Female |
| Under 5 Years | 83 (100.0%) | 54 (100.0%) |
| 5 Years | 22 (100.0%) | 0 (0.0%) |
| 6 to 11 Years | 43 (36.1%) | 0 (0.0%) |
| 12 to 14 Years | 0 (0.0%) | 0 (0.0%) |
| 15 Years | 0 (0.0%) | 0 (0.0%) |
| 16 and 17 Years | 0 (0.0%) | 0 (0.0%) |
| 18 to 24 Years | 31 (43.1%) | 46 (45.1%) |
| 25 to 34 Years | 69 (33.7%) | 64 (23.2%) |
| 35 to 44 Years | 30 (19.9%) | 0 (0.0%) |
| 45 to 54 Years | 65 (30.7%) | 78 (47.8%) |
| 55 to 64 Years | 43 (19.4%) | 130 (34.4%) |
| 65 to 74 Years | 21 (9.2%) | 59 (20.5%) |
| 75 Years and over | 19 (8.3%) | 16 (6.8%) |
| Total | 426 (26.7%) | 447 (27.5%) |
Income Above Poverty by Sex and Age in Hot Springs
According to the poverty statistics in Hot Springs, males aged 12 to 14 years and females aged 6 to 11 years are the age groups that are most secure financially, with 100.0% of males and 100.0% of females in these age groups living above the poverty line.
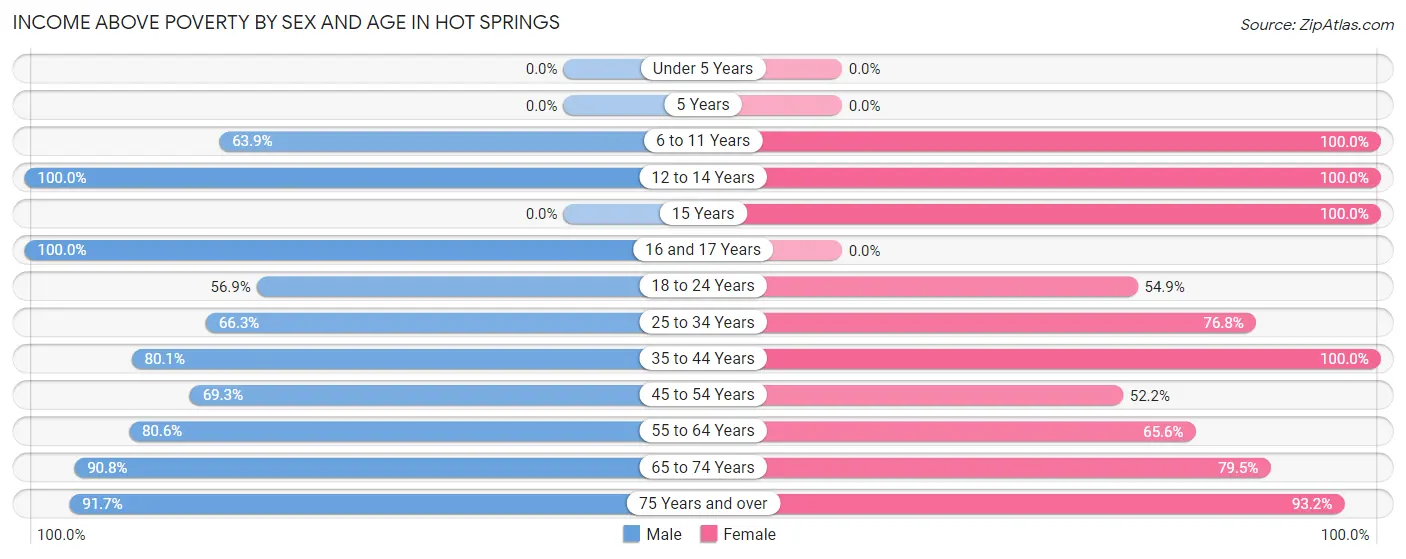
| Age Bracket | Male | Female |
| Under 5 Years | 0 (0.0%) | 0 (0.0%) |
| 5 Years | 0 (0.0%) | 0 (0.0%) |
| 6 to 11 Years | 76 (63.9%) | 51 (100.0%) |
| 12 to 14 Years | 25 (100.0%) | 28 (100.0%) |
| 15 Years | 0 (0.0%) | 22 (100.0%) |
| 16 and 17 Years | 29 (100.0%) | 0 (0.0%) |
| 18 to 24 Years | 41 (56.9%) | 56 (54.9%) |
| 25 to 34 Years | 136 (66.3%) | 212 (76.8%) |
| 35 to 44 Years | 121 (80.1%) | 30 (100.0%) |
| 45 to 54 Years | 147 (69.3%) | 85 (52.1%) |
| 55 to 64 Years | 179 (80.6%) | 248 (65.6%) |
| 65 to 74 Years | 207 (90.8%) | 229 (79.5%) |
| 75 Years and over | 210 (91.7%) | 220 (93.2%) |
| Total | 1,171 (73.3%) | 1,181 (72.5%) |
Income Below Poverty Among Married-Couple Families in Hot Springs
The poverty statistics for married-couple families in Hot Springs show that 9.9% or 44 of the total 446 families live below the poverty line. Families with no children have the highest poverty rate of 12.0%, comprising of 44 families. On the other hand, families with 1 or 2 children have the lowest poverty rate of 0.0%, which includes 0 families.
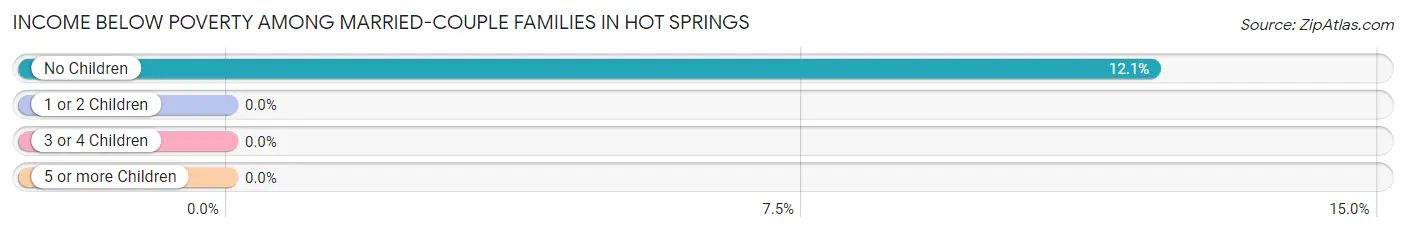
| Children | Above Poverty | Below Poverty |
| No Children | 321 (87.9%) | 44 (12.0%) |
| 1 or 2 Children | 81 (100.0%) | 0 (0.0%) |
| 3 or 4 Children | 0 (0.0%) | 0 (0.0%) |
| 5 or more Children | 0 (0.0%) | 0 (0.0%) |
| Total | 402 (90.1%) | 44 (9.9%) |
Income Below Poverty Among Single-Parent Households in Hot Springs
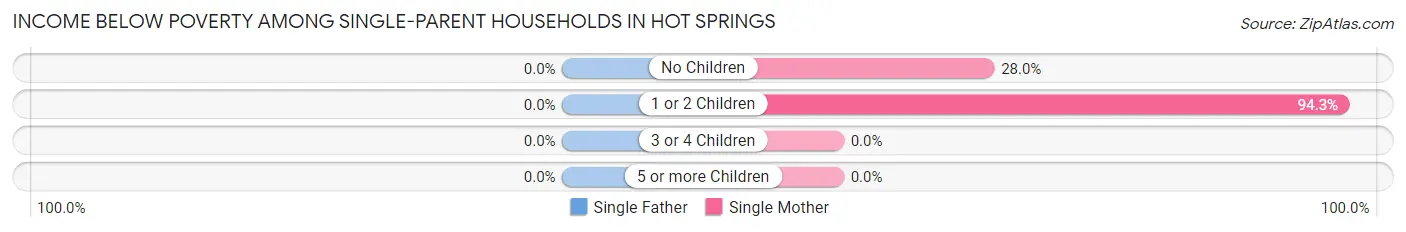
| Children | Single Father | Single Mother |
| No Children | 0 (0.0%) | 60 (28.0%) |
| 1 or 2 Children | 0 (0.0%) | 99 (94.3%) |
| 3 or 4 Children | 0 (0.0%) | 0 (0.0%) |
| 5 or more Children | 0 (0.0%) | 0 (0.0%) |
| Total | 0 (0.0%) | 159 (49.8%) |
Income Below Poverty Among Married-Couple vs Single-Parent Households in Hot Springs
The poverty data for Hot Springs shows that 44 of the married-couple family households (9.9%) and 159 of the single-parent households (39.5%) are living below the poverty level. Within the married-couple family households, those with no children have the highest poverty rate, with 44 households (12.0%) falling below the poverty line. Among the single-parent households, those with 1 or 2 children have the highest poverty rate, with 99 household (72.3%) living below poverty.
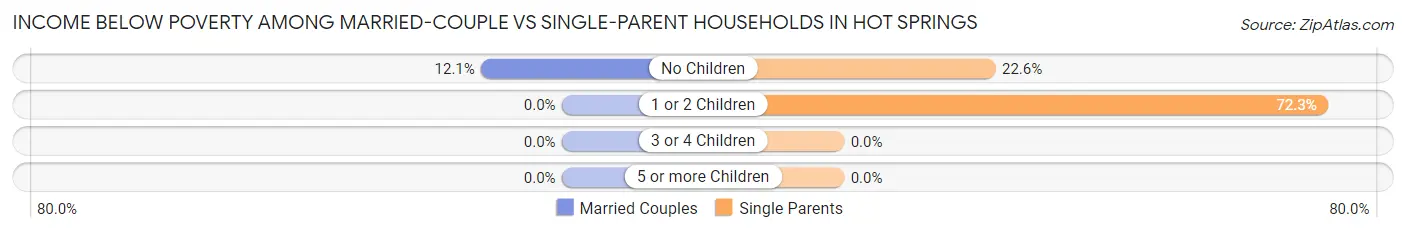
| Children | Married-Couple Families | Single-Parent Households |
| No Children | 44 (12.0%) | 60 (22.6%) |
| 1 or 2 Children | 0 (0.0%) | 99 (72.3%) |
| 3 or 4 Children | 0 (0.0%) | 0 (0.0%) |
| 5 or more Children | 0 (0.0%) | 0 (0.0%) |
| Total | 44 (9.9%) | 159 (39.5%) |
Employment Characteristics in Hot Springs
Employment by Class of Employer in Hot Springs
Among the 1,408 employed individuals in Hot Springs, private company employees (779 | 55.3%), self-employed (not incorporated) (180 | 12.8%), and federal government employees (179 | 12.7%) make up the most common classes of employment.
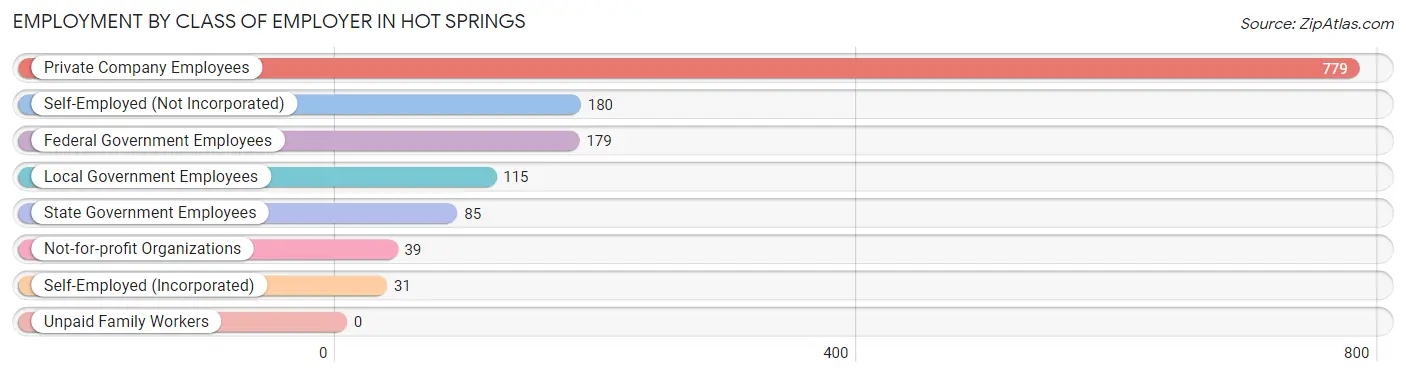
| Employer Class | # Employees | % Employees |
| Private Company Employees | 779 | 55.3% |
| Self-Employed (Incorporated) | 31 | 2.2% |
| Self-Employed (Not Incorporated) | 180 | 12.8% |
| Not-for-profit Organizations | 39 | 2.8% |
| Local Government Employees | 115 | 8.2% |
| State Government Employees | 85 | 6.0% |
| Federal Government Employees | 179 | 12.7% |
| Unpaid Family Workers | 0 | 0.0% |
| Total | 1,408 | 100.0% |
Employment Status by Age in Hot Springs
According to the labor force statistics for Hot Springs, out of the total population over 16 years of age (3,061), 50.7% or 1,552 individuals are in the labor force, with 3.1% or 48 of them unemployed. The age group with the highest labor force participation rate is 45 to 54 years, with 88.7% or 338 individuals in the labor force. Within the labor force, the 16 to 19 years age range has the highest percentage of unemployed individuals, with 54.2% or 32 of them being unemployed.
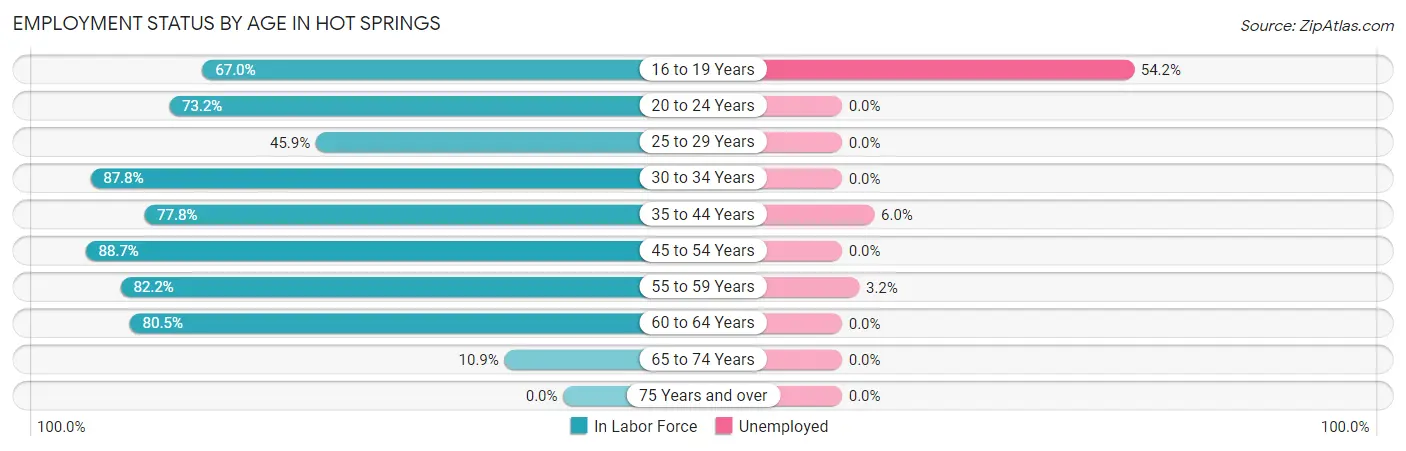
| Age Bracket | In Labor Force | Unemployed |
| 16 to 19 Years | 59 (67.0%) | 32 (54.2%) |
| 20 to 24 Years | 93 (73.2%) | 0 (0.0%) |
| 25 to 29 Years | 84 (45.9%) | 0 (0.0%) |
| 30 to 34 Years | 266 (87.8%) | 0 (0.0%) |
| 35 to 44 Years | 151 (77.8%) | 9 (6.0%) |
| 45 to 54 Years | 338 (88.7%) | 0 (0.0%) |
| 55 to 59 Years | 221 (82.2%) | 7 (3.2%) |
| 60 to 64 Years | 273 (80.5%) | 0 (0.0%) |
| 65 to 74 Years | 66 (10.9%) | 0 (0.0%) |
| 75 Years and over | 0 (0.0%) | 0 (0.0%) |
| Total | 1,552 (50.7%) | 48 (3.1%) |
Employment Status by Educational Attainment in Hot Springs
According to labor force statistics for Hot Springs, 79.9% of individuals (1,334) out of the total population between 25 and 64 years of age (1,669) are in the labor force, with 1.2% or 16 of them being unemployed. The group with the highest labor force participation rate are those with the educational attainment of bachelor's degree or higher, with 93.7% or 254 individuals in the labor force. Within the labor force, individuals with college / associate degree education have the highest percentage of unemployment, with 2.4% or 16 of them being unemployed.
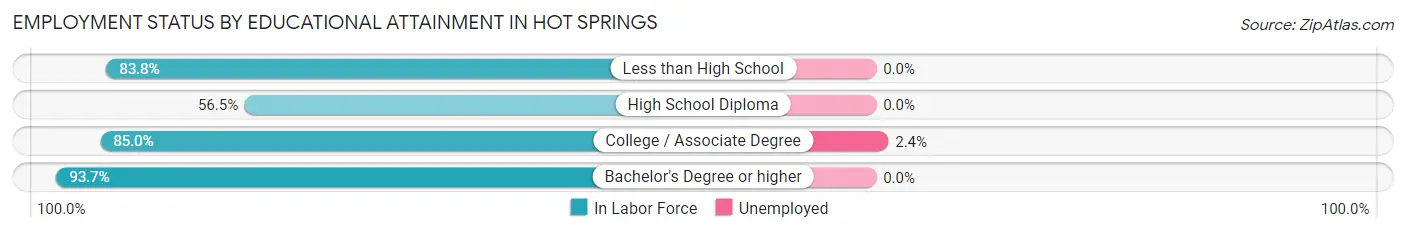
| Educational Attainment | In Labor Force | Unemployed |
| Less than High School | 212 (83.8%) | 0 (0.0%) |
| High School Diploma | 210 (56.5%) | 0 (0.0%) |
| College / Associate Degree | 657 (85.0%) | 19 (2.4%) |
| Bachelor's Degree or higher | 254 (93.7%) | 0 (0.0%) |
| Total | 1,334 (79.9%) | 20 (1.2%) |
Employment Occupations by Sex in Hot Springs
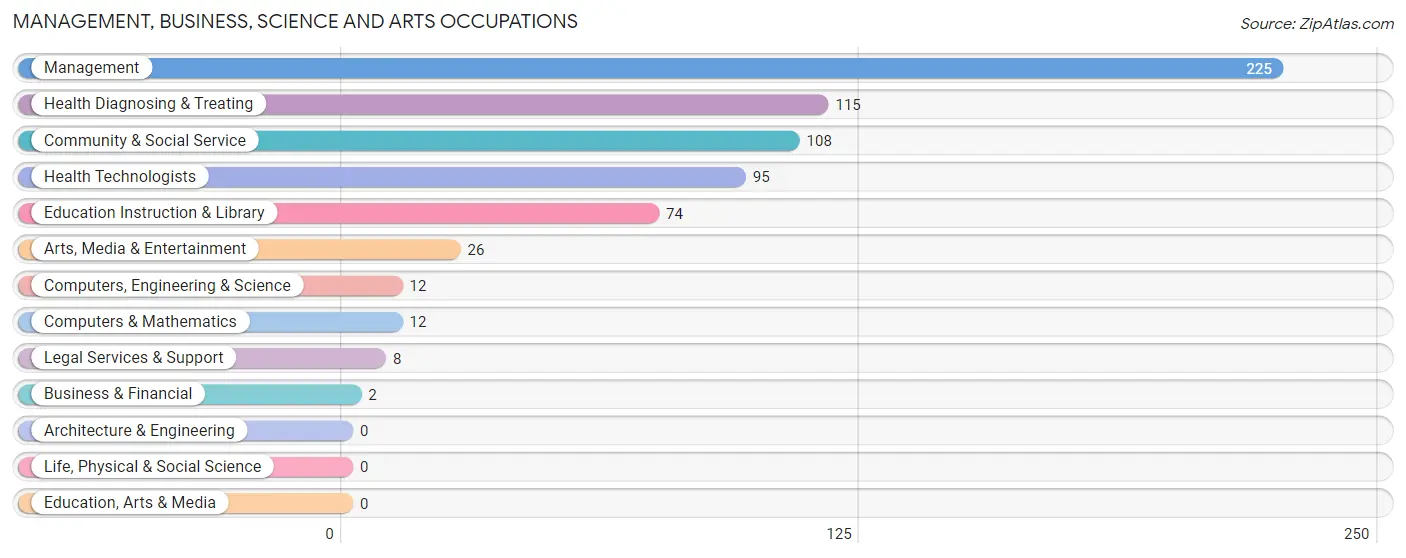
Management, Business, Science and Arts Occupations
The most common Management, Business, Science and Arts occupations in Hot Springs are Management (225 | 15.0%), Health Diagnosing & Treating (115 | 7.6%), Community & Social Service (108 | 7.2%), Health Technologists (95 | 6.3%), and Education Instruction & Library (74 | 4.9%).
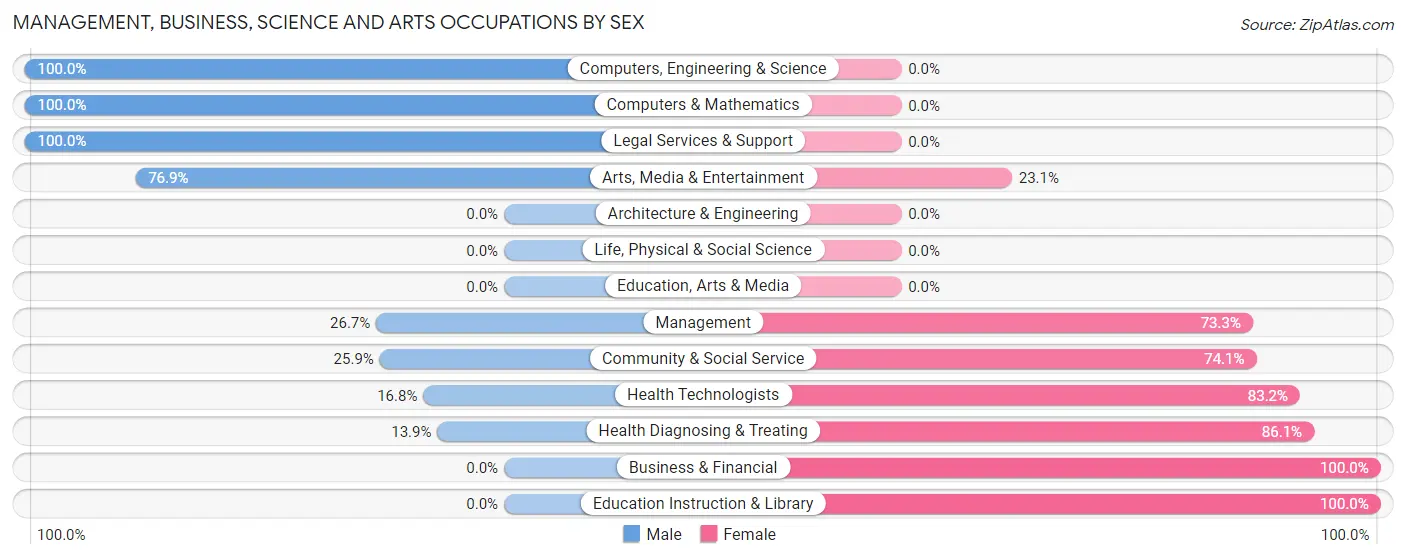
Management, Business, Science and Arts Occupations by Sex
Within the Management, Business, Science and Arts occupations in Hot Springs, the most male-oriented occupations are Computers, Engineering & Science (100.0%), Computers & Mathematics (100.0%), and Legal Services & Support (100.0%), while the most female-oriented occupations are Business & Financial (100.0%), Education Instruction & Library (100.0%), and Health Diagnosing & Treating (86.1%).
| Occupation | Male | Female |
| Management | 60 (26.7%) | 165 (73.3%) |
| Business & Financial | 0 (0.0%) | 2 (100.0%) |
| Computers, Engineering & Science | 12 (100.0%) | 0 (0.0%) |
| Computers & Mathematics | 12 (100.0%) | 0 (0.0%) |
| Architecture & Engineering | 0 (0.0%) | 0 (0.0%) |
| Life, Physical & Social Science | 0 (0.0%) | 0 (0.0%) |
| Community & Social Service | 28 (25.9%) | 80 (74.1%) |
| Education, Arts & Media | 0 (0.0%) | 0 (0.0%) |
| Legal Services & Support | 8 (100.0%) | 0 (0.0%) |
| Education Instruction & Library | 0 (0.0%) | 74 (100.0%) |
| Arts, Media & Entertainment | 20 (76.9%) | 6 (23.1%) |
| Health Diagnosing & Treating | 16 (13.9%) | 99 (86.1%) |
| Health Technologists | 16 (16.8%) | 79 (83.2%) |
| Total (Category) | 116 (25.1%) | 346 (74.9%) |
| Total (Overall) | 701 (46.6%) | 802 (53.4%) |
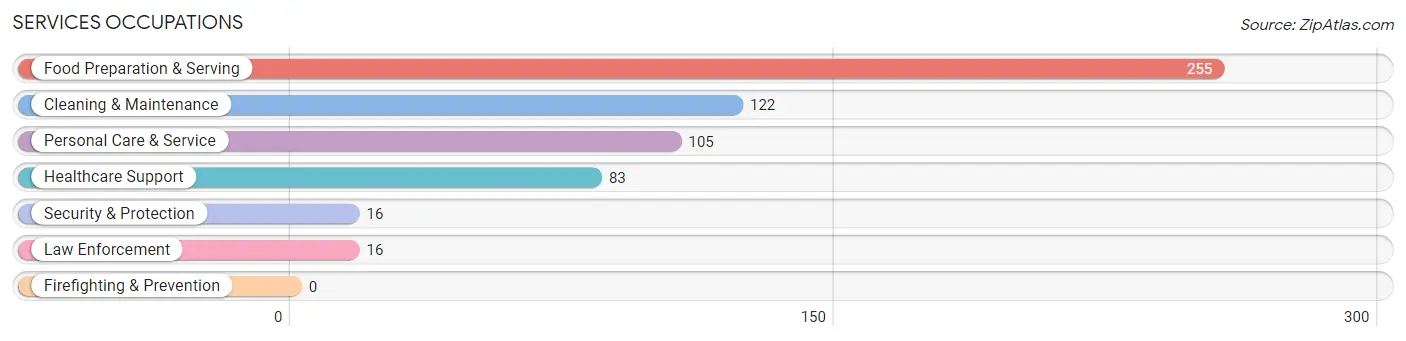
Services Occupations
The most common Services occupations in Hot Springs are Food Preparation & Serving (255 | 17.0%), Cleaning & Maintenance (122 | 8.1%), Personal Care & Service (105 | 7.0%), Healthcare Support (83 | 5.5%), and Security & Protection (16 | 1.1%).
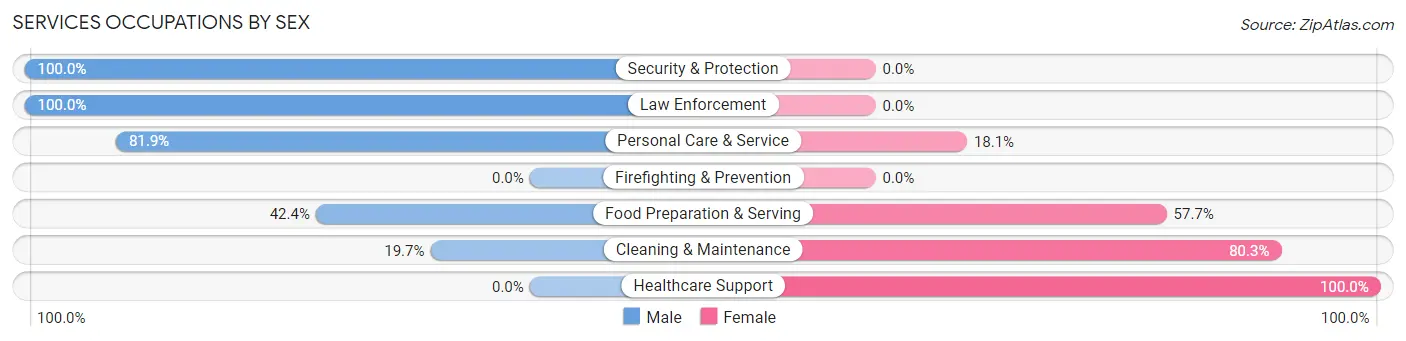
Services Occupations by Sex
Within the Services occupations in Hot Springs, the most male-oriented occupations are Security & Protection (100.0%), Law Enforcement (100.0%), and Personal Care & Service (81.9%), while the most female-oriented occupations are Healthcare Support (100.0%), Cleaning & Maintenance (80.3%), and Food Preparation & Serving (57.7%).
| Occupation | Male | Female |
| Healthcare Support | 0 (0.0%) | 83 (100.0%) |
| Security & Protection | 16 (100.0%) | 0 (0.0%) |
| Firefighting & Prevention | 0 (0.0%) | 0 (0.0%) |
| Law Enforcement | 16 (100.0%) | 0 (0.0%) |
| Food Preparation & Serving | 108 (42.3%) | 147 (57.7%) |
| Cleaning & Maintenance | 24 (19.7%) | 98 (80.3%) |
| Personal Care & Service | 86 (81.9%) | 19 (18.1%) |
| Total (Category) | 234 (40.3%) | 347 (59.7%) |
| Total (Overall) | 701 (46.6%) | 802 (53.4%) |
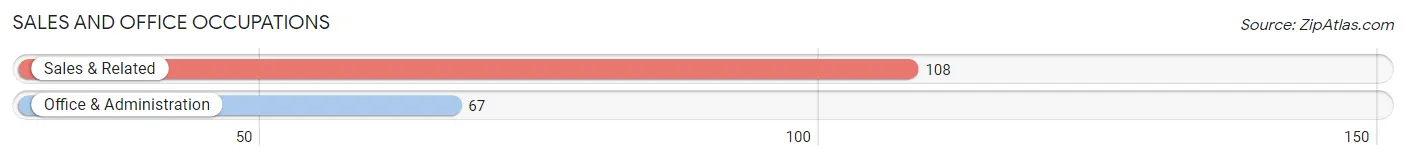
Sales and Office Occupations
The most common Sales and Office occupations in Hot Springs are Sales & Related (108 | 7.2%), and Office & Administration (67 | 4.5%).
Sales and Office Occupations by Sex
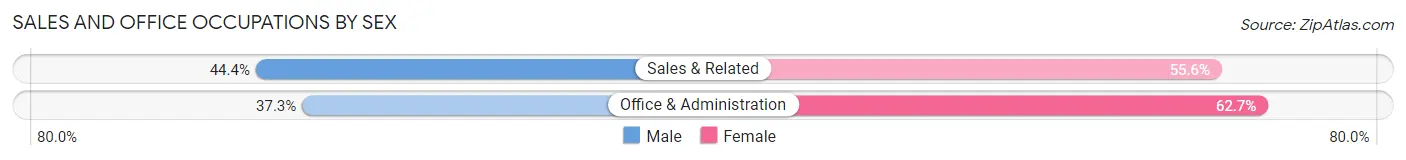
| Occupation | Male | Female |
| Sales & Related | 48 (44.4%) | 60 (55.6%) |
| Office & Administration | 25 (37.3%) | 42 (62.7%) |
| Total (Category) | 73 (41.7%) | 102 (58.3%) |
| Total (Overall) | 701 (46.6%) | 802 (53.4%) |
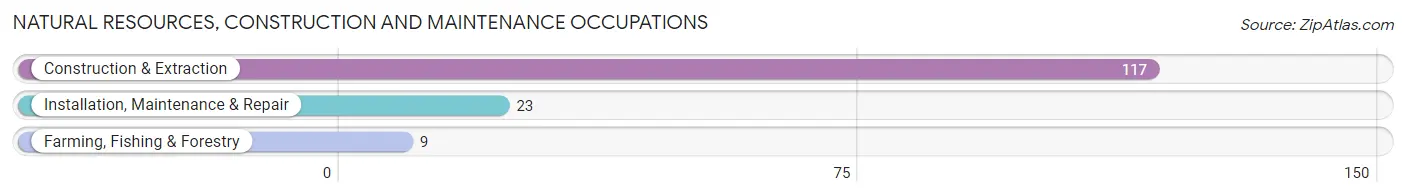
Natural Resources, Construction and Maintenance Occupations
The most common Natural Resources, Construction and Maintenance occupations in Hot Springs are Construction & Extraction (117 | 7.8%), Installation, Maintenance & Repair (23 | 1.5%), and Farming, Fishing & Forestry (9 | 0.6%).
Natural Resources, Construction and Maintenance Occupations by Sex
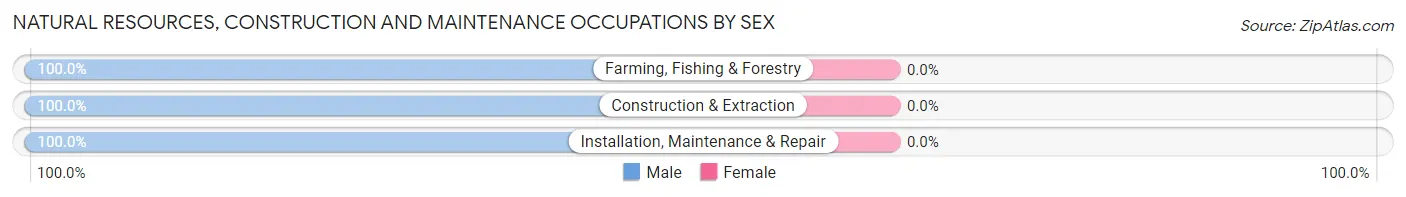
| Occupation | Male | Female |
| Farming, Fishing & Forestry | 9 (100.0%) | 0 (0.0%) |
| Construction & Extraction | 117 (100.0%) | 0 (0.0%) |
| Installation, Maintenance & Repair | 23 (100.0%) | 0 (0.0%) |
| Total (Category) | 149 (100.0%) | 0 (0.0%) |
| Total (Overall) | 701 (46.6%) | 802 (53.4%) |
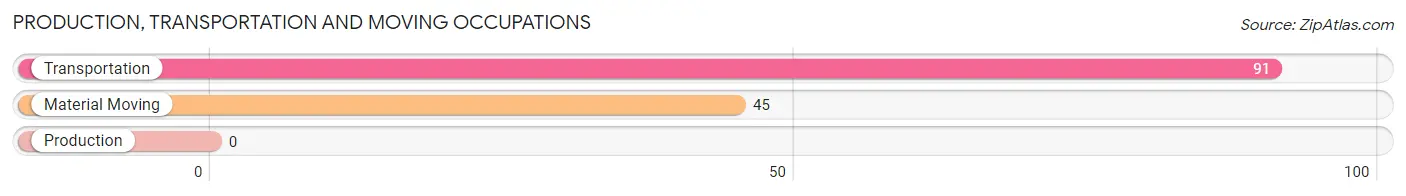
Production, Transportation and Moving Occupations
The most common Production, Transportation and Moving occupations in Hot Springs are Transportation (91 | 6.0%), and Material Moving (45 | 3.0%).
Production, Transportation and Moving Occupations by Sex
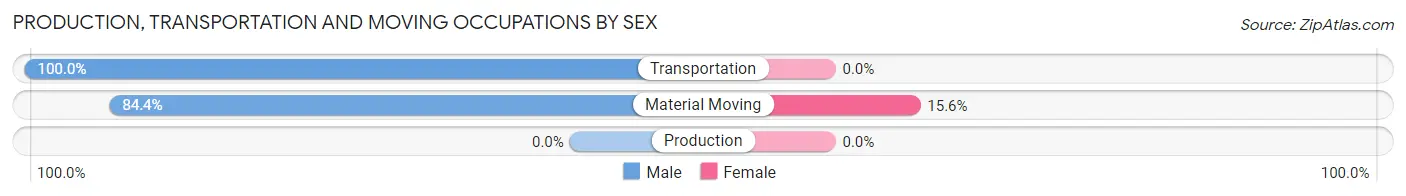
| Occupation | Male | Female |
| Production | 0 (0.0%) | 0 (0.0%) |
| Transportation | 91 (100.0%) | 0 (0.0%) |
| Material Moving | 38 (84.4%) | 7 (15.6%) |
| Total (Category) | 129 (94.9%) | 7 (5.1%) |
| Total (Overall) | 701 (46.6%) | 802 (53.4%) |
Employment Industries by Sex in Hot Springs
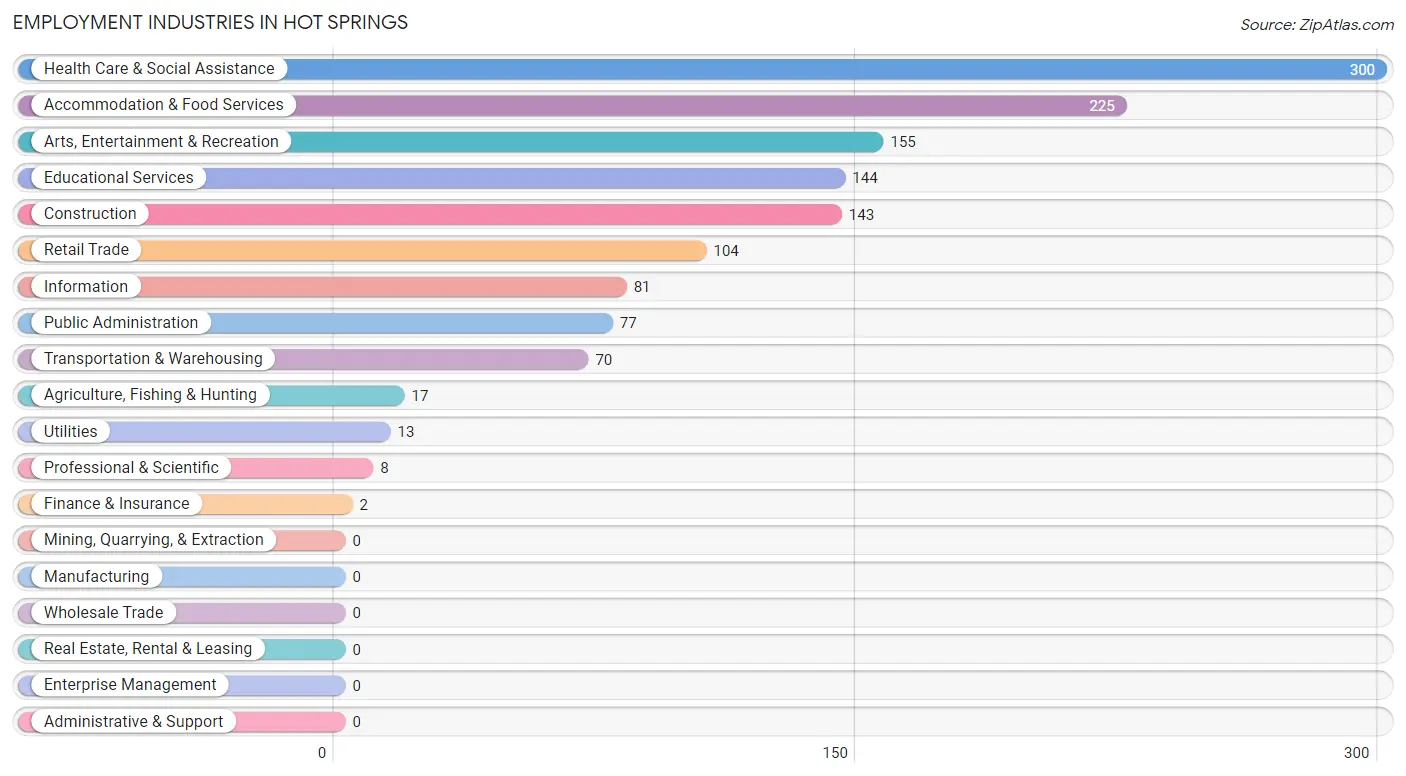
Employment Industries in Hot Springs
The major employment industries in Hot Springs include Health Care & Social Assistance (300 | 20.0%), Accommodation & Food Services (225 | 15.0%), Arts, Entertainment & Recreation (155 | 10.3%), Educational Services (144 | 9.6%), and Construction (143 | 9.5%).
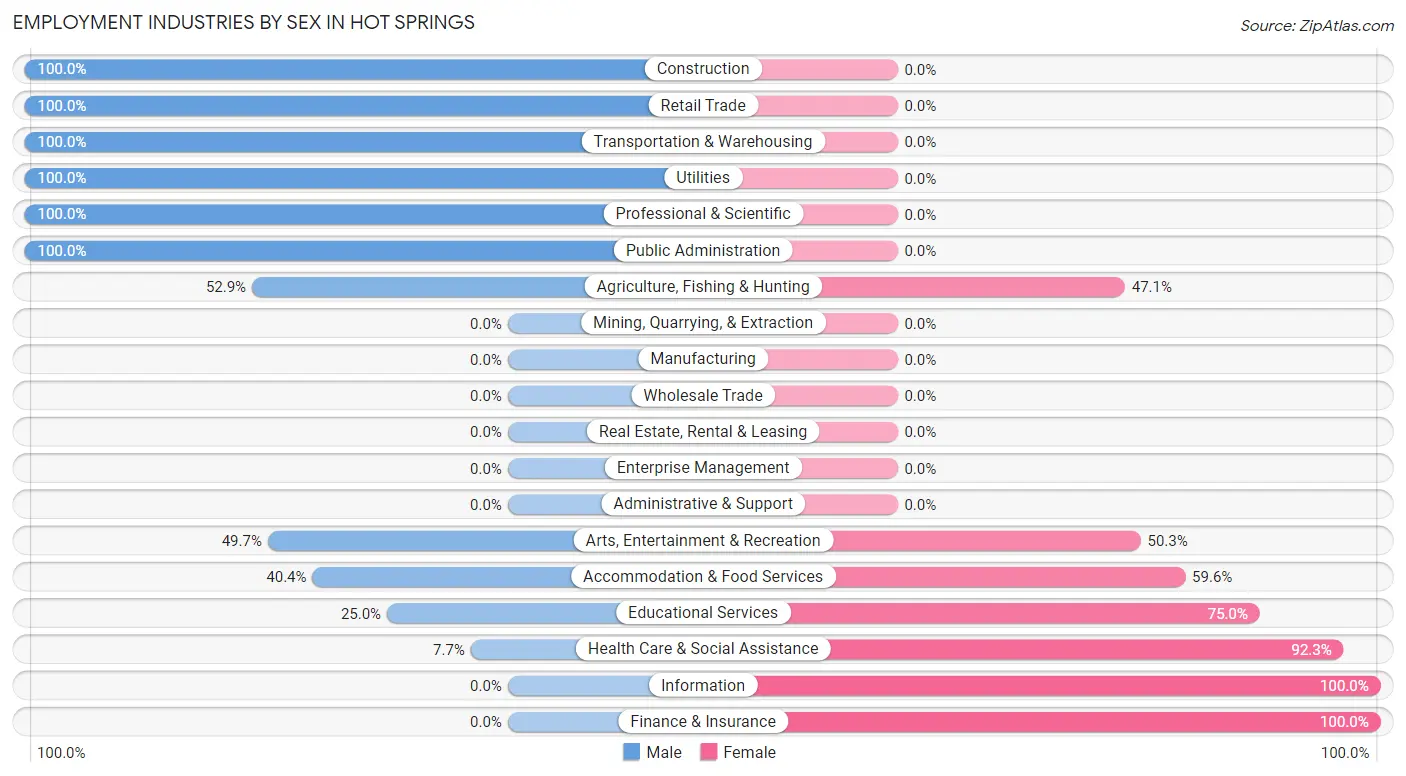
Employment Industries by Sex in Hot Springs
The Hot Springs industries that see more men than women are Construction (100.0%), Retail Trade (100.0%), and Transportation & Warehousing (100.0%), whereas the industries that tend to have a higher number of women are Information (100.0%), Finance & Insurance (100.0%), and Health Care & Social Assistance (92.3%).
| Industry | Male | Female |
| Agriculture, Fishing & Hunting | 9 (52.9%) | 8 (47.1%) |
| Mining, Quarrying, & Extraction | 0 (0.0%) | 0 (0.0%) |
| Construction | 143 (100.0%) | 0 (0.0%) |
| Manufacturing | 0 (0.0%) | 0 (0.0%) |
| Wholesale Trade | 0 (0.0%) | 0 (0.0%) |
| Retail Trade | 104 (100.0%) | 0 (0.0%) |
| Transportation & Warehousing | 70 (100.0%) | 0 (0.0%) |
| Utilities | 13 (100.0%) | 0 (0.0%) |
| Information | 0 (0.0%) | 81 (100.0%) |
| Finance & Insurance | 0 (0.0%) | 2 (100.0%) |
| Real Estate, Rental & Leasing | 0 (0.0%) | 0 (0.0%) |
| Professional & Scientific | 8 (100.0%) | 0 (0.0%) |
| Enterprise Management | 0 (0.0%) | 0 (0.0%) |
| Administrative & Support | 0 (0.0%) | 0 (0.0%) |
| Educational Services | 36 (25.0%) | 108 (75.0%) |
| Health Care & Social Assistance | 23 (7.7%) | 277 (92.3%) |
| Arts, Entertainment & Recreation | 77 (49.7%) | 78 (50.3%) |
| Accommodation & Food Services | 91 (40.4%) | 134 (59.6%) |
| Public Administration | 77 (100.0%) | 0 (0.0%) |
| Total | 701 (46.6%) | 802 (53.4%) |
Education in Hot Springs
School Enrollment in Hot Springs
The most common levels of schooling among the 412 students in Hot Springs are elementary school (134 | 32.5%), high school (106 | 25.7%), and nursery / preschool (83 | 20.2%).
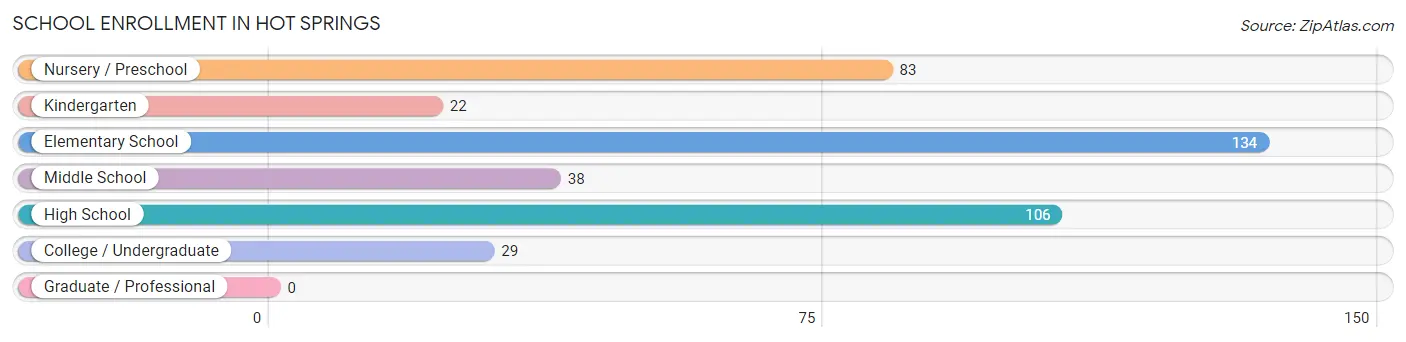
| School Level | # Students | % Students |
| Nursery / Preschool | 83 | 20.2% |
| Kindergarten | 22 | 5.3% |
| Elementary School | 134 | 32.5% |
| Middle School | 38 | 9.2% |
| High School | 106 | 25.7% |
| College / Undergraduate | 29 | 7.0% |
| Graduate / Professional | 0 | 0.0% |
| Total | 412 | 100.0% |
School Enrollment by Age by Funding Source in Hot Springs
Out of a total of 412 students who are enrolled in schools in Hot Springs, 16 (3.9%) attend a private institution, while the remaining 396 (96.1%) are enrolled in public schools. The age group of 25 to 34 year olds has the highest likelihood of being enrolled in private schools, with 16 (100.0% in the age bracket) enrolled. Conversely, the age group of 3 to 4 year olds has the lowest likelihood of being enrolled in a private school, with 83 (100.0% in the age bracket) attending a public institution.
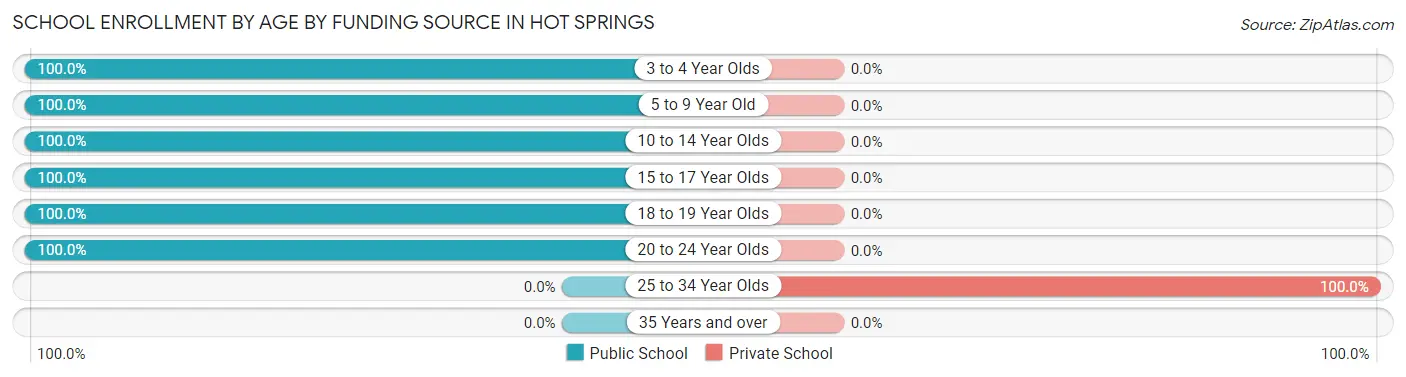
| Age Bracket | Public School | Private School |
| 3 to 4 Year Olds | 83 (100.0%) | 0 (0.0%) |
| 5 to 9 Year Old | 128 (100.0%) | 0 (0.0%) |
| 10 to 14 Year Olds | 94 (100.0%) | 0 (0.0%) |
| 15 to 17 Year Olds | 51 (100.0%) | 0 (0.0%) |
| 18 to 19 Year Olds | 27 (100.0%) | 0 (0.0%) |
| 20 to 24 Year Olds | 13 (100.0%) | 0 (0.0%) |
| 25 to 34 Year Olds | 0 (0.0%) | 16 (100.0%) |
| 35 Years and over | 0 (0.0%) | 0 (0.0%) |
| Total | 396 (96.1%) | 16 (3.9%) |
Educational Attainment by Field of Study in Hot Springs
Education (142 | 26.0%), business (111 | 20.3%), science & technology (102 | 18.6%), arts & humanities (47 | 8.6%), and computers & mathematics (40 | 7.3%) are the most common fields of study among 547 individuals in Hot Springs who have obtained a bachelor's degree or higher.
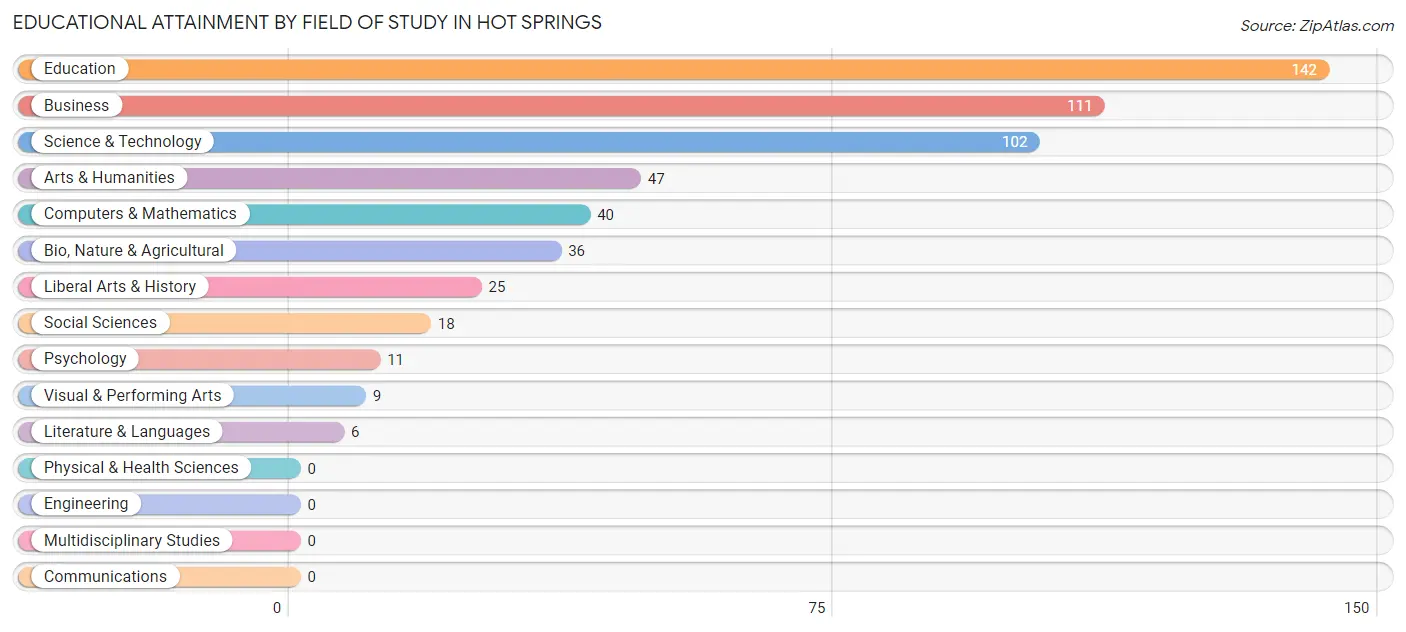
| Field of Study | # Graduates | % Graduates |
| Computers & Mathematics | 40 | 7.3% |
| Bio, Nature & Agricultural | 36 | 6.6% |
| Physical & Health Sciences | 0 | 0.0% |
| Psychology | 11 | 2.0% |
| Social Sciences | 18 | 3.3% |
| Engineering | 0 | 0.0% |
| Multidisciplinary Studies | 0 | 0.0% |
| Science & Technology | 102 | 18.6% |
| Business | 111 | 20.3% |
| Education | 142 | 26.0% |
| Literature & Languages | 6 | 1.1% |
| Liberal Arts & History | 25 | 4.6% |
| Visual & Performing Arts | 9 | 1.7% |
| Communications | 0 | 0.0% |
| Arts & Humanities | 47 | 8.6% |
| Total | 547 | 100.0% |
Transportation & Commute in Hot Springs
Vehicle Availability by Sex in Hot Springs
The most prevalent vehicle ownership categories in Hot Springs are males with 1 vehicle (203, accounting for 29.3%) and females with 1 vehicle (115, making up 29.1%).
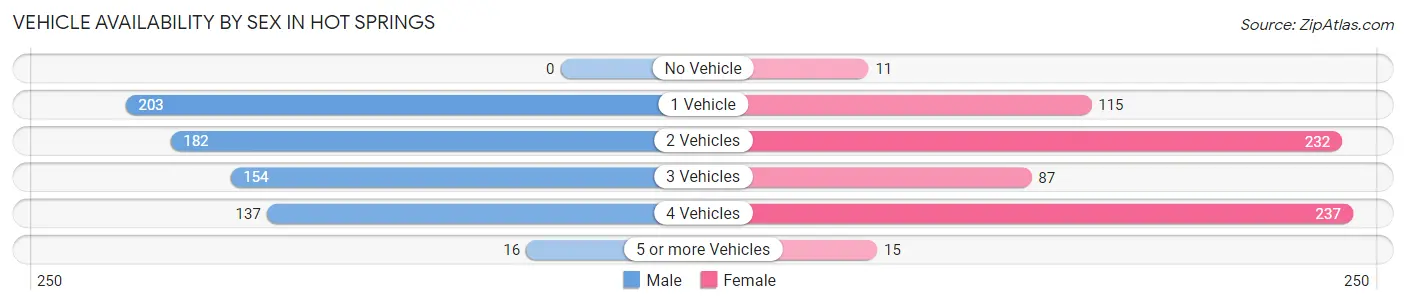
| Vehicles Available | Male | Female |
| No Vehicle | 0 (0.0%) | 11 (1.6%) |
| 1 Vehicle | 203 (29.3%) | 115 (16.5%) |
| 2 Vehicles | 182 (26.3%) | 232 (33.3%) |
| 3 Vehicles | 154 (22.3%) | 87 (12.5%) |
| 4 Vehicles | 137 (19.8%) | 237 (34.0%) |
| 5 or more Vehicles | 16 (2.3%) | 15 (2.1%) |
| Total | 692 (100.0%) | 697 (100.0%) |
Commute Time in Hot Springs
The most frequently occuring commute durations in Hot Springs are 5 to 9 minutes (526 commuters, 40.9%), less than 5 minutes (276 commuters, 21.4%), and 10 to 14 minutes (176 commuters, 13.7%).
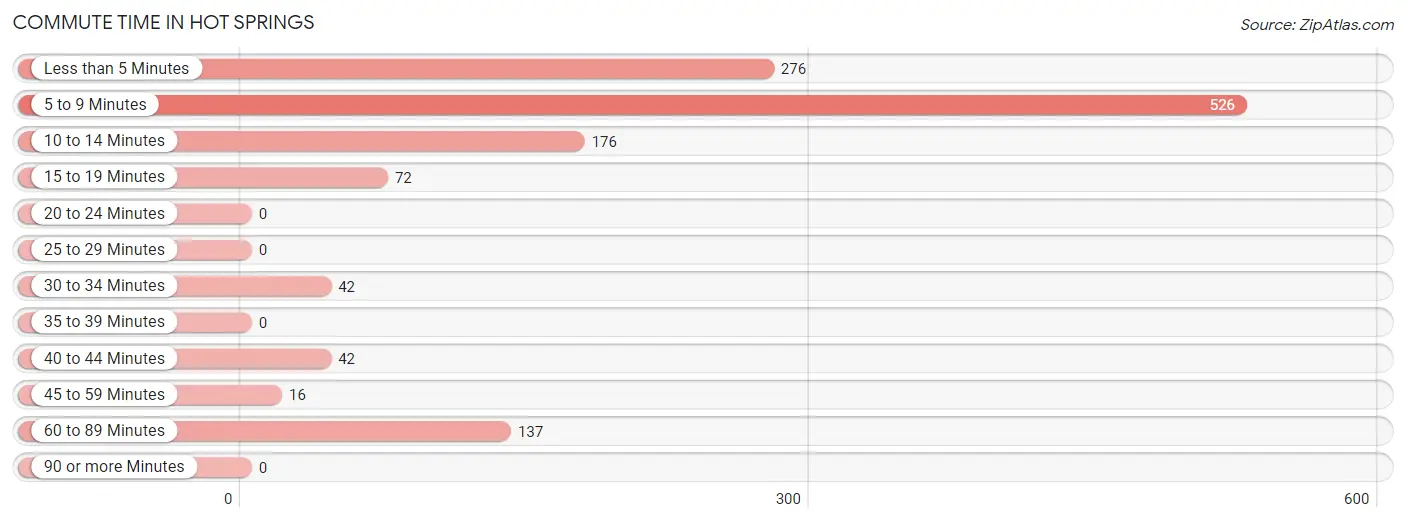
| Commute Time | # Commuters | % Commuters |
| Less than 5 Minutes | 276 | 21.4% |
| 5 to 9 Minutes | 526 | 40.9% |
| 10 to 14 Minutes | 176 | 13.7% |
| 15 to 19 Minutes | 72 | 5.6% |
| 20 to 24 Minutes | 0 | 0.0% |
| 25 to 29 Minutes | 0 | 0.0% |
| 30 to 34 Minutes | 42 | 3.3% |
| 35 to 39 Minutes | 0 | 0.0% |
| 40 to 44 Minutes | 42 | 3.3% |
| 45 to 59 Minutes | 16 | 1.2% |
| 60 to 89 Minutes | 137 | 10.6% |
| 90 or more Minutes | 0 | 0.0% |
Commute Time by Sex in Hot Springs
The most common commute times in Hot Springs are 5 to 9 minutes (232 commuters, 35.4%) for males and 5 to 9 minutes (294 commuters, 46.6%) for females.
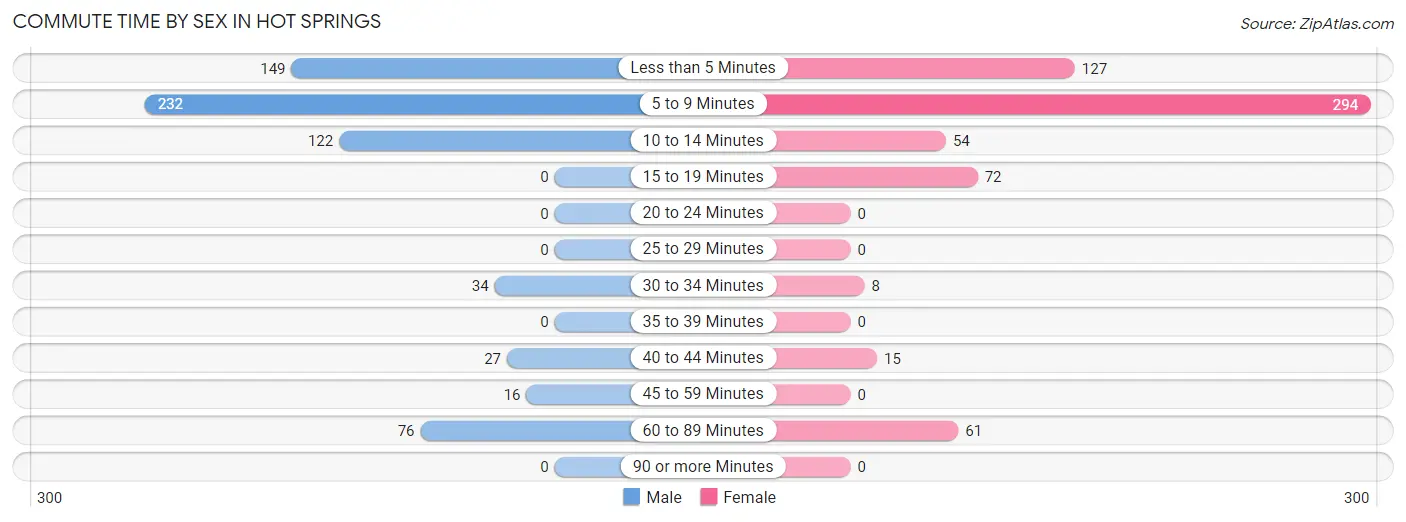
| Commute Time | Male | Female |
| Less than 5 Minutes | 149 (22.7%) | 127 (20.1%) |
| 5 to 9 Minutes | 232 (35.4%) | 294 (46.6%) |
| 10 to 14 Minutes | 122 (18.6%) | 54 (8.6%) |
| 15 to 19 Minutes | 0 (0.0%) | 72 (11.4%) |
| 20 to 24 Minutes | 0 (0.0%) | 0 (0.0%) |
| 25 to 29 Minutes | 0 (0.0%) | 0 (0.0%) |
| 30 to 34 Minutes | 34 (5.2%) | 8 (1.3%) |
| 35 to 39 Minutes | 0 (0.0%) | 0 (0.0%) |
| 40 to 44 Minutes | 27 (4.1%) | 15 (2.4%) |
| 45 to 59 Minutes | 16 (2.4%) | 0 (0.0%) |
| 60 to 89 Minutes | 76 (11.6%) | 61 (9.7%) |
| 90 or more Minutes | 0 (0.0%) | 0 (0.0%) |
Time of Departure to Work by Sex in Hot Springs
The most frequent times of departure to work in Hot Springs are 7:30 AM to 7:59 AM (149, 22.7%) for males and 7:00 AM to 7:29 AM (104, 16.5%) for females.
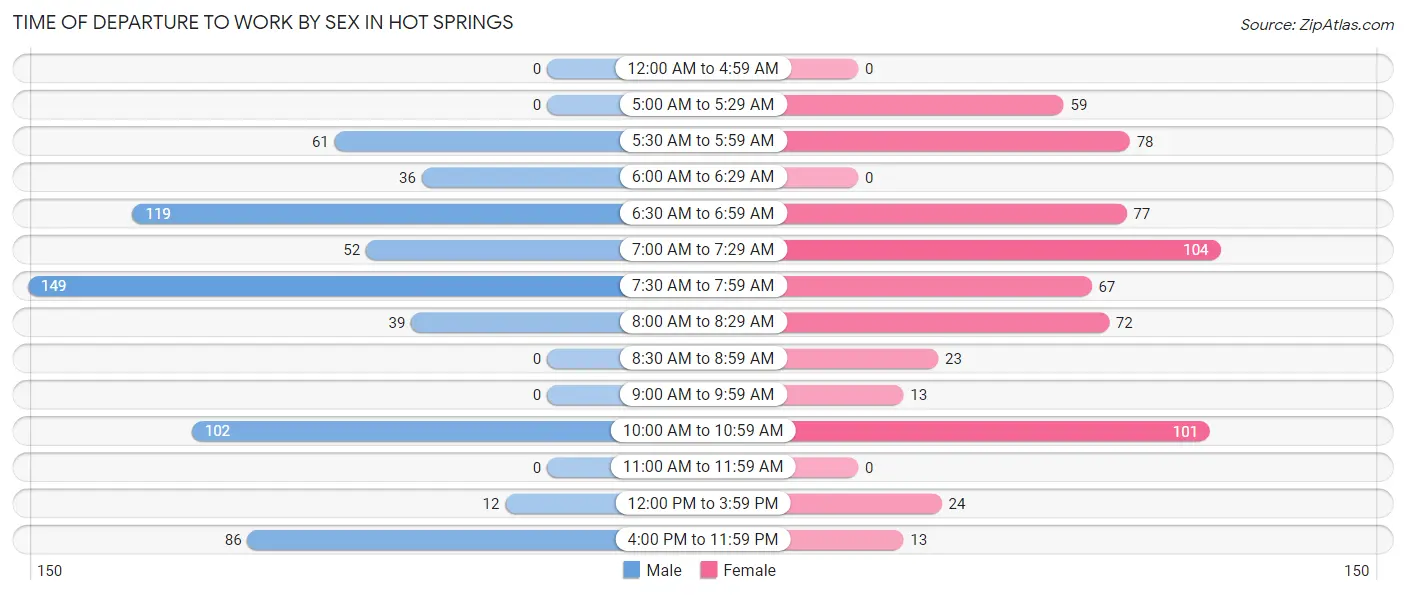
| Time of Departure | Male | Female |
| 12:00 AM to 4:59 AM | 0 (0.0%) | 0 (0.0%) |
| 5:00 AM to 5:29 AM | 0 (0.0%) | 59 (9.3%) |
| 5:30 AM to 5:59 AM | 61 (9.3%) | 78 (12.4%) |
| 6:00 AM to 6:29 AM | 36 (5.5%) | 0 (0.0%) |
| 6:30 AM to 6:59 AM | 119 (18.1%) | 77 (12.2%) |
| 7:00 AM to 7:29 AM | 52 (7.9%) | 104 (16.5%) |
| 7:30 AM to 7:59 AM | 149 (22.7%) | 67 (10.6%) |
| 8:00 AM to 8:29 AM | 39 (5.9%) | 72 (11.4%) |
| 8:30 AM to 8:59 AM | 0 (0.0%) | 23 (3.6%) |
| 9:00 AM to 9:59 AM | 0 (0.0%) | 13 (2.1%) |
| 10:00 AM to 10:59 AM | 102 (15.5%) | 101 (16.0%) |
| 11:00 AM to 11:59 AM | 0 (0.0%) | 0 (0.0%) |
| 12:00 PM to 3:59 PM | 12 (1.8%) | 24 (3.8%) |
| 4:00 PM to 11:59 PM | 86 (13.1%) | 13 (2.1%) |
| Total | 656 (100.0%) | 631 (100.0%) |
Housing Occupancy in Hot Springs
Occupancy by Ownership in Hot Springs
Of the total 1,697 dwellings in Hot Springs, owner-occupied units account for 1,083 (63.8%), while renter-occupied units make up 614 (36.2%).
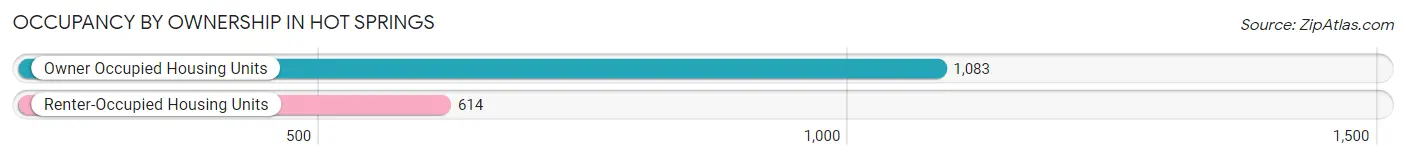
| Occupancy | # Housing Units | % Housing Units |
| Owner Occupied Housing Units | 1,083 | 63.8% |
| Renter-Occupied Housing Units | 614 | 36.2% |
| Total Occupied Housing Units | 1,697 | 100.0% |
Occupancy by Household Size in Hot Springs
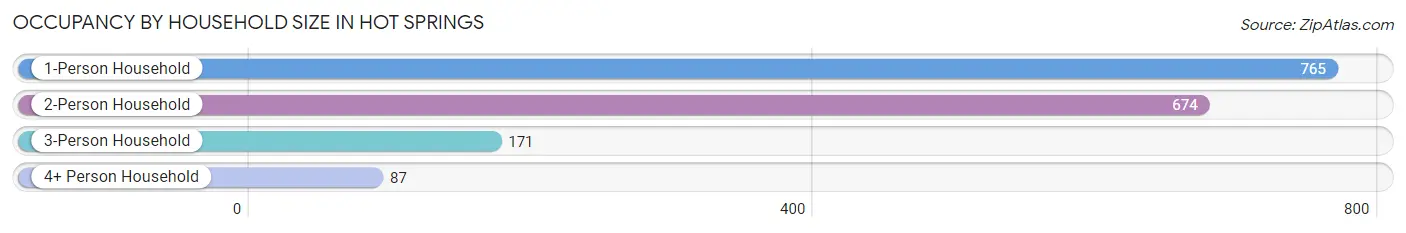
| Household Size | # Housing Units | % Housing Units |
| 1-Person Household | 765 | 45.1% |
| 2-Person Household | 674 | 39.7% |
| 3-Person Household | 171 | 10.1% |
| 4+ Person Household | 87 | 5.1% |
| Total Housing Units | 1,697 | 100.0% |
Occupancy by Ownership by Household Size in Hot Springs
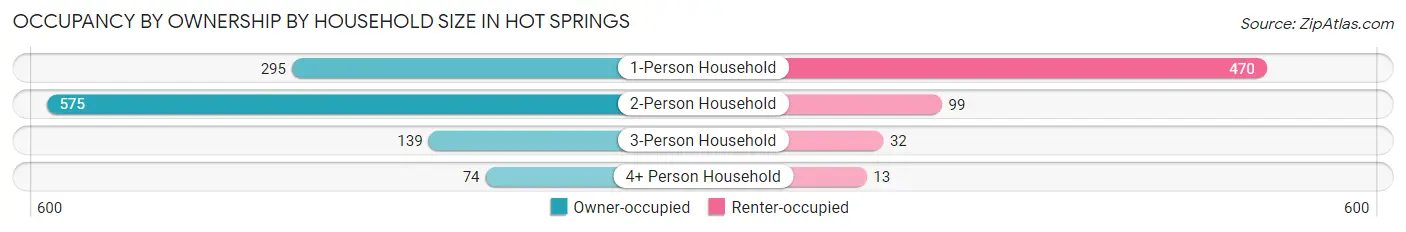
| Household Size | Owner-occupied | Renter-occupied |
| 1-Person Household | 295 (38.6%) | 470 (61.4%) |
| 2-Person Household | 575 (85.3%) | 99 (14.7%) |
| 3-Person Household | 139 (81.3%) | 32 (18.7%) |
| 4+ Person Household | 74 (85.1%) | 13 (14.9%) |
| Total Housing Units | 1,083 (63.8%) | 614 (36.2%) |
Occupancy by Educational Attainment in Hot Springs
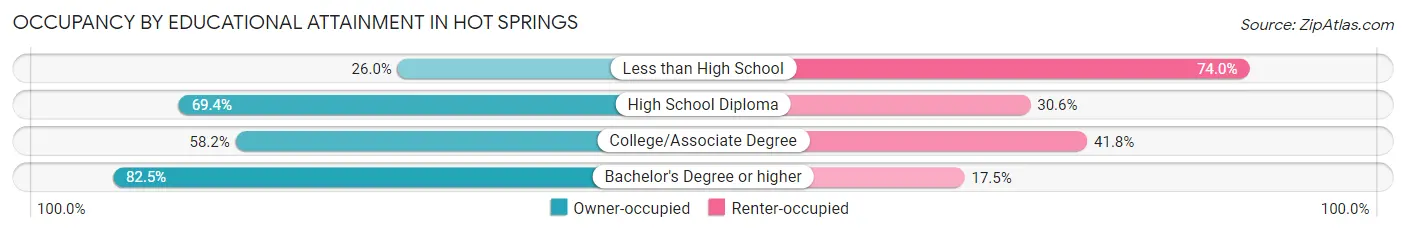
| Household Size | Owner-occupied | Renter-occupied |
| Less than High School | 44 (26.0%) | 125 (74.0%) |
| High School Diploma | 309 (69.4%) | 136 (30.6%) |
| College/Associate Degree | 391 (58.2%) | 281 (41.8%) |
| Bachelor's Degree or higher | 339 (82.5%) | 72 (17.5%) |
Occupancy by Age of Householder in Hot Springs
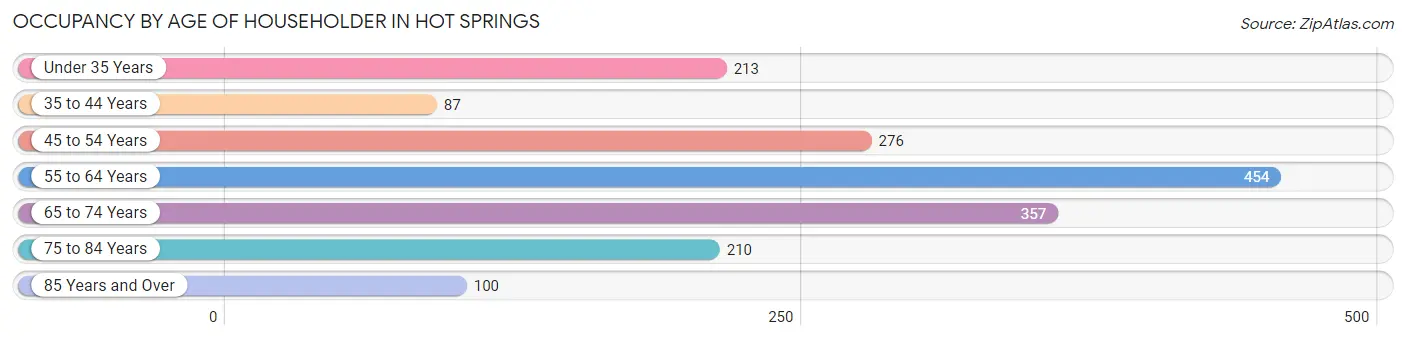
| Age Bracket | # Households | % Households |
| Under 35 Years | 213 | 12.6% |
| 35 to 44 Years | 87 | 5.1% |
| 45 to 54 Years | 276 | 16.3% |
| 55 to 64 Years | 454 | 26.8% |
| 65 to 74 Years | 357 | 21.0% |
| 75 to 84 Years | 210 | 12.4% |
| 85 Years and Over | 100 | 5.9% |
| Total | 1,697 | 100.0% |
Housing Finances in Hot Springs
Median Income by Occupancy in Hot Springs
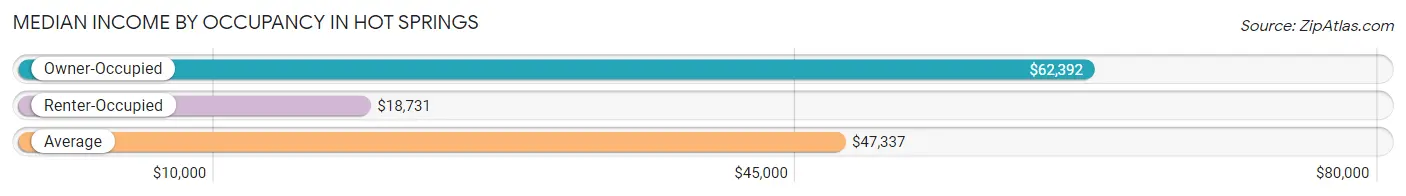
| Occupancy Type | # Households | Median Income |
| Owner-Occupied | 1,083 (63.8%) | $62,392 |
| Renter-Occupied | 614 (36.2%) | $18,731 |
| Average | 1,697 (100.0%) | $47,337 |
Occupancy by Householder Income Bracket in Hot Springs
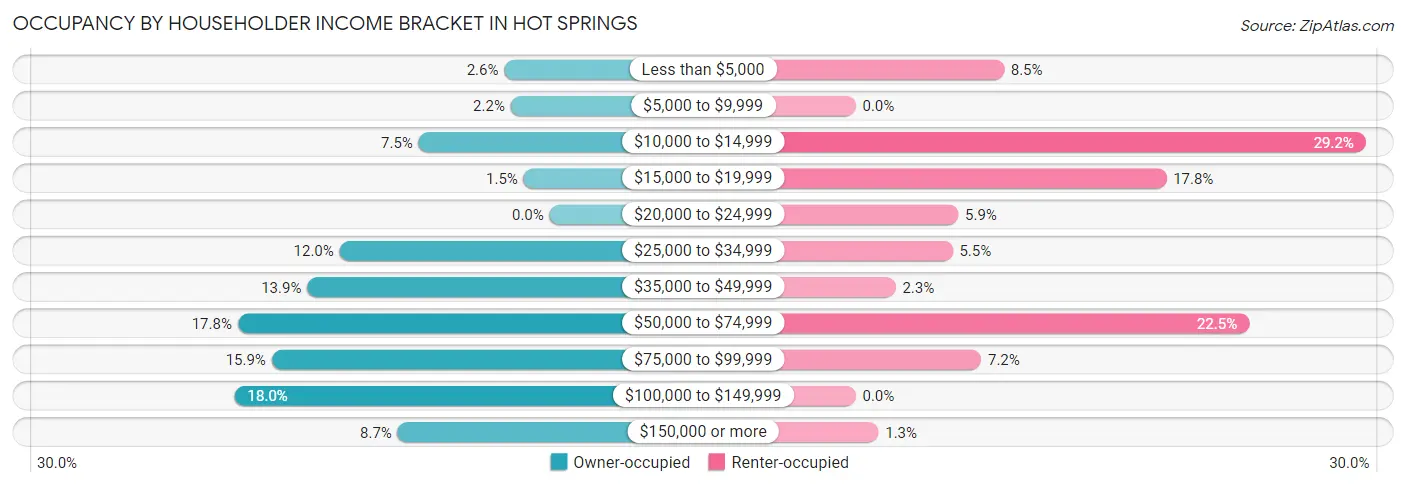
| Income Bracket | Owner-occupied | Renter-occupied |
| Less than $5,000 | 28 (2.6%) | 52 (8.5%) |
| $5,000 to $9,999 | 24 (2.2%) | 0 (0.0%) |
| $10,000 to $14,999 | 81 (7.5%) | 179 (29.1%) |
| $15,000 to $19,999 | 16 (1.5%) | 109 (17.7%) |
| $20,000 to $24,999 | 0 (0.0%) | 36 (5.9%) |
| $25,000 to $34,999 | 130 (12.0%) | 34 (5.5%) |
| $35,000 to $49,999 | 150 (13.9%) | 14 (2.3%) |
| $50,000 to $74,999 | 193 (17.8%) | 138 (22.5%) |
| $75,000 to $99,999 | 172 (15.9%) | 44 (7.2%) |
| $100,000 to $149,999 | 195 (18.0%) | 0 (0.0%) |
| $150,000 or more | 94 (8.7%) | 8 (1.3%) |
| Total | 1,083 (100.0%) | 614 (100.0%) |
Monthly Housing Cost Tiers in Hot Springs
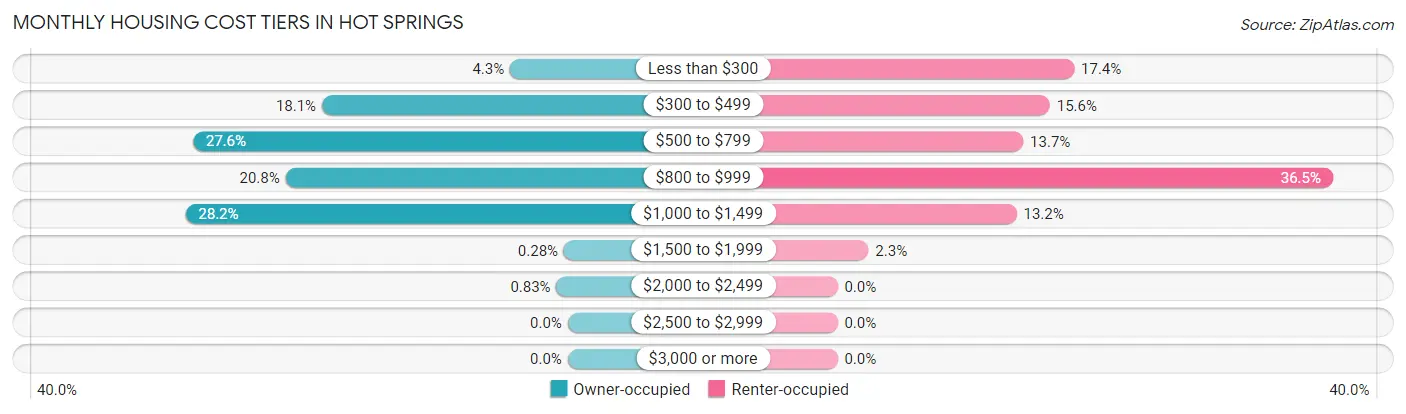
| Monthly Cost | Owner-occupied | Renter-occupied |
| Less than $300 | 46 (4.3%) | 107 (17.4%) |
| $300 to $499 | 196 (18.1%) | 96 (15.6%) |
| $500 to $799 | 299 (27.6%) | 84 (13.7%) |
| $800 to $999 | 225 (20.8%) | 224 (36.5%) |
| $1,000 to $1,499 | 305 (28.2%) | 81 (13.2%) |
| $1,500 to $1,999 | 3 (0.3%) | 14 (2.3%) |
| $2,000 to $2,499 | 9 (0.8%) | 0 (0.0%) |
| $2,500 to $2,999 | 0 (0.0%) | 0 (0.0%) |
| $3,000 or more | 0 (0.0%) | 0 (0.0%) |
| Total | 1,083 (100.0%) | 614 (100.0%) |
Physical Housing Characteristics in Hot Springs
Housing Structures in Hot Springs
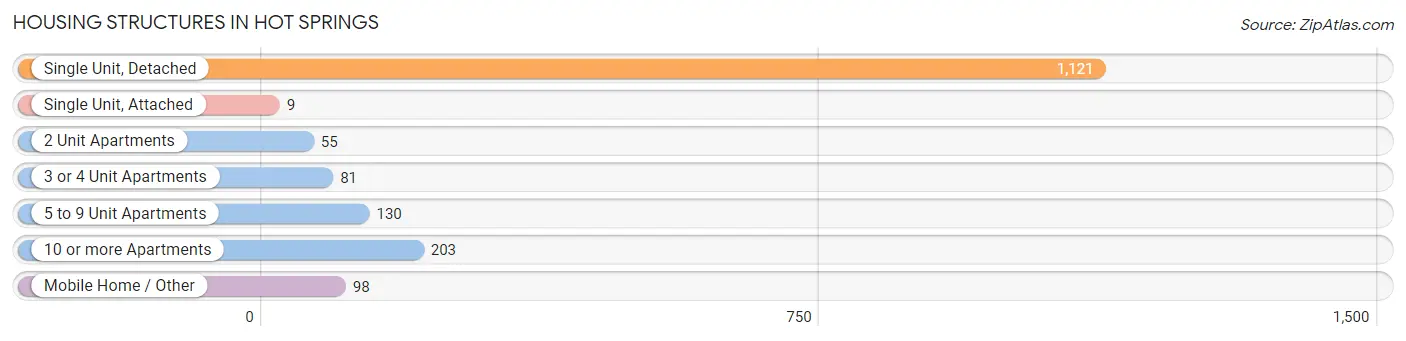
| Structure Type | # Housing Units | % Housing Units |
| Single Unit, Detached | 1,121 | 66.1% |
| Single Unit, Attached | 9 | 0.5% |
| 2 Unit Apartments | 55 | 3.2% |
| 3 or 4 Unit Apartments | 81 | 4.8% |
| 5 to 9 Unit Apartments | 130 | 7.7% |
| 10 or more Apartments | 203 | 12.0% |
| Mobile Home / Other | 98 | 5.8% |
| Total | 1,697 | 100.0% |
Housing Structures by Occupancy in Hot Springs
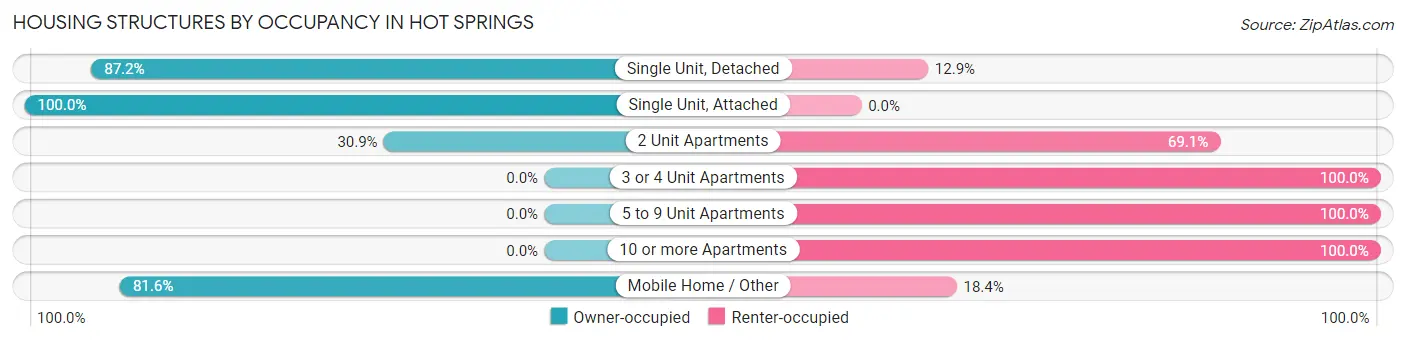
| Structure Type | Owner-occupied | Renter-occupied |
| Single Unit, Detached | 977 (87.2%) | 144 (12.9%) |
| Single Unit, Attached | 9 (100.0%) | 0 (0.0%) |
| 2 Unit Apartments | 17 (30.9%) | 38 (69.1%) |
| 3 or 4 Unit Apartments | 0 (0.0%) | 81 (100.0%) |
| 5 to 9 Unit Apartments | 0 (0.0%) | 130 (100.0%) |
| 10 or more Apartments | 0 (0.0%) | 203 (100.0%) |
| Mobile Home / Other | 80 (81.6%) | 18 (18.4%) |
| Total | 1,083 (63.8%) | 614 (36.2%) |
Housing Structures by Number of Rooms in Hot Springs
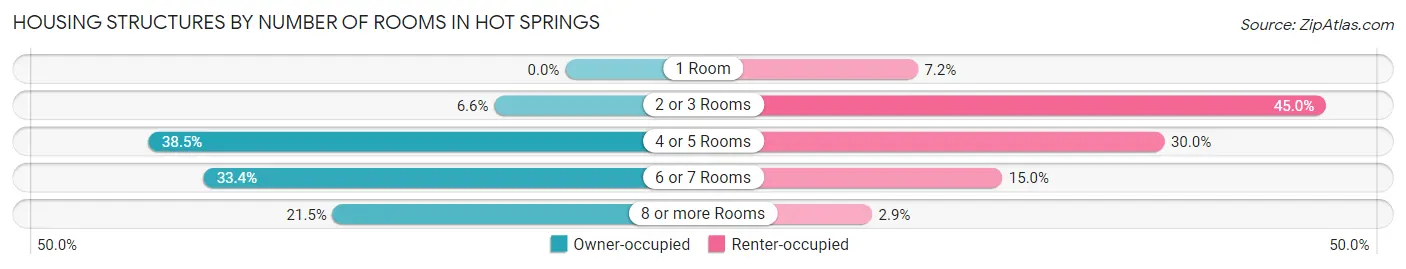
| Number of Rooms | Owner-occupied | Renter-occupied |
| 1 Room | 0 (0.0%) | 44 (7.2%) |
| 2 or 3 Rooms | 71 (6.6%) | 276 (45.0%) |
| 4 or 5 Rooms | 417 (38.5%) | 184 (30.0%) |
| 6 or 7 Rooms | 362 (33.4%) | 92 (15.0%) |
| 8 or more Rooms | 233 (21.5%) | 18 (2.9%) |
| Total | 1,083 (100.0%) | 614 (100.0%) |
Housing Structure by Heating Type in Hot Springs
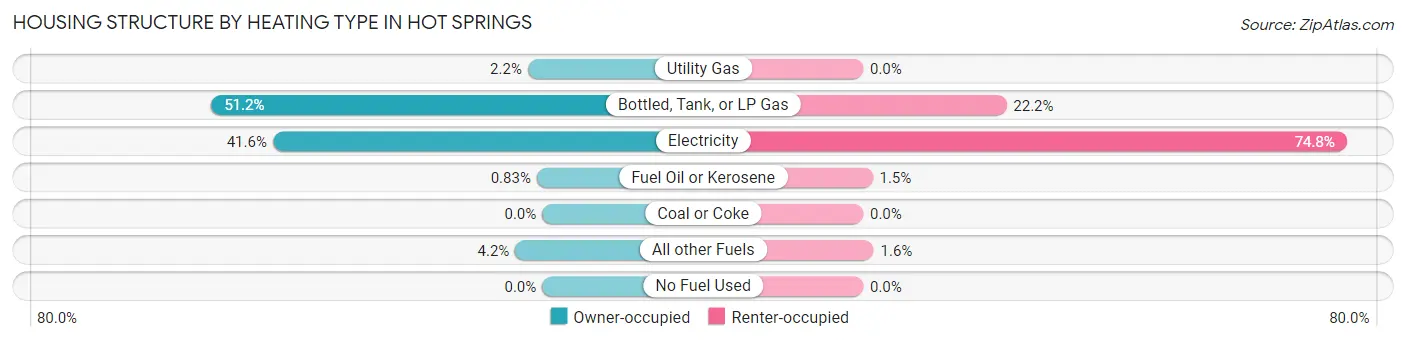
| Heating Type | Owner-occupied | Renter-occupied |
| Utility Gas | 24 (2.2%) | 0 (0.0%) |
| Bottled, Tank, or LP Gas | 554 (51.1%) | 136 (22.2%) |
| Electricity | 451 (41.6%) | 459 (74.8%) |
| Fuel Oil or Kerosene | 9 (0.8%) | 9 (1.5%) |
| Coal or Coke | 0 (0.0%) | 0 (0.0%) |
| All other Fuels | 45 (4.2%) | 10 (1.6%) |
| No Fuel Used | 0 (0.0%) | 0 (0.0%) |
| Total | 1,083 (100.0%) | 614 (100.0%) |
Household Vehicle Usage in Hot Springs
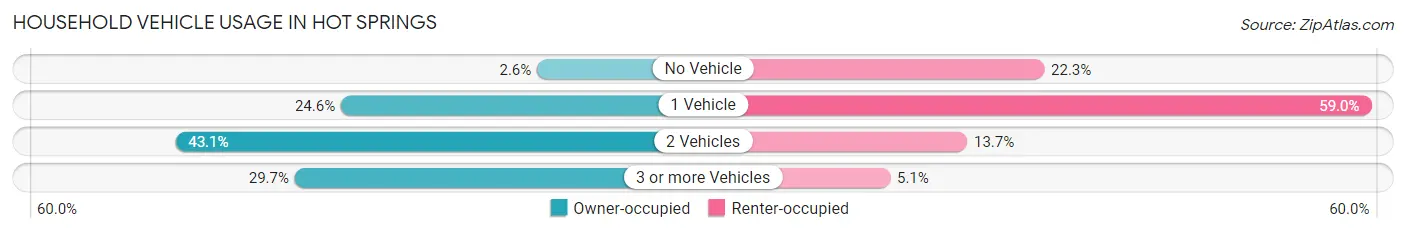
| Vehicles per Household | Owner-occupied | Renter-occupied |
| No Vehicle | 28 (2.6%) | 137 (22.3%) |
| 1 Vehicle | 266 (24.6%) | 362 (59.0%) |
| 2 Vehicles | 467 (43.1%) | 84 (13.7%) |
| 3 or more Vehicles | 322 (29.7%) | 31 (5.1%) |
| Total | 1,083 (100.0%) | 614 (100.0%) |
Real Estate & Mortgages in Hot Springs
Real Estate and Mortgage Overview in Hot Springs
| Characteristic | Without Mortgage | With Mortgage |
| Housing Units | 506 | 577 |
| Median Property Value | $153,500 | $143,400 |
| Median Household Income | $53,269 | $61 |
| Monthly Housing Costs | $543 | $0 |
| Real Estate Taxes | $1,915 | $0 |
Property Value by Mortgage Status in Hot Springs
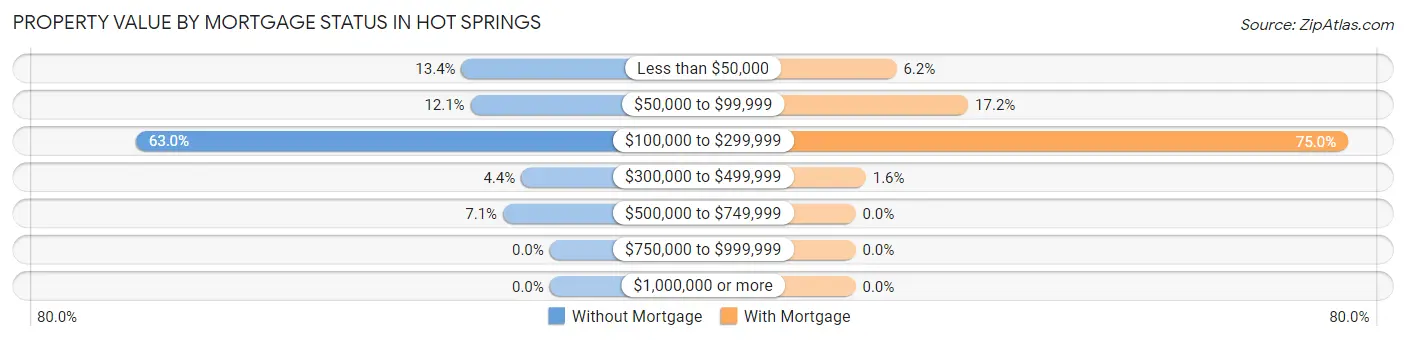
| Property Value | Without Mortgage | With Mortgage |
| Less than $50,000 | 68 (13.4%) | 36 (6.2%) |
| $50,000 to $99,999 | 61 (12.1%) | 99 (17.2%) |
| $100,000 to $299,999 | 319 (63.0%) | 433 (75.0%) |
| $300,000 to $499,999 | 22 (4.3%) | 9 (1.6%) |
| $500,000 to $749,999 | 36 (7.1%) | 0 (0.0%) |
| $750,000 to $999,999 | 0 (0.0%) | 0 (0.0%) |
| $1,000,000 or more | 0 (0.0%) | 0 (0.0%) |
| Total | 506 (100.0%) | 577 (100.0%) |
Household Income by Mortgage Status in Hot Springs
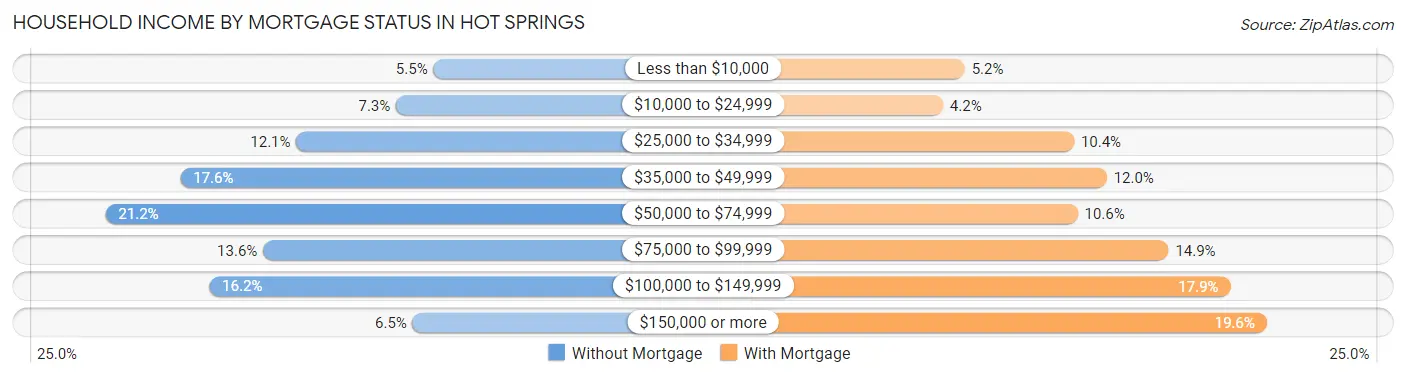
| Household Income | Without Mortgage | With Mortgage |
| Less than $10,000 | 28 (5.5%) | 30 (5.2%) |
| $10,000 to $24,999 | 37 (7.3%) | 24 (4.2%) |
| $25,000 to $34,999 | 61 (12.1%) | 60 (10.4%) |
| $35,000 to $49,999 | 89 (17.6%) | 69 (12.0%) |
| $50,000 to $74,999 | 107 (21.1%) | 61 (10.6%) |
| $75,000 to $99,999 | 69 (13.6%) | 86 (14.9%) |
| $100,000 to $149,999 | 82 (16.2%) | 103 (17.8%) |
| $150,000 or more | 33 (6.5%) | 113 (19.6%) |
| Total | 506 (100.0%) | 577 (100.0%) |
Property Value to Household Income Ratio in Hot Springs
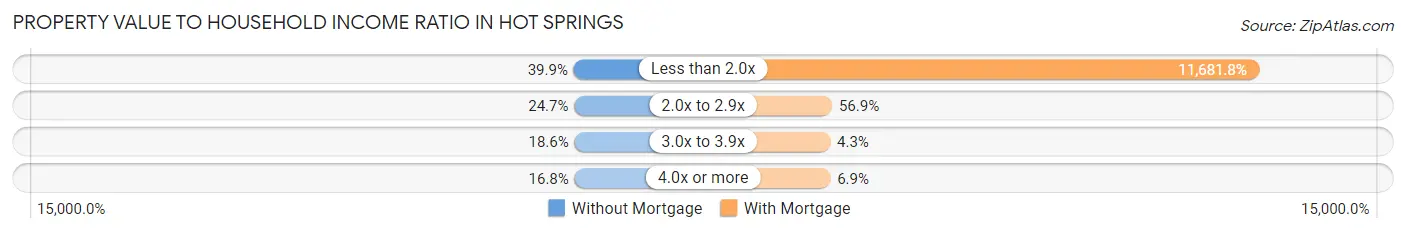
| Value-to-Income Ratio | Without Mortgage | With Mortgage |
| Less than 2.0x | 202 (39.9%) | 67,404 (11,681.8%) |
| 2.0x to 2.9x | 125 (24.7%) | 328 (56.9%) |
| 3.0x to 3.9x | 94 (18.6%) | 25 (4.3%) |
| 4.0x or more | 85 (16.8%) | 40 (6.9%) |
| Total | 506 (100.0%) | 577 (100.0%) |
Real Estate Taxes by Mortgage Status in Hot Springs
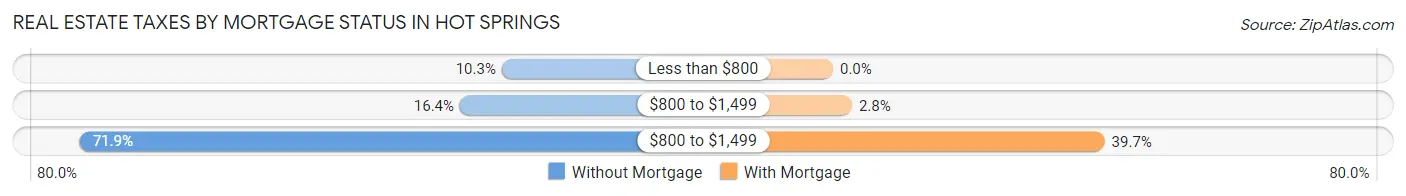
| Property Taxes | Without Mortgage | With Mortgage |
| Less than $800 | 52 (10.3%) | 0 (0.0%) |
| $800 to $1,499 | 83 (16.4%) | 16 (2.8%) |
| $800 to $1,499 | 364 (71.9%) | 229 (39.7%) |
| Total | 506 (100.0%) | 577 (100.0%) |
Health & Disability in Hot Springs
Health Insurance Coverage by Age in Hot Springs
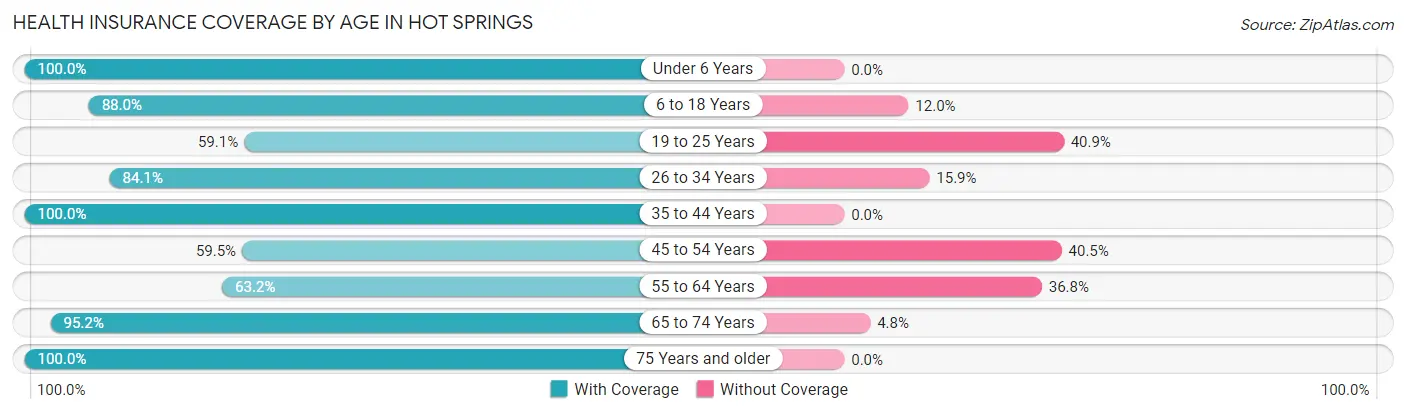
| Age Bracket | With Coverage | Without Coverage |
| Under 6 Years | 159 (100.0%) | 0 (0.0%) |
| 6 to 18 Years | 265 (88.0%) | 36 (12.0%) |
| 19 to 25 Years | 104 (59.1%) | 72 (40.9%) |
| 26 to 34 Years | 382 (84.1%) | 72 (15.9%) |
| 35 to 44 Years | 181 (100.0%) | 0 (0.0%) |
| 45 to 54 Years | 223 (59.5%) | 152 (40.5%) |
| 55 to 64 Years | 379 (63.2%) | 221 (36.8%) |
| 65 to 74 Years | 491 (95.2%) | 25 (4.8%) |
| 75 Years and older | 465 (100.0%) | 0 (0.0%) |
| Total | 2,649 (82.1%) | 578 (17.9%) |
Health Insurance Coverage by Citizenship Status in Hot Springs
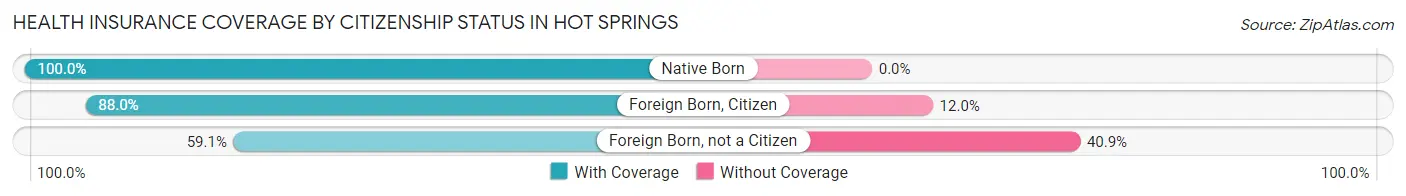
| Citizenship Status | With Coverage | Without Coverage |
| Native Born | 159 (100.0%) | 0 (0.0%) |
| Foreign Born, Citizen | 265 (88.0%) | 36 (12.0%) |
| Foreign Born, not a Citizen | 104 (59.1%) | 72 (40.9%) |
Health Insurance Coverage by Household Income in Hot Springs
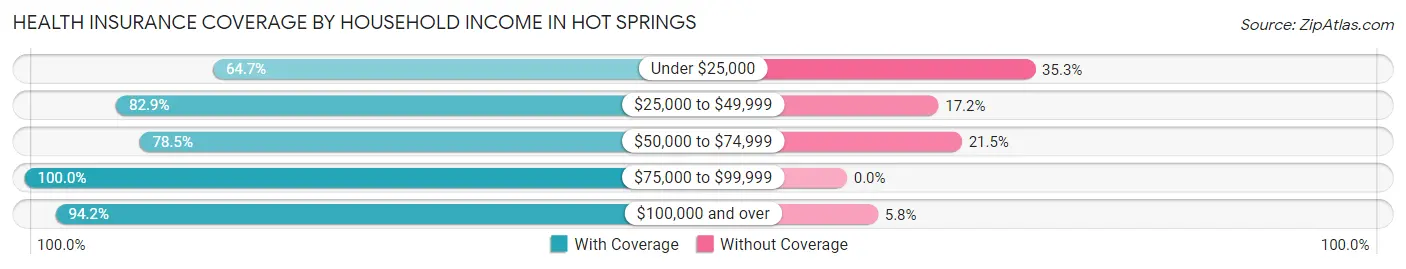
| Household Income | With Coverage | Without Coverage |
| Under $25,000 | 541 (64.7%) | 295 (35.3%) |
| $25,000 to $49,999 | 570 (82.9%) | 118 (17.2%) |
| $50,000 to $74,999 | 441 (78.5%) | 121 (21.5%) |
| $75,000 to $99,999 | 353 (100.0%) | 0 (0.0%) |
| $100,000 and over | 714 (94.2%) | 44 (5.8%) |
Public vs Private Health Insurance Coverage by Age in Hot Springs
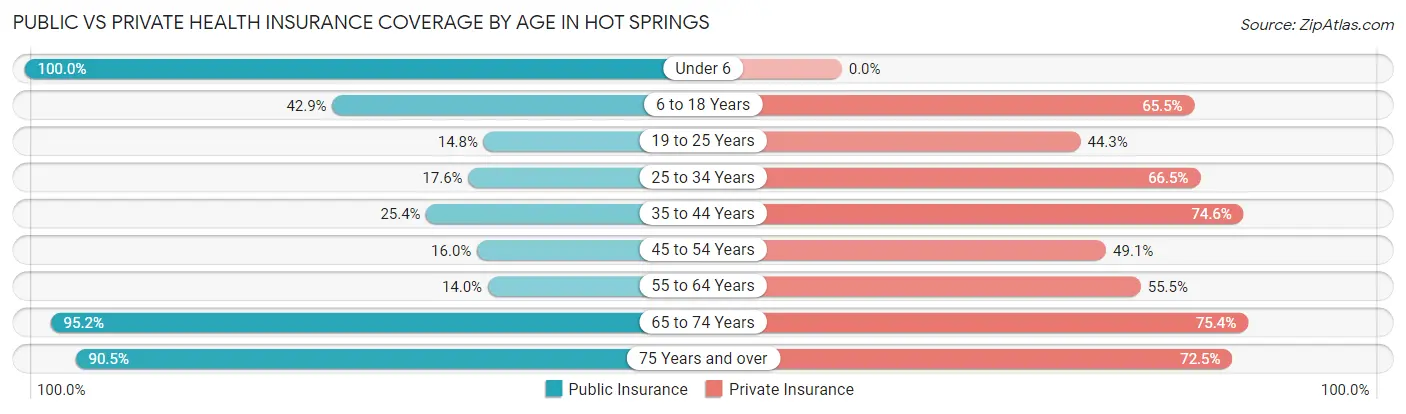
| Age Bracket | Public Insurance | Private Insurance |
| Under 6 | 159 (100.0%) | 0 (0.0%) |
| 6 to 18 Years | 129 (42.9%) | 197 (65.4%) |
| 19 to 25 Years | 26 (14.8%) | 78 (44.3%) |
| 25 to 34 Years | 80 (17.6%) | 302 (66.5%) |
| 35 to 44 Years | 46 (25.4%) | 135 (74.6%) |
| 45 to 54 Years | 60 (16.0%) | 184 (49.1%) |
| 55 to 64 Years | 84 (14.0%) | 333 (55.5%) |
| 65 to 74 Years | 491 (95.2%) | 389 (75.4%) |
| 75 Years and over | 421 (90.5%) | 337 (72.5%) |
| Total | 1,496 (46.4%) | 1,955 (60.6%) |
Disability Status by Sex by Age in Hot Springs
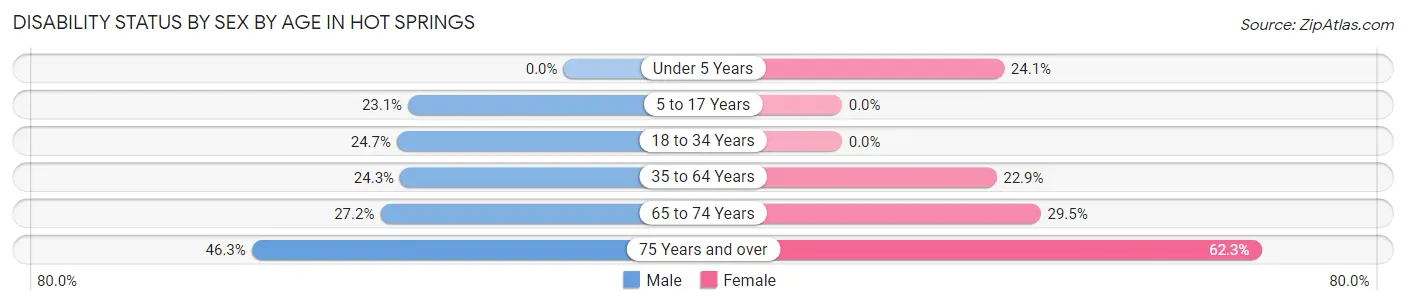
| Age Bracket | Male | Female |
| Under 5 Years | 0 (0.0%) | 13 (24.1%) |
| 5 to 17 Years | 45 (23.1%) | 0 (0.0%) |
| 18 to 34 Years | 69 (24.7%) | 0 (0.0%) |
| 35 to 64 Years | 142 (24.3%) | 131 (22.9%) |
| 65 to 74 Years | 62 (27.2%) | 85 (29.5%) |
| 75 Years and over | 106 (46.3%) | 147 (62.3%) |
Disability Class by Sex by Age in Hot Springs
Disability Class: Hearing Difficulty
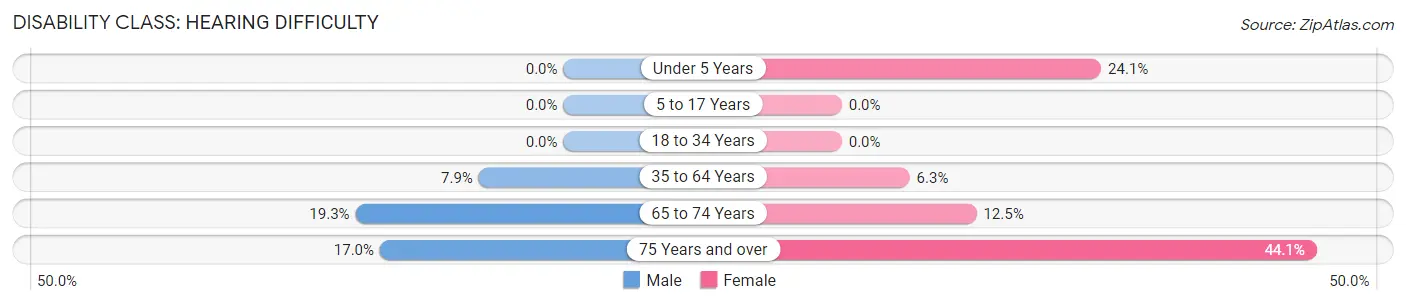
| Age Bracket | Male | Female |
| Under 5 Years | 0 (0.0%) | 13 (24.1%) |
| 5 to 17 Years | 0 (0.0%) | 0 (0.0%) |
| 18 to 34 Years | 0 (0.0%) | 0 (0.0%) |
| 35 to 64 Years | 46 (7.9%) | 36 (6.3%) |
| 65 to 74 Years | 44 (19.3%) | 36 (12.5%) |
| 75 Years and over | 39 (17.0%) | 104 (44.1%) |
Disability Class: Vision Difficulty
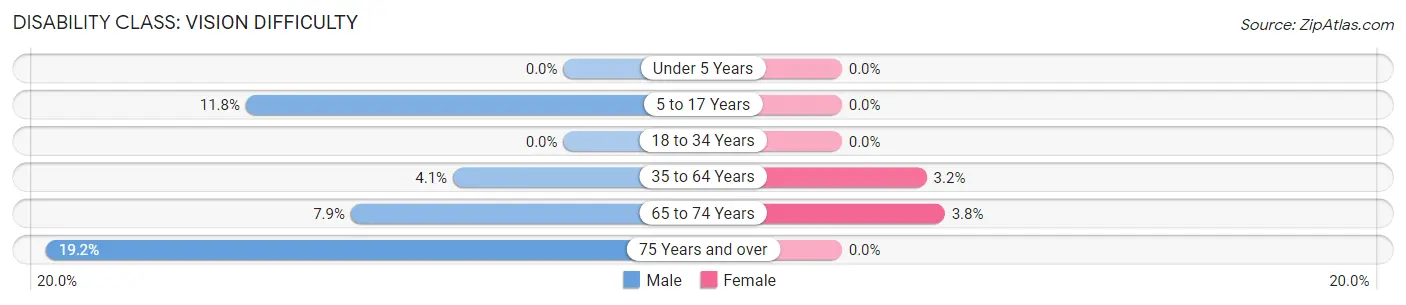
| Age Bracket | Male | Female |
| Under 5 Years | 0 (0.0%) | 0 (0.0%) |
| 5 to 17 Years | 23 (11.8%) | 0 (0.0%) |
| 18 to 34 Years | 0 (0.0%) | 0 (0.0%) |
| 35 to 64 Years | 24 (4.1%) | 18 (3.2%) |
| 65 to 74 Years | 18 (7.9%) | 11 (3.8%) |
| 75 Years and over | 44 (19.2%) | 0 (0.0%) |
Disability Class: Cognitive Difficulty
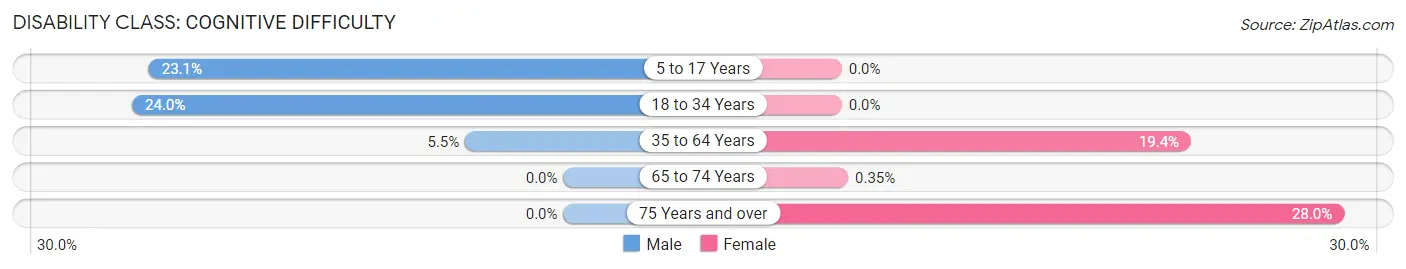
| Age Bracket | Male | Female |
| 5 to 17 Years | 45 (23.1%) | 0 (0.0%) |
| 18 to 34 Years | 67 (24.0%) | 0 (0.0%) |
| 35 to 64 Years | 32 (5.5%) | 111 (19.4%) |
| 65 to 74 Years | 0 (0.0%) | 1 (0.4%) |
| 75 Years and over | 0 (0.0%) | 66 (28.0%) |
Disability Class: Ambulatory Difficulty
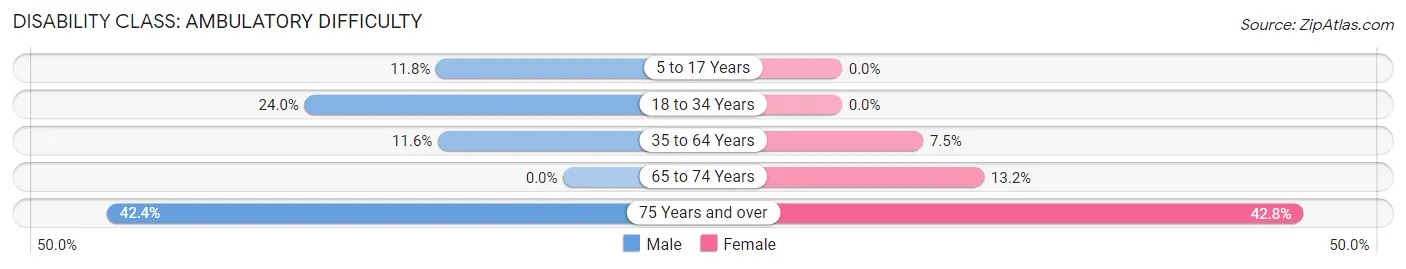
| Age Bracket | Male | Female |
| 5 to 17 Years | 23 (11.8%) | 0 (0.0%) |
| 18 to 34 Years | 67 (24.0%) | 0 (0.0%) |
| 35 to 64 Years | 68 (11.6%) | 43 (7.5%) |
| 65 to 74 Years | 0 (0.0%) | 38 (13.2%) |
| 75 Years and over | 97 (42.4%) | 101 (42.8%) |
Disability Class: Self-Care Difficulty
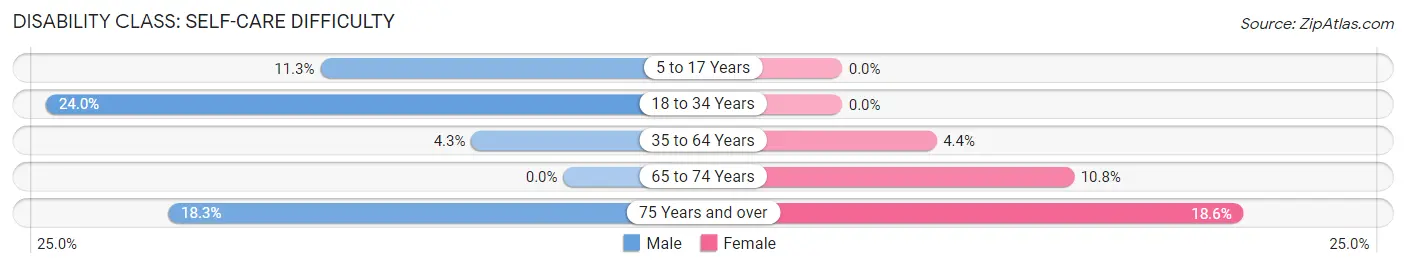
| Age Bracket | Male | Female |
| 5 to 17 Years | 22 (11.3%) | 0 (0.0%) |
| 18 to 34 Years | 67 (24.0%) | 0 (0.0%) |
| 35 to 64 Years | 25 (4.3%) | 25 (4.4%) |
| 65 to 74 Years | 0 (0.0%) | 31 (10.8%) |
| 75 Years and over | 42 (18.3%) | 44 (18.6%) |
Technology Access in Hot Springs
Computing Device Access in Hot Springs
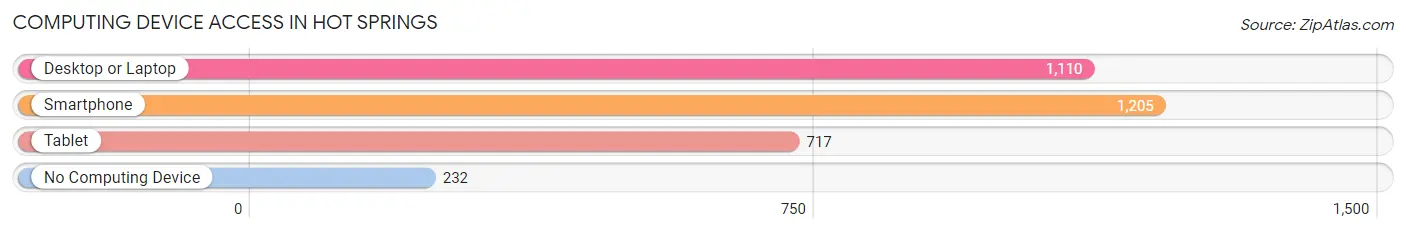
| Device Type | # Households | % Households |
| Desktop or Laptop | 1,110 | 65.4% |
| Smartphone | 1,205 | 71.0% |
| Tablet | 717 | 42.2% |
| No Computing Device | 232 | 13.7% |
| Total | 1,697 | 100.0% |
Internet Access in Hot Springs
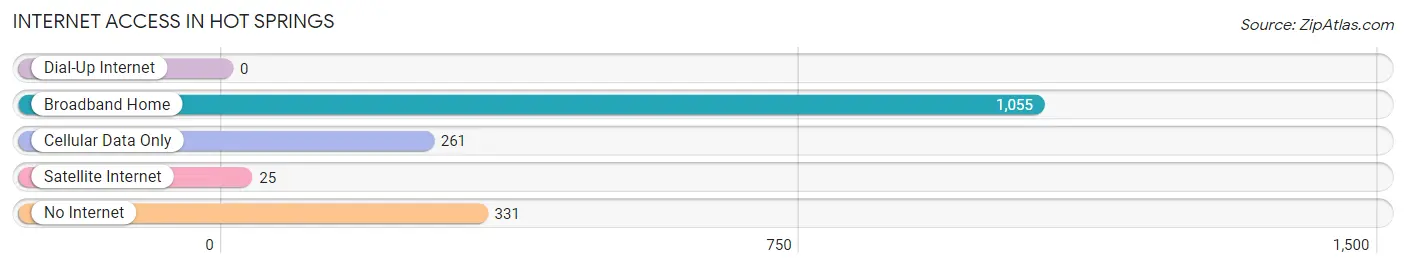
| Internet Type | # Households | % Households |
| Dial-Up Internet | 0 | 0.0% |
| Broadband Home | 1,055 | 62.2% |
| Cellular Data Only | 261 | 15.4% |
| Satellite Internet | 25 | 1.5% |
| No Internet | 331 | 19.5% |
| Total | 1,697 | 100.0% |
Hot Springs Summary
History
Hot Springs, South Dakota is a small city located in the southwestern part of the state. It is the county seat of Fall River County and is situated in the Black Hills region of the state. The city was founded in 1883 by Dr. Valentine McGillycuddy, a physician and Indian agent for the U.S. government. He named the city after the natural hot springs that were located in the area.
The city was originally a small settlement of log cabins and tents, but it quickly grew as people from all over the country came to take advantage of the healing properties of the hot springs. The city was incorporated in 1885 and soon became a popular destination for tourists. Hot Springs was also a popular destination for health seekers, as the hot springs were believed to have healing properties.
The city was also a popular destination for gamblers, as it was home to several casinos. In the early 1900s, Hot Springs was known as the “Gambling Capital of the West” and was home to some of the most famous casinos in the country.
In the late 1800s and early 1900s, Hot Springs was also a popular destination for outlaws and criminals. The city was home to several notorious outlaws, including Butch Cassidy and the Sundance Kid.
Geography
Hot Springs is located in the southwestern part of South Dakota, in the Black Hills region. The city is situated in the Fall River Valley, which is surrounded by the Black Hills National Forest. The city is located at an elevation of 4,500 feet and is approximately 40 miles from Rapid City, the largest city in the region.
The city is located in a semi-arid climate, with hot summers and cold winters. The average annual temperature is around 50 degrees Fahrenheit, with temperatures ranging from the low 20s in the winter to the high 80s in the summer.
Economy
Hot Springs is a small city with a population of just over 3,000 people. The city’s economy is largely based on tourism, as it is a popular destination for visitors from all over the country. The city is home to several tourist attractions, including the Hot Springs State Park, the Mammoth Site, and the Black Hills Wild Horse Sanctuary.
The city is also home to several businesses, including restaurants, hotels, and retail stores. The city is also home to several manufacturing companies, including a furniture factory and a plastics factory.
Demographics
As of the 2010 census, the population of Hot Springs was 3,071. The racial makeup of the city was 94.3% White, 0.7% African American, 0.7% Native American, 0.3% Asian, 0.1% Pacific Islander, and 3.9% from two or more races. The median household income was $37,917, and the median family income was $45,938. The per capita income was $20,945. The poverty rate was 16.2%.
Common Questions
What is the Total Population of Hot Springs?
Total Population of Hot Springs is 3,465.
What is the Total Male Population of Hot Springs?
Total Male Population of Hot Springs is 1,727.
What is the Total Female Population of Hot Springs?
Total Female Population of Hot Springs is 1,738.
What is the Ratio of Males per 100 Females in Hot Springs?
There are 99.37 Males per 100 Females in Hot Springs.
What is the Ratio of Females per 100 Males in Hot Springs?
There are 100.64 Females per 100 Males in Hot Springs.
What is the Median Population Age in Hot Springs?
Median Population Age in Hot Springs is 56.3 Years.
What is the Average Family Size in Hot Springs
Average Family Size in Hot Springs is 2.6 People.
What is the Average Household Size in Hot Springs
Average Household Size in Hot Springs is 1.9 People.
What is Per Capita Income in Hot Springs?
Per Capita income in Hot Springs is $33,368.
What is the Median Family Income in Hot Springs?
Median Family Income in Hot Springs is $60,972.
What is the Median Household income in Hot Springs?
Median Household Income in Hot Springs is $47,337.
What is Income or Wage Gap in Hot Springs?
Income or Wage Gap in Hot Springs is 38.3%.
Women in Hot Springs earn 61.7 cents for every dollar earned by a man.
What is Family Income Deficit in Hot Springs?
Family Income Deficit in Hot Springs is $8,896.
Families that are below poverty line in Hot Springs earn $8,896 less on average than the poverty threshold level.
What is Inequality or Gini Index in Hot Springs?
Inequality or Gini Index in Hot Springs is 0.47.
How Large is the Labor Force in Hot Springs?
There are 1,552 People in the Labor Forcein in Hot Springs.
What is the Percentage of People in the Labor Force in Hot Springs?
50.7% of People are in the Labor Force in Hot Springs.
What is the Unemployment Rate in Hot Springs?
Unemployment Rate in Hot Springs is 3.1%.