Cities with the Highest Percentage of European Population in South Dakota
RELATED REPORTS & OPTIONS
European
South Dakota
Compare Cities
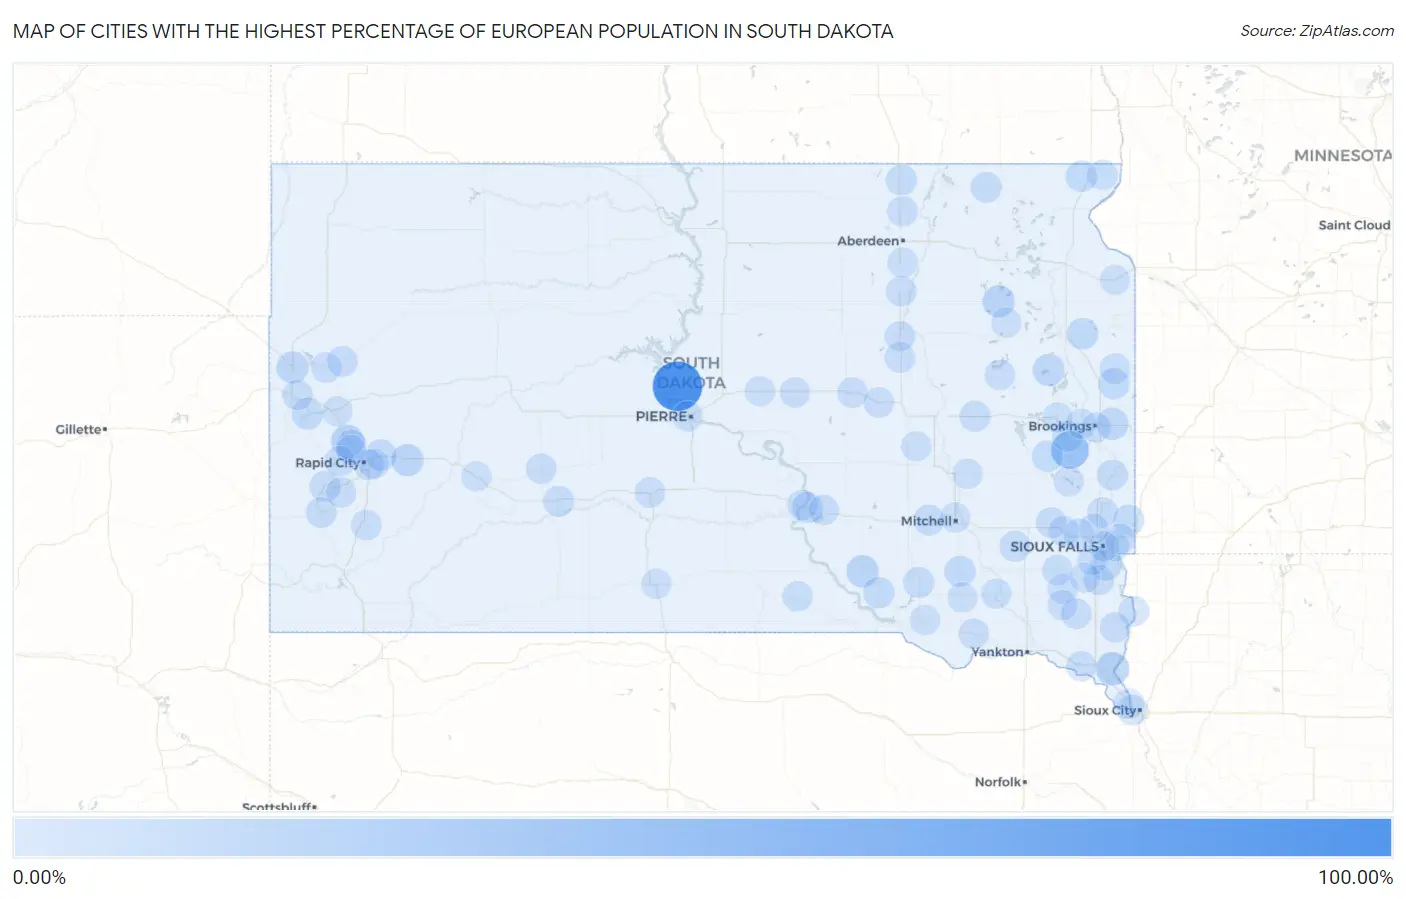
Map of Cities with the Highest Percentage of European Population in South Dakota
0.00%
100.00%
Cities with the Highest Percentage of European Population in South Dakota
| City | European | vs State | vs National | |
| 1. | Cow Creek | 82.43% | 1.24%(+81.2)#1 | 1.67%(+80.8)#10 |
| 2. | Smithwick | 47.37% | 1.24%(+46.1)#2 | 1.67%(+45.7)#40 |
| 3. | Crook | 38.58% | 1.24%(+37.3)#3 | 1.67%(+36.9)#57 |
| 4. | Nunda | 31.11% | 1.24%(+29.9)#4 | 1.67%(+29.4)#71 |
| 5. | Richland | 13.69% | 1.24%(+12.4)#5 | 1.67%(+12.0)#374 |
| 6. | Piedmont | 12.27% | 1.24%(+11.0)#6 | 1.67%(+10.6)#449 |
| 7. | Platte | 9.39% | 1.24%(+8.15)#7 | 1.67%(+7.72)#735 |
| 8. | New Underwood | 9.06% | 1.24%(+7.82)#8 | 1.67%(+7.38)#782 |
| 9. | Bradley | 8.51% | 1.24%(+7.27)#9 | 1.67%(+6.84)#871 |
| 10. | Hayti | 8.13% | 1.24%(+6.89)#10 | 1.67%(+6.46)#947 |
| 11. | Bushnell | 8.00% | 1.24%(+6.76)#11 | 1.67%(+6.33)#965 |
| 12. | Belle Fourche | 7.88% | 1.24%(+6.64)#12 | 1.67%(+6.21)#992 |
| 13. | Deadwood | 6.11% | 1.24%(+4.87)#13 | 1.67%(+4.44)#1,487 |
| 14. | Wonderland Homes | 5.89% | 1.24%(+4.65)#14 | 1.67%(+4.22)#1,578 |
| 15. | Kranzburg | 5.69% | 1.24%(+4.45)#15 | 1.67%(+4.01)#1,672 |
| 16. | New Effington | 5.26% | 1.24%(+4.02)#16 | 1.67%(+3.59)#1,917 |
| 17. | Geddes | 5.07% | 1.24%(+3.83)#17 | 1.67%(+3.40)#2,035 |
| 18. | Parkston | 5.04% | 1.24%(+3.80)#18 | 1.67%(+3.37)#2,054 |
| 19. | Harrisburg | 4.92% | 1.24%(+3.68)#19 | 1.67%(+3.24)#2,132 |
| 20. | Toronto | 4.69% | 1.24%(+3.45)#20 | 1.67%(+3.01)#2,278 |
| 21. | Box Elder | 4.68% | 1.24%(+3.44)#21 | 1.67%(+3.00)#2,287 |
| 22. | Ramona | 4.58% | 1.24%(+3.34)#22 | 1.67%(+2.90)#2,359 |
| 23. | Chamberlain | 4.53% | 1.24%(+3.29)#23 | 1.67%(+2.86)#2,412 |
| 24. | Garretson | 4.13% | 1.24%(+2.89)#24 | 1.67%(+2.46)#2,810 |
| 25. | Sinai | 4.02% | 1.24%(+2.78)#25 | 1.67%(+2.35)#2,932 |
| 26. | Bridgewater | 3.98% | 1.24%(+2.74)#26 | 1.67%(+2.31)#2,981 |
| 27. | Hill City | 3.97% | 1.24%(+2.73)#27 | 1.67%(+2.29)#2,995 |
| 28. | Armour | 3.89% | 1.24%(+2.65)#28 | 1.67%(+2.22)#3,092 |
| 29. | Iroquois | 3.78% | 1.24%(+2.54)#29 | 1.67%(+2.11)#3,248 |
| 30. | Mount Vernon | 3.73% | 1.24%(+2.48)#30 | 1.67%(+2.05)#3,318 |
| 31. | Kadoka | 3.63% | 1.24%(+2.39)#31 | 1.67%(+1.95)#3,448 |
| 32. | Britton | 3.25% | 1.24%(+2.01)#32 | 1.67%(+1.57)#4,008 |
| 33. | Frederick | 3.23% | 1.24%(+1.98)#33 | 1.67%(+1.55)#4,043 |
| 34. | Custer | 3.18% | 1.24%(+1.94)#34 | 1.67%(+1.51)#4,119 |
| 35. | Egan | 3.02% | 1.24%(+1.78)#35 | 1.67%(+1.34)#4,434 |
| 36. | Montrose | 2.76% | 1.24%(+1.52)#36 | 1.67%(+1.09)#4,987 |
| 37. | Fairburn | 2.70% | 1.24%(+1.46)#37 | 1.67%(+1.03)#5,132 |
| 38. | Murdo | 2.66% | 1.24%(+1.42)#38 | 1.67%(+0.990)#5,217 |
| 39. | Baltic | 2.57% | 1.24%(+1.33)#39 | 1.67%(+0.895)#5,470 |
| 40. | Willow Lake | 2.50% | 1.24%(+1.26)#40 | 1.67%(+0.826)#5,660 |
| 41. | Summerset | 2.47% | 1.24%(+1.23)#41 | 1.67%(+0.800)#5,739 |
| 42. | Pine Lakes Addition | 2.46% | 1.24%(+1.21)#42 | 1.67%(+0.782)#5,799 |
| 43. | Newell | 2.45% | 1.24%(+1.21)#43 | 1.67%(+0.780)#5,805 |
| 44. | Parker | 2.43% | 1.24%(+1.19)#44 | 1.67%(+0.756)#5,877 |
| 45. | Westport | 2.41% | 1.24%(+1.17)#45 | 1.67%(+0.735)#5,948 |
| 46. | Brandt | 2.40% | 1.24%(+1.16)#46 | 1.67%(+0.726)#5,981 |
| 47. | Centerville | 2.36% | 1.24%(+1.12)#47 | 1.67%(+0.690)#6,090 |
| 48. | St Lawrence | 2.31% | 1.24%(+1.07)#48 | 1.67%(+0.638)#6,254 |
| 49. | Mellette | 2.27% | 1.24%(+1.03)#49 | 1.67%(+0.598)#6,400 |
| 50. | Oacoma | 2.22% | 1.24%(+0.975)#50 | 1.67%(+0.542)#6,574 |
| 51. | Dakota Dunes | 2.20% | 1.24%(+0.960)#51 | 1.67%(+0.527)#6,624 |
| 52. | Tyndall | 2.20% | 1.24%(+0.955)#52 | 1.67%(+0.522)#6,656 |
| 53. | Nisland | 2.09% | 1.24%(+0.850)#53 | 1.67%(+0.418)#7,031 |
| 54. | Tulare | 2.07% | 1.24%(+0.831)#54 | 1.67%(+0.398)#7,097 |
| 55. | Philip | 1.99% | 1.24%(+0.746)#55 | 1.67%(+0.314)#7,411 |
| 56. | Rapid City | 1.90% | 1.24%(+0.658)#56 | 1.67%(+0.226)#7,737 |
| 57. | Worthing | 1.84% | 1.24%(+0.602)#57 | 1.67%(+0.170)#7,975 |
| 58. | Brandon | 1.80% | 1.24%(+0.562)#58 | 1.67%(+0.130)#8,143 |
| 59. | Humboldt | 1.78% | 1.24%(+0.535)#59 | 1.67%(+0.103)#8,267 |
| 60. | Hudson | 1.74% | 1.24%(+0.493)#60 | 1.67%(+0.061)#8,446 |
| 61. | Pukwana | 1.71% | 1.24%(+0.465)#61 | 1.67%(+0.032)#8,586 |
| 62. | Fort Pierre | 1.70% | 1.24%(+0.463)#62 | 1.67%(+0.031)#8,590 |
| 63. | Olivet | 1.67% | 1.24%(+0.425)#63 | 1.67%(-0.008)#8,760 |
| 64. | Spearfish | 1.66% | 1.24%(+0.421)#64 | 1.67%(-0.011)#8,769 |
| 65. | Keystone | 1.56% | 1.24%(+0.317)#65 | 1.67%(-0.116)#9,283 |
| 66. | Alcester | 1.54% | 1.24%(+0.300)#66 | 1.67%(-0.133)#9,366 |
| 67. | Johnson Siding | 1.52% | 1.24%(+0.278)#67 | 1.67%(-0.155)#9,465 |
| 68. | Gregory | 1.51% | 1.24%(+0.266)#68 | 1.67%(-0.167)#9,523 |
| 69. | Wessington | 1.48% | 1.24%(+0.236)#69 | 1.67%(-0.196)#9,675 |
| 70. | Redfield | 1.46% | 1.24%(+0.223)#70 | 1.67%(-0.210)#9,738 |
| 71. | Highmore | 1.44% | 1.24%(+0.198)#71 | 1.67%(-0.235)#9,862 |
| 72. | Hartford | 1.44% | 1.24%(+0.195)#72 | 1.67%(-0.237)#9,876 |
| 73. | Rosholt | 1.42% | 1.24%(+0.175)#73 | 1.67%(-0.258)#9,997 |
| 74. | Vermillion | 1.41% | 1.24%(+0.164)#74 | 1.67%(-0.269)#10,056 |
| 75. | Rapid Valley | 1.37% | 1.24%(+0.123)#75 | 1.67%(-0.309)#10,286 |
| 76. | Mission | 1.35% | 1.24%(+0.112)#76 | 1.67%(-0.321)#10,357 |
| 77. | Hurley | 1.27% | 1.24%(+0.030)#77 | 1.67%(-0.402)#10,821 |
| 78. | Volga | 1.17% | 1.24%(-0.067)#78 | 1.67%(-0.500)#11,364 |
| 79. | Sioux Falls | 1.15% | 1.24%(-0.091)#79 | 1.67%(-0.523)#11,509 |
| 80. | Sturgis | 1.14% | 1.24%(-0.104)#80 | 1.67%(-0.537)#11,583 |
| 81. | Warner | 1.09% | 1.24%(-0.148)#81 | 1.67%(-0.580)#11,836 |
| 82. | Lake Madison | 1.06% | 1.24%(-0.183)#82 | 1.67%(-0.615)#12,043 |
| 83. | Artesian | 1.05% | 1.24%(-0.189)#83 | 1.67%(-0.622)#12,079 |
| 84. | Wagner | 1.05% | 1.24%(-0.193)#84 | 1.67%(-0.626)#12,105 |
| 85. | Garden City | 1.04% | 1.24%(-0.200)#85 | 1.67%(-0.633)#12,155 |
| 86. | Viborg | 1.04% | 1.24%(-0.203)#86 | 1.67%(-0.635)#12,169 |
| 87. | Crooks | 1.03% | 1.24%(-0.217)#87 | 1.67%(-0.649)#12,242 |
| 88. | Enemy Swim | 0.99% | 1.24%(-0.255)#88 | 1.67%(-0.687)#12,509 |
| 89. | Brookings | 0.99% | 1.24%(-0.256)#89 | 1.67%(-0.688)#12,513 |
| 90. | Alpena | 0.98% | 1.24%(-0.259)#90 | 1.67%(-0.691)#12,537 |
| 91. | Harrold | 0.98% | 1.24%(-0.261)#91 | 1.67%(-0.694)#12,549 |
| 92. | Tripp | 0.94% | 1.24%(-0.304)#92 | 1.67%(-0.736)#12,824 |
| 93. | Tea | 0.93% | 1.24%(-0.313)#93 | 1.67%(-0.746)#12,892 |
| 94. | Arlington | 0.83% | 1.24%(-0.414)#94 | 1.67%(-0.847)#13,538 |
| 95. | Blackhawk | 0.82% | 1.24%(-0.423)#95 | 1.67%(-0.855)#13,606 |
| 96. | Lennox | 0.81% | 1.24%(-0.435)#96 | 1.67%(-0.868)#13,696 |
| 97. | Mitchell | 0.79% | 1.24%(-0.450)#97 | 1.67%(-0.882)#13,805 |
| 98. | Wall | 0.77% | 1.24%(-0.473)#98 | 1.67%(-0.905)#13,987 |
| 99. | Milbank | 0.74% | 1.24%(-0.500)#99 | 1.67%(-0.933)#14,172 |
| 100. | North Sioux City | 0.70% | 1.24%(-0.538)#100 | 1.67%(-0.971)#14,459 |
Common Questions
What are the Top 10 Cities with the Highest Percentage of European Population in South Dakota?
Top 10 Cities with the Highest Percentage of European Population in South Dakota are:
#1
82.43%
#2
31.11%
#3
13.69%
#4
12.27%
#5
9.39%
#6
9.06%
#7
8.51%
#8
8.13%
#9
8.00%
#10
7.88%
What city has the Highest Percentage of European Population in South Dakota?
Cow Creek has the Highest Percentage of European Population in South Dakota with 82.43%.
What is the Percentage of European Population in the State of South Dakota?
Percentage of European Population in South Dakota is 1.24%.
What is the Percentage of European Population in the United States?
Percentage of European Population in the United States is 1.67%.