Blackhawk, SD
Blackhawk Map
Blackhawk Overview
2,930
TOTAL POPULATION
1,466
MALE POPULATION
1,464
FEMALE POPULATION
100.14
MALES / 100 FEMALES
99.86
FEMALES / 100 MALES
42.6
MEDIAN AGE
2.8
AVG FAMILY SIZE
2.3
AVG HOUSEHOLD SIZE
$33,623
PER CAPITA INCOME
$76,764
AVG FAMILY INCOME
$68,718
AVG HOUSEHOLD INCOME
37.8%
WAGE / INCOME GAP [ % ]
62.2¢/ $1
WAGE / INCOME GAP [ $ ]
0.27
INEQUALITY / GINI INDEX
1,757
LABOR FORCE [ PEOPLE ]
73.2%
PERCENT IN LABOR FORCE
6.4%
UNEMPLOYMENT RATE
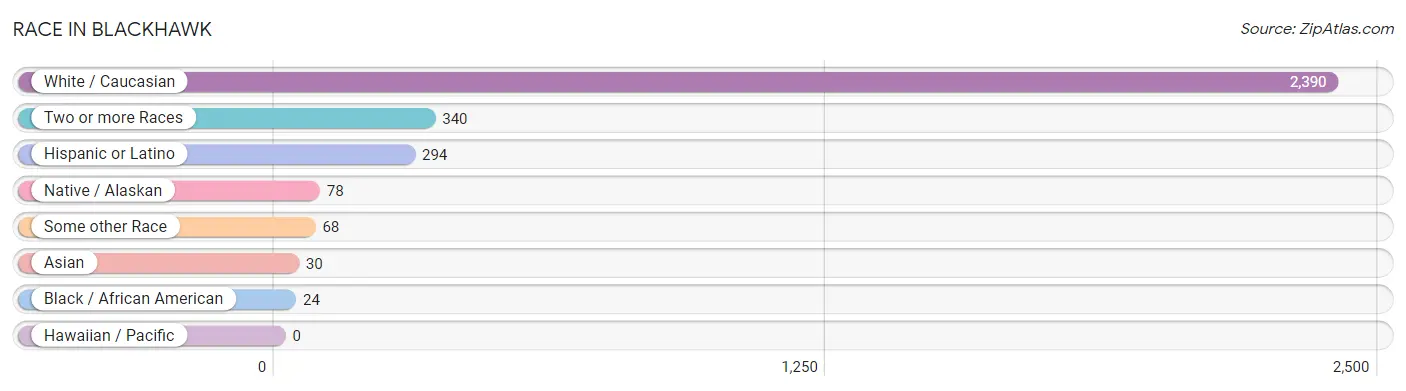
Race in Blackhawk
The most populous races in Blackhawk are White / Caucasian (2,390 | 81.6%), Two or more Races (340 | 11.6%), and Hispanic or Latino (294 | 10.0%).
| Race | # Population | % Population |
| Asian | 30 | 1.0% |
| Black / African American | 24 | 0.8% |
| Hawaiian / Pacific | 0 | 0.0% |
| Hispanic or Latino | 294 | 10.0% |
| Native / Alaskan | 78 | 2.7% |
| White / Caucasian | 2,390 | 81.6% |
| Two or more Races | 340 | 11.6% |
| Some other Race | 68 | 2.3% |
| Total | 2,930 | 100.0% |
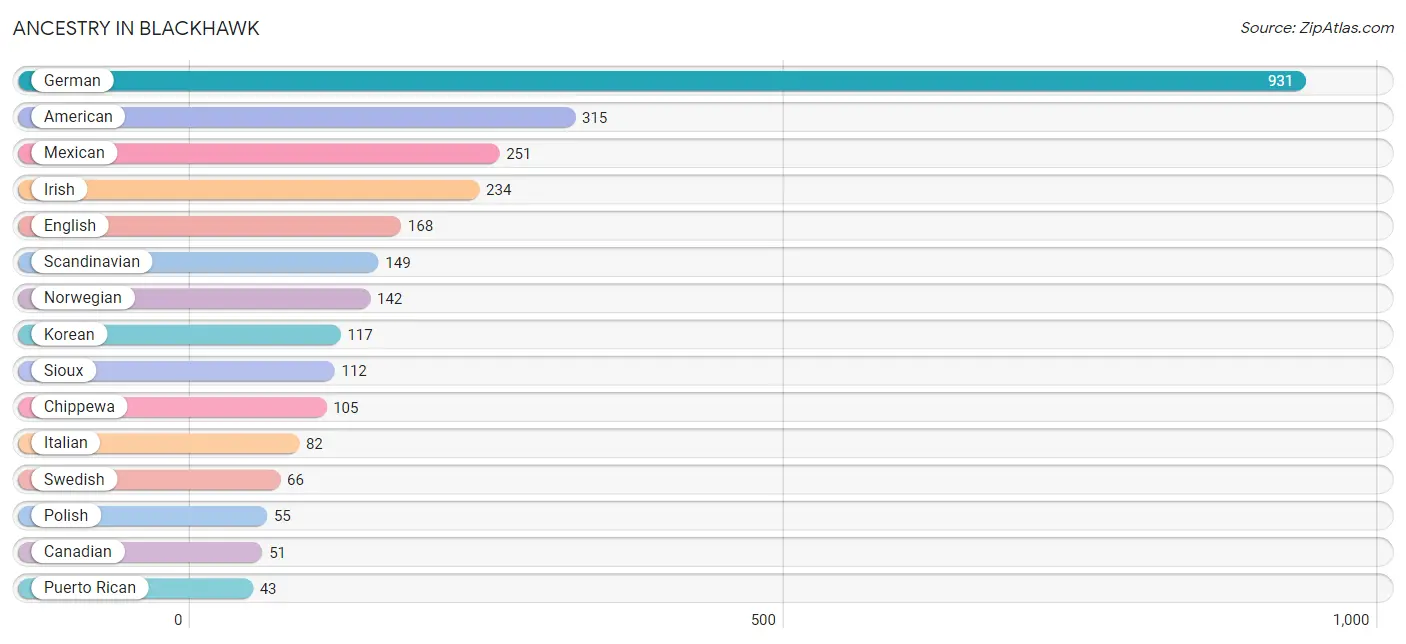
Ancestry in Blackhawk
The most populous ancestries reported in Blackhawk are German (931 | 31.8%), American (315 | 10.7%), Mexican (251 | 8.6%), Irish (234 | 8.0%), and English (168 | 5.7%), together accounting for 64.8% of all Blackhawk residents.
| Ancestry | # Population | % Population |
| American | 315 | 10.7% |
| British | 20 | 0.7% |
| Canadian | 51 | 1.7% |
| Chippewa | 105 | 3.6% |
| Danish | 20 | 0.7% |
| English | 168 | 5.7% |
| European | 24 | 0.8% |
| French | 15 | 0.5% |
| French Canadian | 22 | 0.7% |
| German | 931 | 31.8% |
| Hungarian | 25 | 0.9% |
| Indian (Asian) | 30 | 1.0% |
| Irish | 234 | 8.0% |
| Italian | 82 | 2.8% |
| Korean | 117 | 4.0% |
| Mexican | 251 | 8.6% |
| Norwegian | 142 | 4.9% |
| Polish | 55 | 1.9% |
| Puerto Rican | 43 | 1.5% |
| Russian | 22 | 0.7% |
| Scandinavian | 149 | 5.1% |
| Scottish | 26 | 0.9% |
| Sioux | 112 | 3.8% |
| Swedish | 66 | 2.2% |
| Swiss | 12 | 0.4% |
| Welsh | 20 | 0.7% | View All 26 Rows |
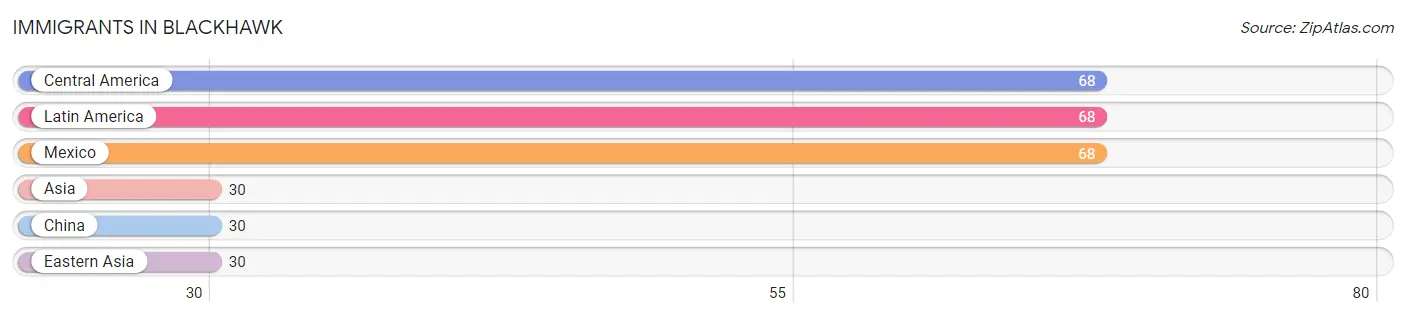
Immigrants in Blackhawk
The most numerous immigrant groups reported in Blackhawk came from Central America (68 | 2.3%), Latin America (68 | 2.3%), Mexico (68 | 2.3%), Asia (30 | 1.0%), and China (30 | 1.0%), together accounting for 9.0% of all Blackhawk residents.
| Immigration Origin | # Population | % Population |
| Asia | 30 | 1.0% |
| Central America | 68 | 2.3% |
| China | 30 | 1.0% |
| Eastern Asia | 30 | 1.0% |
| Latin America | 68 | 2.3% |
| Mexico | 68 | 2.3% | View All 6 Rows |
Sex and Age in Blackhawk
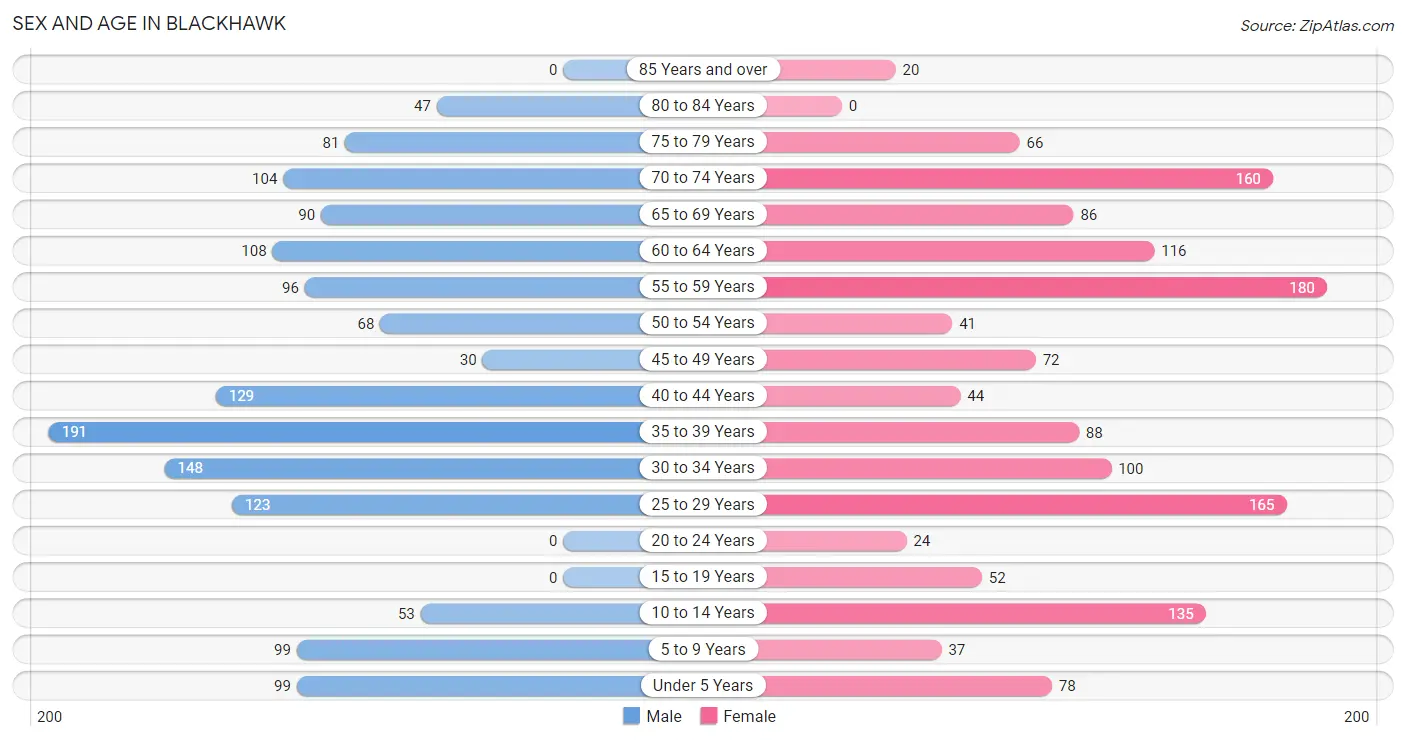
Sex and Age in Blackhawk
The most populous age groups in Blackhawk are 35 to 39 Years (191 | 13.0%) for men and 55 to 59 Years (180 | 12.3%) for women.
| Age Bracket | Male | Female |
| Under 5 Years | 99 (6.8%) | 78 (5.3%) |
| 5 to 9 Years | 99 (6.8%) | 37 (2.5%) |
| 10 to 14 Years | 53 (3.6%) | 135 (9.2%) |
| 15 to 19 Years | 0 (0.0%) | 52 (3.5%) |
| 20 to 24 Years | 0 (0.0%) | 24 (1.6%) |
| 25 to 29 Years | 123 (8.4%) | 165 (11.3%) |
| 30 to 34 Years | 148 (10.1%) | 100 (6.8%) |
| 35 to 39 Years | 191 (13.0%) | 88 (6.0%) |
| 40 to 44 Years | 129 (8.8%) | 44 (3.0%) |
| 45 to 49 Years | 30 (2.1%) | 72 (4.9%) |
| 50 to 54 Years | 68 (4.6%) | 41 (2.8%) |
| 55 to 59 Years | 96 (6.6%) | 180 (12.3%) |
| 60 to 64 Years | 108 (7.4%) | 116 (7.9%) |
| 65 to 69 Years | 90 (6.1%) | 86 (5.9%) |
| 70 to 74 Years | 104 (7.1%) | 160 (10.9%) |
| 75 to 79 Years | 81 (5.5%) | 66 (4.5%) |
| 80 to 84 Years | 47 (3.2%) | 0 (0.0%) |
| 85 Years and over | 0 (0.0%) | 20 (1.4%) |
| Total | 1,466 (100.0%) | 1,464 (100.0%) |
Families and Households in Blackhawk
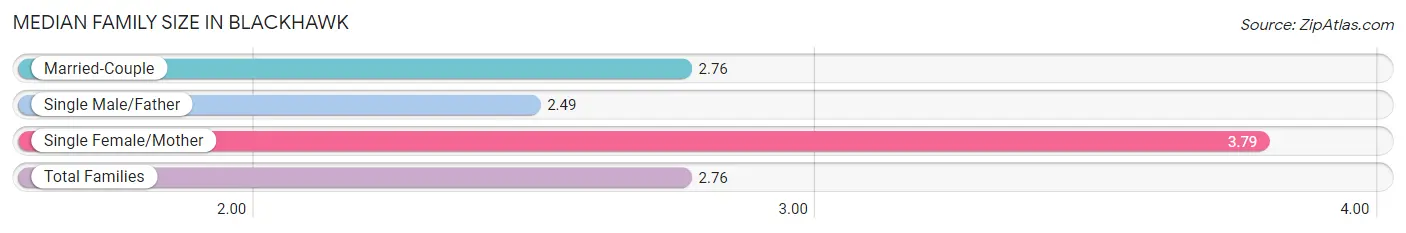
Median Family Size in Blackhawk
The median family size in Blackhawk is 2.76 persons per family, with single female/mother families (33 | 3.7%) accounting for the largest median family size of 3.79 persons per family. On the other hand, single male/father families (134 | 15.2%) represent the smallest median family size with 2.49 persons per family.
| Family Type | # Families | Family Size |
| Married-Couple | 714 (81.0%) | 2.76 |
| Single Male/Father | 134 (15.2%) | 2.49 |
| Single Female/Mother | 33 (3.7%) | 3.79 |
| Total Families | 881 (100.0%) | 2.76 |
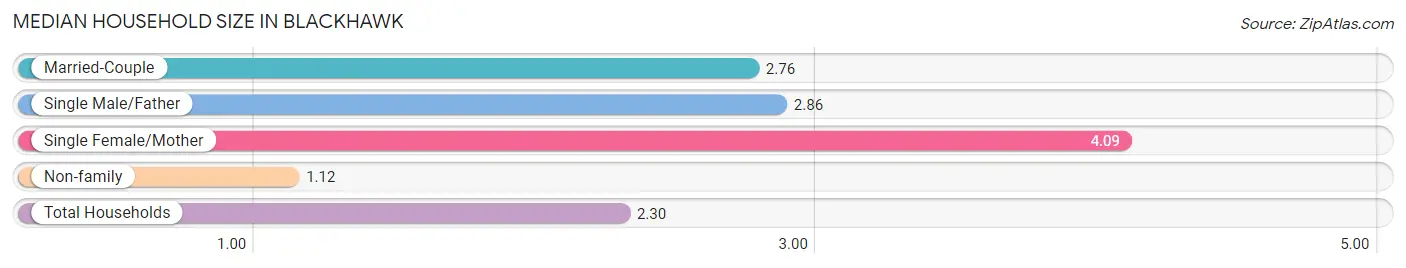
Median Household Size in Blackhawk
The median household size in Blackhawk is 2.30 persons per household, with single female/mother households (33 | 2.6%) accounting for the largest median household size of 4.09 persons per household. non-family households (392 | 30.8%) represent the smallest median household size with 1.12 persons per household.
| Household Type | # Households | Household Size |
| Married-Couple | 714 (56.1%) | 2.76 |
| Single Male/Father | 134 (10.5%) | 2.86 |
| Single Female/Mother | 33 (2.6%) | 4.09 |
| Non-family | 392 (30.8%) | 1.12 |
| Total Households | 1,273 (100.0%) | 2.30 |
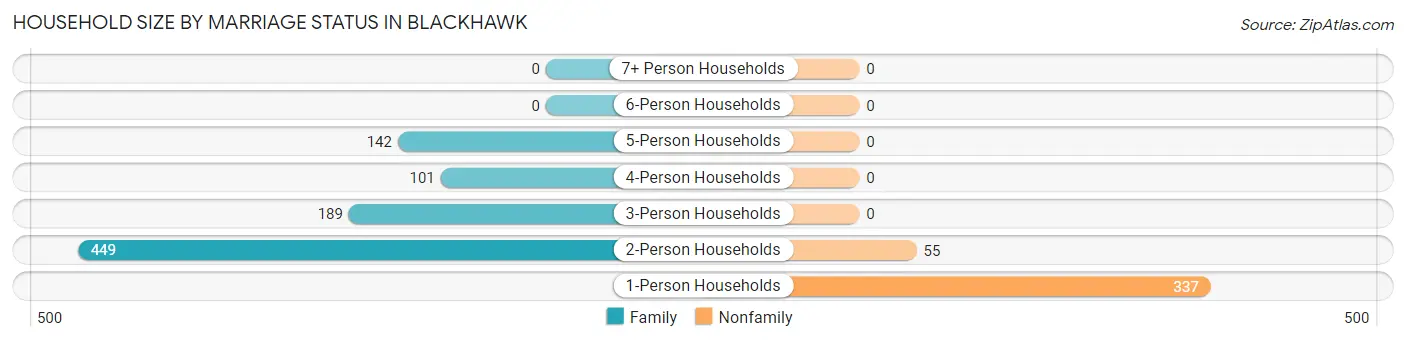
Household Size by Marriage Status in Blackhawk
Out of a total of 1,273 households in Blackhawk, 881 (69.2%) are family households, while 392 (30.8%) are nonfamily households. The most numerous type of family households are 2-person households, comprising 449, and the most common type of nonfamily households are 1-person households, comprising 337.
| Household Size | Family Households | Nonfamily Households |
| 1-Person Households | - | 337 (26.5%) |
| 2-Person Households | 449 (35.3%) | 55 (4.3%) |
| 3-Person Households | 189 (14.8%) | 0 (0.0%) |
| 4-Person Households | 101 (7.9%) | 0 (0.0%) |
| 5-Person Households | 142 (11.2%) | 0 (0.0%) |
| 6-Person Households | 0 (0.0%) | 0 (0.0%) |
| 7+ Person Households | 0 (0.0%) | 0 (0.0%) |
| Total | 881 (69.2%) | 392 (30.8%) |
Female Fertility in Blackhawk
Fertility by Age in Blackhawk
Average fertility rate in Blackhawk is 55.0 births per 1,000 women. Women in the age bracket of 20 to 34 years have the highest fertility rate with 104.0 births per 1,000 women. Women in the age bracket of 20 to 34 years acount for 100.0% of all women with births.
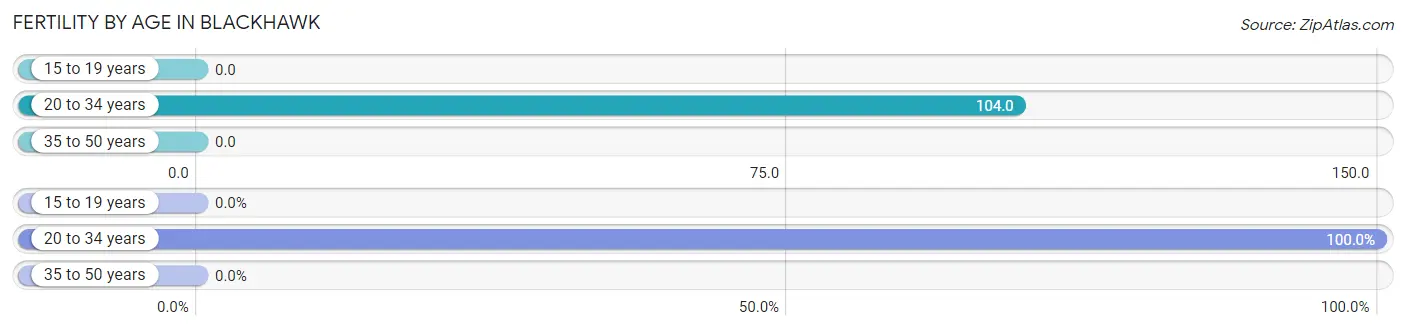
| Age Bracket | Women with Births | Births / 1,000 Women |
| 15 to 19 years | 0 (0.0%) | 0.0 |
| 20 to 34 years | 30 (100.0%) | 104.0 |
| 35 to 50 years | 0 (0.0%) | 0.0 |
| Total | 30 (100.0%) | 55.0 |
Fertility by Age by Marriage Status in Blackhawk
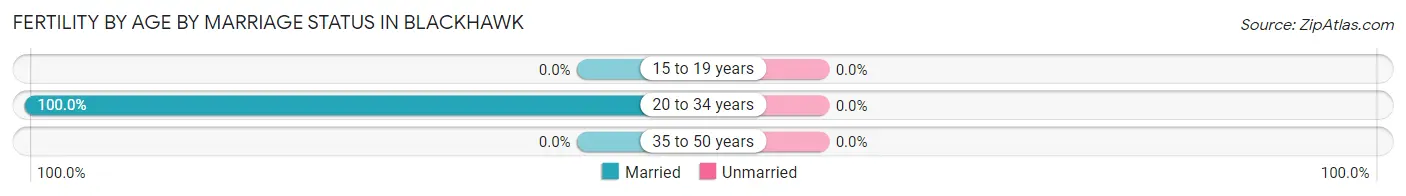
| Age Bracket | Married | Unmarried |
| 15 to 19 years | 0 (0.0%) | 0 (0.0%) |
| 20 to 34 years | 30 (100.0%) | 0 (0.0%) |
| 35 to 50 years | 0 (0.0%) | 0 (0.0%) |
| Total | 30 (100.0%) | 0 (0.0%) |
Fertility by Education in Blackhawk
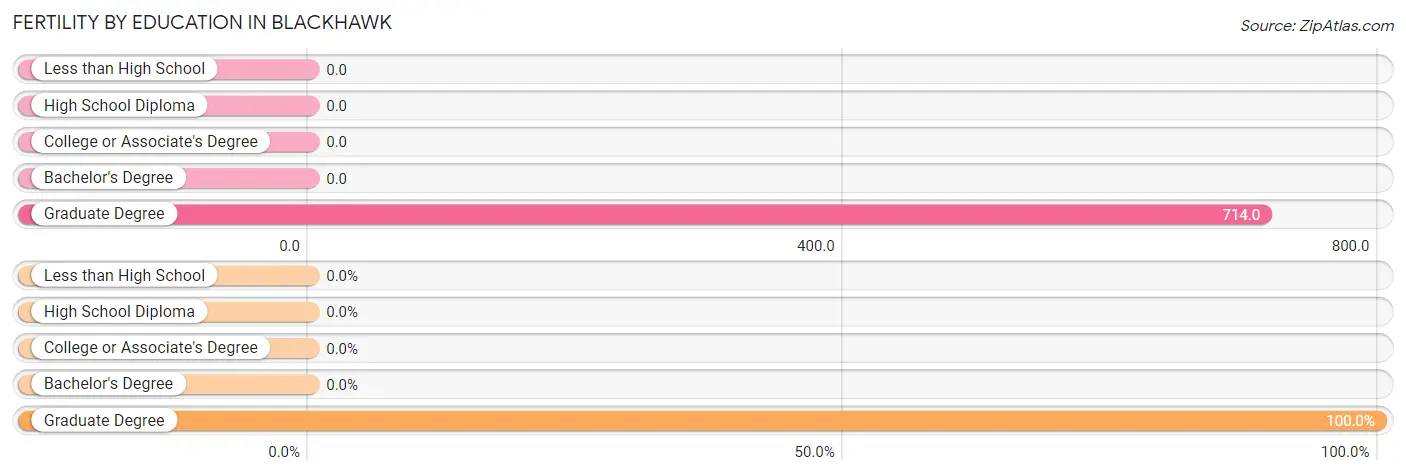
| Educational Attainment | Women with Births | Births / 1,000 Women |
| Less than High School | 0 (0.0%) | 0.0 |
| High School Diploma | 0 (0.0%) | 0.0 |
| College or Associate's Degree | 0 (0.0%) | 0.0 |
| Bachelor's Degree | 0 (0.0%) | 0.0 |
| Graduate Degree | 30 (100.0%) | 714.0 |
| Total | 30 (100.0%) | 55.0 |
Fertility by Education by Marriage Status in Blackhawk
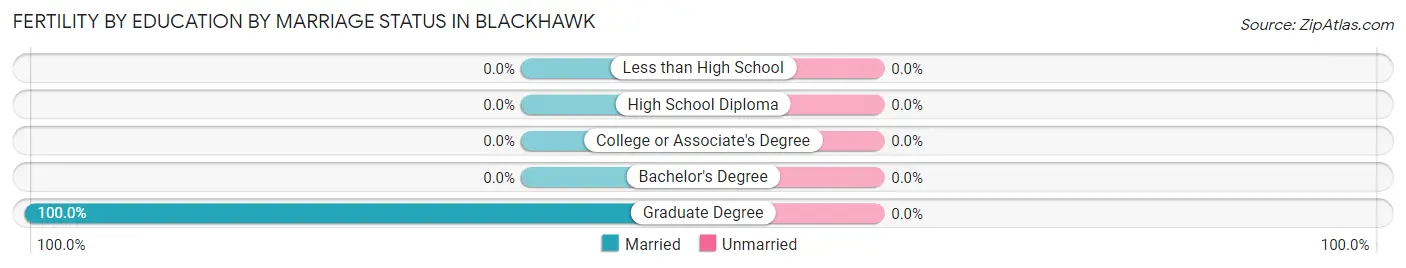
| Educational Attainment | Married | Unmarried |
| Less than High School | 0 (0.0%) | 0 (0.0%) |
| High School Diploma | 0 (0.0%) | 0 (0.0%) |
| College or Associate's Degree | 0 (0.0%) | 0 (0.0%) |
| Bachelor's Degree | 0 (0.0%) | 0 (0.0%) |
| Graduate Degree | 30 (100.0%) | 0 (0.0%) |
| Total | 30 (100.0%) | 0 (0.0%) |
Income in Blackhawk
Income Overview in Blackhawk
Per Capita Income in Blackhawk is $33,623, while median incomes of families and households are $76,764 and $68,718 respectively.
| Characteristic | Number | Measure |
| Per Capita Income | 2,930 | $33,623 |
| Median Family Income | 881 | $76,764 |
| Mean Family Income | 881 | $85,521 |
| Median Household Income | 1,273 | $68,718 |
| Mean Household Income | 1,273 | $74,153 |
| Income Deficit | 881 | $0 |
| Wage / Income Gap (%) | 2,930 | 37.79% |
| Wage / Income Gap ($) | 2,930 | 62.21¢ per $1 |
| Gini / Inequality Index | 2,930 | 0.27 |
Earnings by Sex in Blackhawk
Average Earnings in Blackhawk are $44,917, $54,424 for men and $33,856 for women, a difference of 37.8%.
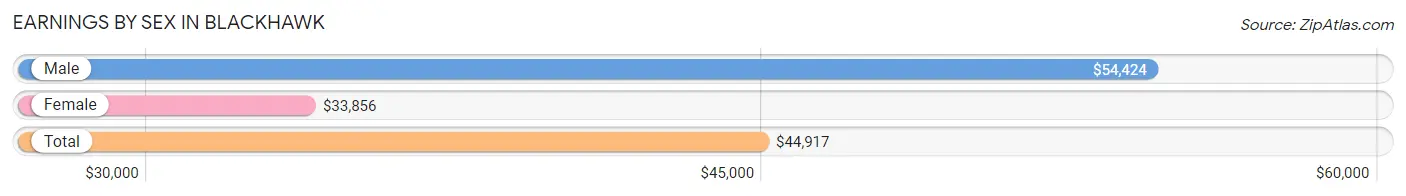
| Sex | Number | Average Earnings |
| Male | 765 (45.7%) | $54,424 |
| Female | 908 (54.3%) | $33,856 |
| Total | 1,673 (100.0%) | $44,917 |
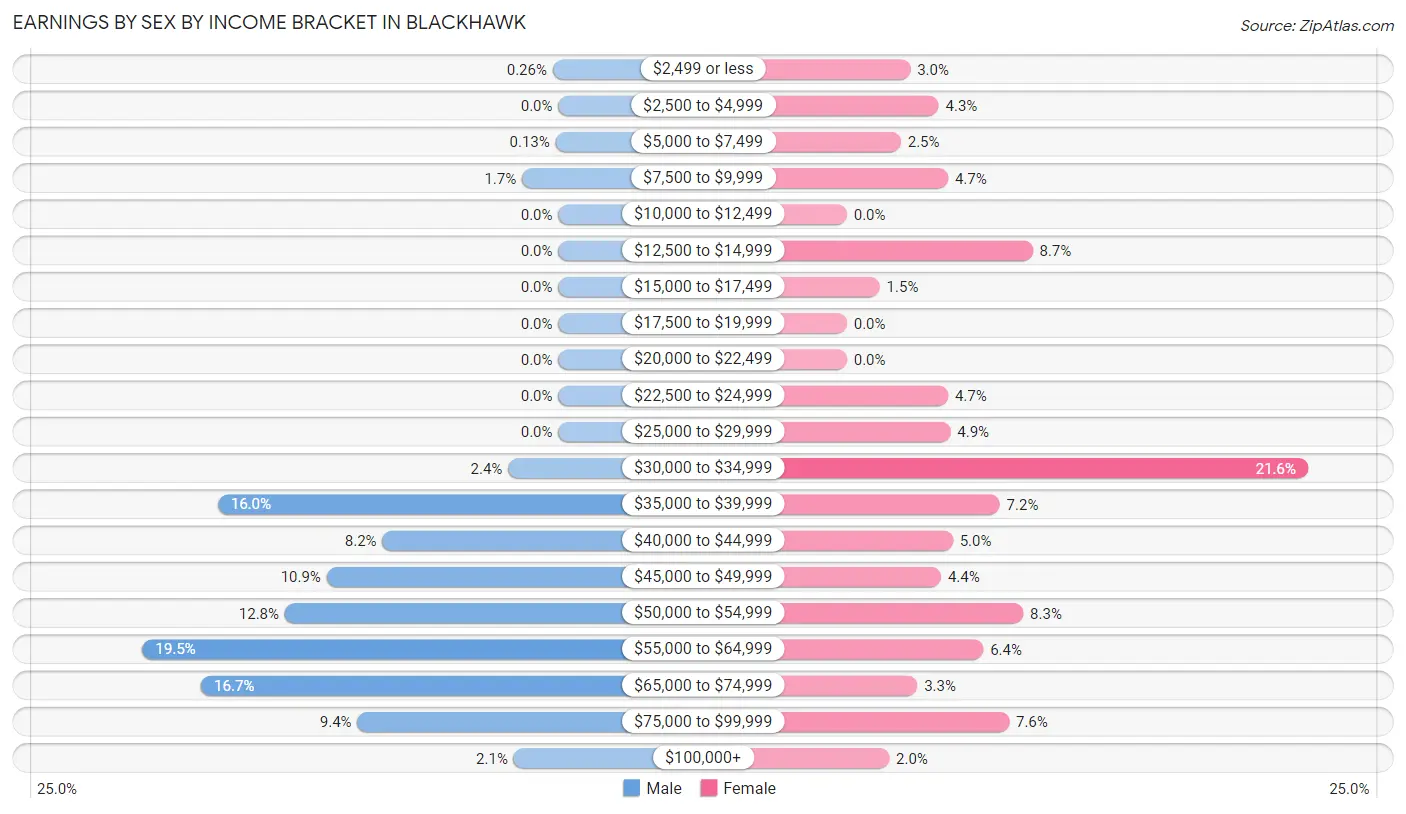
Earnings by Sex by Income Bracket in Blackhawk
The most common earnings brackets in Blackhawk are $55,000 to $64,999 for men (149 | 19.5%) and $30,000 to $34,999 for women (196 | 21.6%).
| Income | Male | Female |
| $2,499 or less | 2 (0.3%) | 27 (3.0%) |
| $2,500 to $4,999 | 0 (0.0%) | 39 (4.3%) |
| $5,000 to $7,499 | 1 (0.1%) | 23 (2.5%) |
| $7,500 to $9,999 | 13 (1.7%) | 43 (4.7%) |
| $10,000 to $12,499 | 0 (0.0%) | 0 (0.0%) |
| $12,500 to $14,999 | 0 (0.0%) | 79 (8.7%) |
| $15,000 to $17,499 | 0 (0.0%) | 14 (1.5%) |
| $17,500 to $19,999 | 0 (0.0%) | 0 (0.0%) |
| $20,000 to $22,499 | 0 (0.0%) | 0 (0.0%) |
| $22,500 to $24,999 | 0 (0.0%) | 43 (4.7%) |
| $25,000 to $29,999 | 0 (0.0%) | 44 (4.9%) |
| $30,000 to $34,999 | 18 (2.4%) | 196 (21.6%) |
| $35,000 to $39,999 | 122 (16.0%) | 65 (7.2%) |
| $40,000 to $44,999 | 63 (8.2%) | 45 (5.0%) |
| $45,000 to $49,999 | 83 (10.8%) | 40 (4.4%) |
| $50,000 to $54,999 | 98 (12.8%) | 75 (8.3%) |
| $55,000 to $64,999 | 149 (19.5%) | 58 (6.4%) |
| $65,000 to $74,999 | 128 (16.7%) | 30 (3.3%) |
| $75,000 to $99,999 | 72 (9.4%) | 69 (7.6%) |
| $100,000+ | 16 (2.1%) | 18 (2.0%) |
| Total | 765 (100.0%) | 908 (100.0%) |
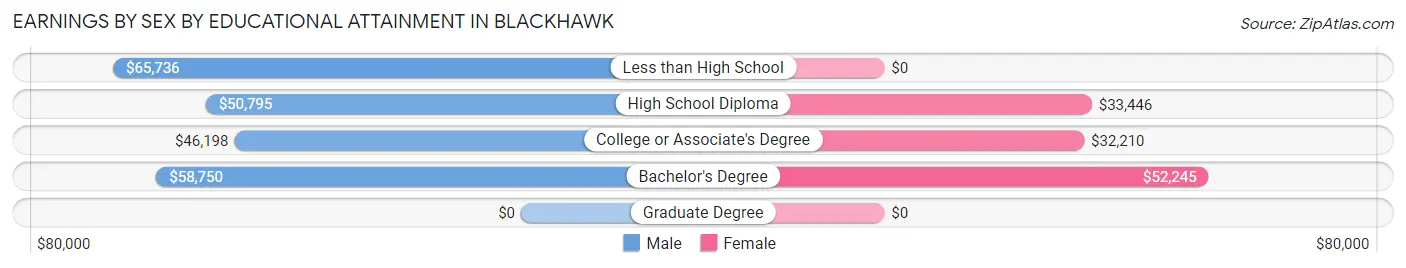
Earnings by Sex by Educational Attainment in Blackhawk
Average earnings in Blackhawk are $54,424 for men and $34,189 for women, a difference of 37.2%. Men with an educational attainment of less than high school enjoy the highest average annual earnings of $65,736, while those with college or associate's degree education earn the least with $46,198. Women with an educational attainment of bachelor's degree earn the most with the average annual earnings of $52,245, while those with college or associate's degree education have the smallest earnings of $32,210.
| Educational Attainment | Male Income | Female Income |
| Less than High School | $65,736 | $0 |
| High School Diploma | $50,795 | $33,446 |
| College or Associate's Degree | $46,198 | $32,210 |
| Bachelor's Degree | $58,750 | $52,245 |
| Graduate Degree | - | - |
| Total | $54,424 | $34,189 |
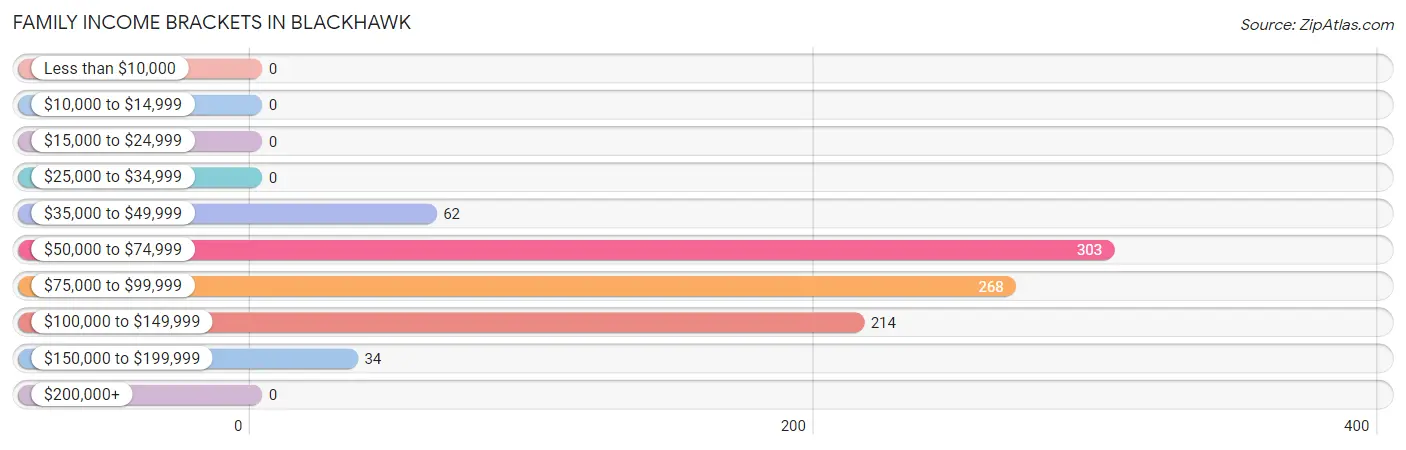
Family Income in Blackhawk
Family Income Brackets in Blackhawk
According to the Blackhawk family income data, there are 303 families falling into the $50,000 to $74,999 income range, which is the most common income bracket and makes up 34.4% of all families.
| Income Bracket | # Families | % Families |
| Less than $10,000 | 0 | 0.0% |
| $10,000 to $14,999 | 0 | 0.0% |
| $15,000 to $24,999 | 0 | 0.0% |
| $25,000 to $34,999 | 0 | 0.0% |
| $35,000 to $49,999 | 62 | 7.0% |
| $50,000 to $74,999 | 303 | 34.4% |
| $75,000 to $99,999 | 268 | 30.4% |
| $100,000 to $149,999 | 214 | 24.3% |
| $150,000 to $199,999 | 34 | 3.9% |
| $200,000+ | 0 | 0.0% |
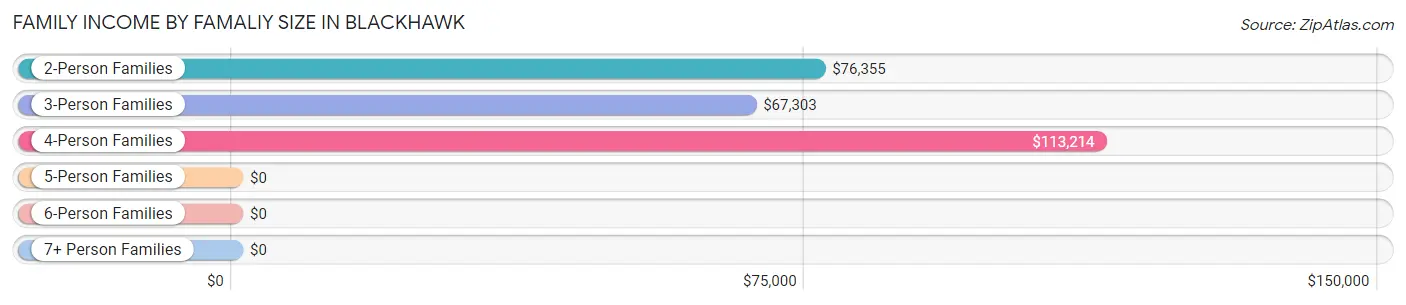
Family Income by Famaliy Size in Blackhawk
4-person families (90 | 10.2%) account for the highest median family income in Blackhawk with $113,214 per family, while 2-person families (556 | 63.1%) have the highest median income of $38,178 per family member.
| Income Bracket | # Families | Median Income |
| 2-Person Families | 556 (63.1%) | $76,355 |
| 3-Person Families | 93 (10.6%) | $67,303 |
| 4-Person Families | 90 (10.2%) | $113,214 |
| 5-Person Families | 142 (16.1%) | $0 |
| 6-Person Families | 0 (0.0%) | $0 |
| 7+ Person Families | 0 (0.0%) | $0 |
| Total | 881 (100.0%) | $76,764 |
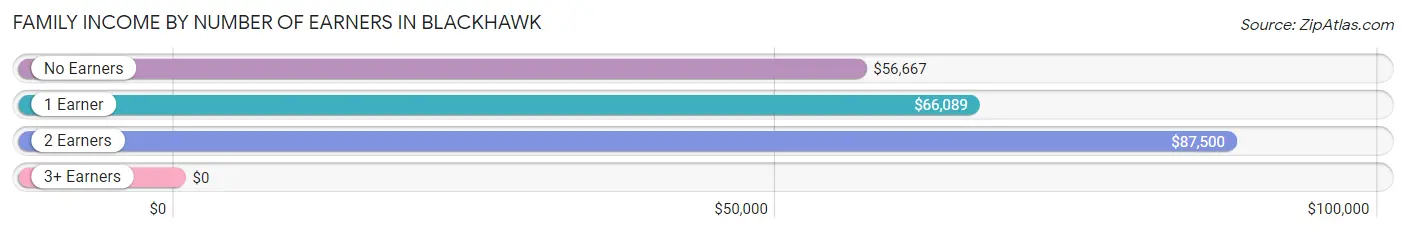
Family Income by Number of Earners in Blackhawk
| Number of Earners | # Families | Median Income |
| No Earners | 68 (7.7%) | $56,667 |
| 1 Earner | 267 (30.3%) | $66,089 |
| 2 Earners | 504 (57.2%) | $87,500 |
| 3+ Earners | 42 (4.8%) | $0 |
| Total | 881 (100.0%) | $76,764 |
Household Income in Blackhawk
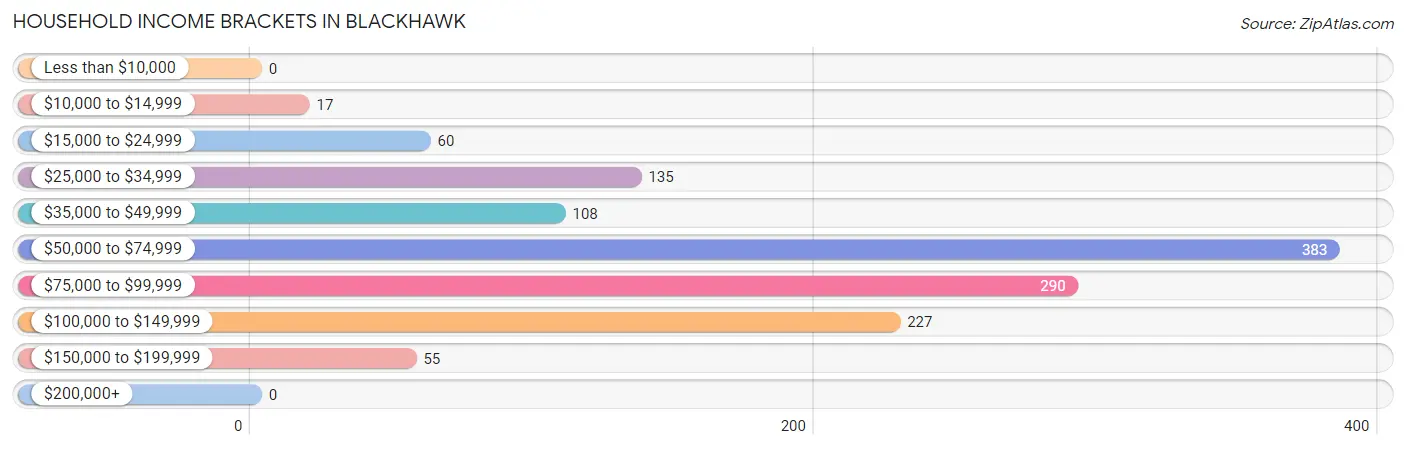
Household Income Brackets in Blackhawk
With 383 households falling in the category, the $50,000 to $74,999 income range is the most frequent in Blackhawk, accounting for 30.1% of all households.
| Income Bracket | # Households | % Households |
| Less than $10,000 | 0 | 0.0% |
| $10,000 to $14,999 | 17 | 1.3% |
| $15,000 to $24,999 | 60 | 4.7% |
| $25,000 to $34,999 | 135 | 10.6% |
| $35,000 to $49,999 | 108 | 8.5% |
| $50,000 to $74,999 | 383 | 30.1% |
| $75,000 to $99,999 | 290 | 22.8% |
| $100,000 to $149,999 | 227 | 17.8% |
| $150,000 to $199,999 | 55 | 4.3% |
| $200,000+ | 0 | 0.0% |
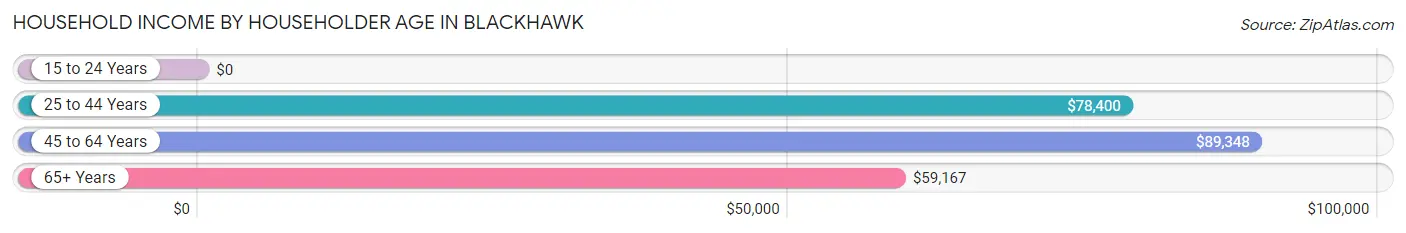
Household Income by Householder Age in Blackhawk
The median household income in Blackhawk is $68,718, with the highest median household income of $89,348 found in the 45 to 64 years age bracket for the primary householder. A total of 334 households (26.2%) fall into this category.
| Income Bracket | # Households | Median Income |
| 15 to 24 Years | 0 (0.0%) | $0 |
| 25 to 44 Years | 479 (37.6%) | $78,400 |
| 45 to 64 Years | 334 (26.2%) | $89,348 |
| 65+ Years | 460 (36.1%) | $59,167 |
| Total | 1,273 (100.0%) | $68,718 |
Poverty in Blackhawk
Income Below Poverty by Sex and Age in Blackhawk
With 3.6% poverty level for males and 3.6% for females among the residents of Blackhawk, 55 to 64 year old males and 75 year old and over females are the most vulnerable to poverty, with 49 males (24.0%) and 16 females (18.6%) in their respective age groups living below the poverty level.
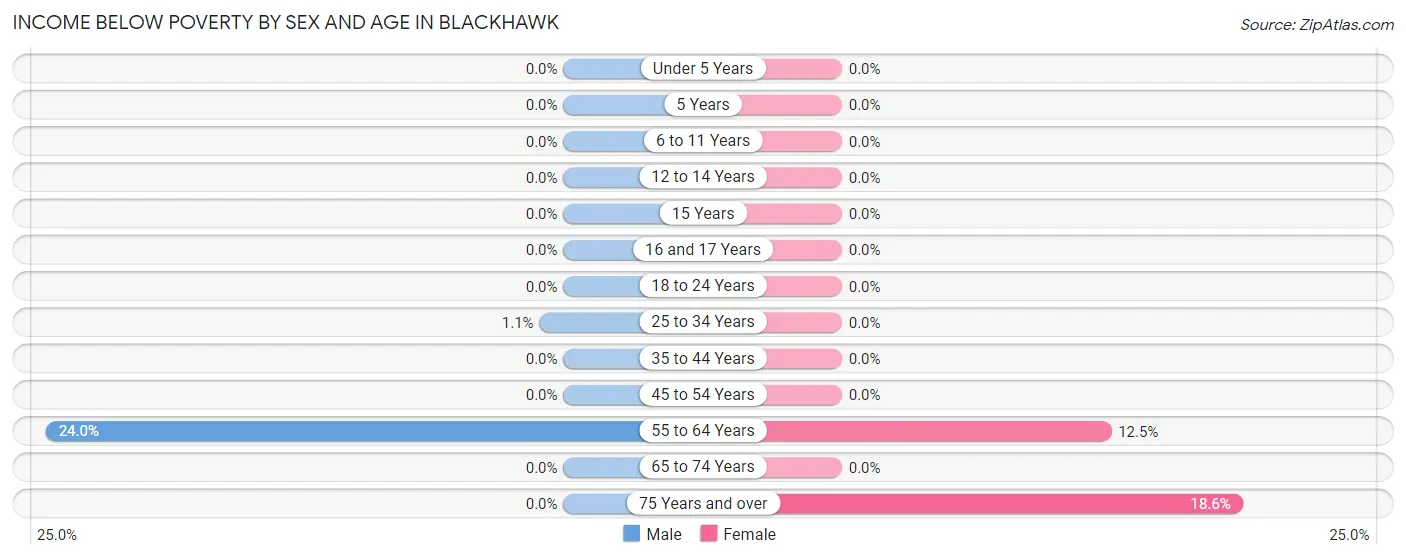
| Age Bracket | Male | Female |
| Under 5 Years | 0 (0.0%) | 0 (0.0%) |
| 5 Years | 0 (0.0%) | 0 (0.0%) |
| 6 to 11 Years | 0 (0.0%) | 0 (0.0%) |
| 12 to 14 Years | 0 (0.0%) | 0 (0.0%) |
| 15 Years | 0 (0.0%) | 0 (0.0%) |
| 16 and 17 Years | 0 (0.0%) | 0 (0.0%) |
| 18 to 24 Years | 0 (0.0%) | 0 (0.0%) |
| 25 to 34 Years | 3 (1.1%) | 0 (0.0%) |
| 35 to 44 Years | 0 (0.0%) | 0 (0.0%) |
| 45 to 54 Years | 0 (0.0%) | 0 (0.0%) |
| 55 to 64 Years | 49 (24.0%) | 37 (12.5%) |
| 65 to 74 Years | 0 (0.0%) | 0 (0.0%) |
| 75 Years and over | 0 (0.0%) | 16 (18.6%) |
| Total | 52 (3.6%) | 53 (3.6%) |
Income Above Poverty by Sex and Age in Blackhawk
According to the poverty statistics in Blackhawk, males aged under 5 years and females aged under 5 years are the age groups that are most secure financially, with 100.0% of males and 100.0% of females in these age groups living above the poverty line.
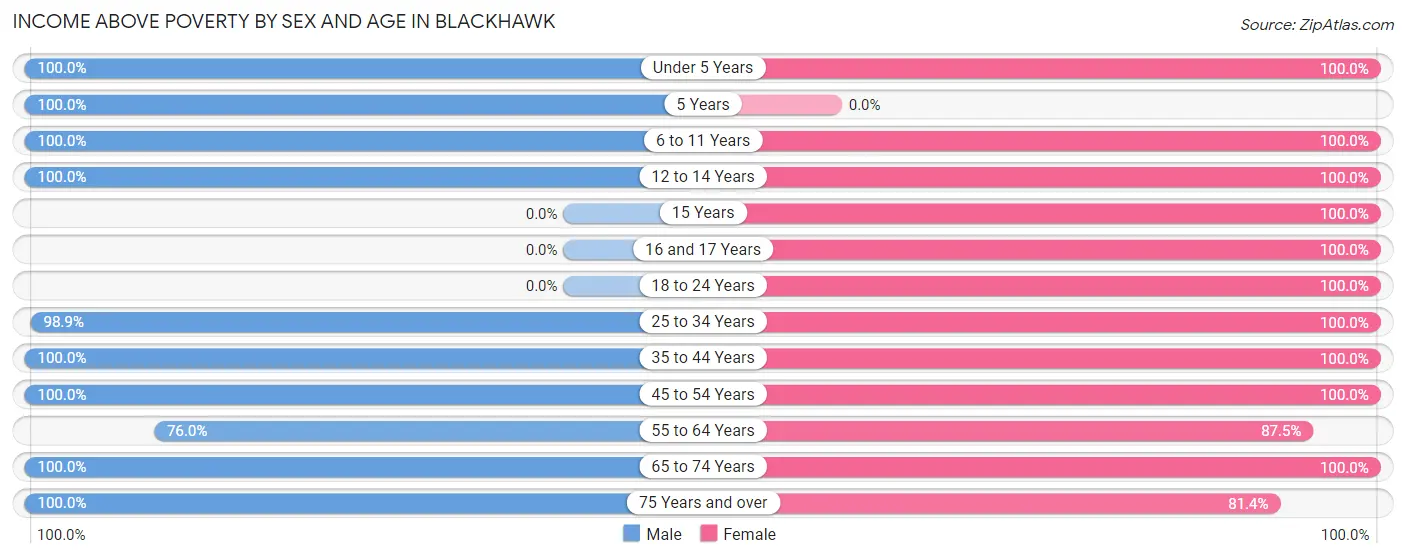
| Age Bracket | Male | Female |
| Under 5 Years | 90 (100.0%) | 78 (100.0%) |
| 5 Years | 37 (100.0%) | 0 (0.0%) |
| 6 to 11 Years | 80 (100.0%) | 121 (100.0%) |
| 12 to 14 Years | 35 (100.0%) | 51 (100.0%) |
| 15 Years | 0 (0.0%) | 29 (100.0%) |
| 16 and 17 Years | 0 (0.0%) | 23 (100.0%) |
| 18 to 24 Years | 0 (0.0%) | 24 (100.0%) |
| 25 to 34 Years | 268 (98.9%) | 265 (100.0%) |
| 35 to 44 Years | 320 (100.0%) | 132 (100.0%) |
| 45 to 54 Years | 98 (100.0%) | 113 (100.0%) |
| 55 to 64 Years | 155 (76.0%) | 259 (87.5%) |
| 65 to 74 Years | 194 (100.0%) | 246 (100.0%) |
| 75 Years and over | 128 (100.0%) | 70 (81.4%) |
| Total | 1,405 (96.4%) | 1,411 (96.4%) |
Income Below Poverty Among Married-Couple Families in Blackhawk
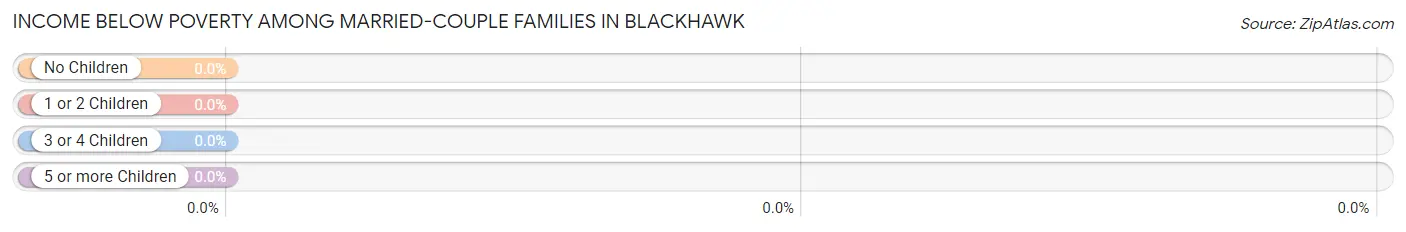
| Children | Above Poverty | Below Poverty |
| No Children | 449 (100.0%) | 0 (0.0%) |
| 1 or 2 Children | 123 (100.0%) | 0 (0.0%) |
| 3 or 4 Children | 142 (100.0%) | 0 (0.0%) |
| 5 or more Children | 0 (0.0%) | 0 (0.0%) |
| Total | 714 (100.0%) | 0 (0.0%) |
Income Below Poverty Among Single-Parent Households in Blackhawk
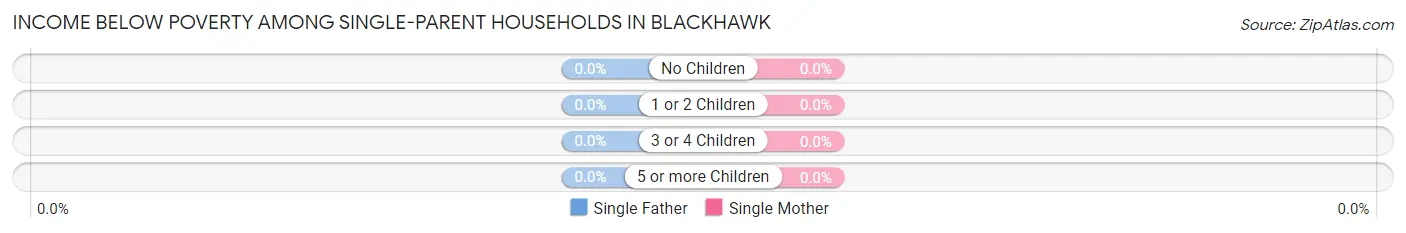
| Children | Single Father | Single Mother |
| No Children | 0 (0.0%) | 0 (0.0%) |
| 1 or 2 Children | 0 (0.0%) | 0 (0.0%) |
| 3 or 4 Children | 0 (0.0%) | 0 (0.0%) |
| 5 or more Children | 0 (0.0%) | 0 (0.0%) |
| Total | 0 (0.0%) | 0 (0.0%) |
Income Below Poverty Among Married-Couple vs Single-Parent Households in Blackhawk
| Children | Married-Couple Families | Single-Parent Households |
| No Children | 0 (0.0%) | 0 (0.0%) |
| 1 or 2 Children | 0 (0.0%) | 0 (0.0%) |
| 3 or 4 Children | 0 (0.0%) | 0 (0.0%) |
| 5 or more Children | 0 (0.0%) | 0 (0.0%) |
| Total | 0 (0.0%) | 0 (0.0%) |
Employment Characteristics in Blackhawk
Employment by Class of Employer in Blackhawk
Among the 1,624 employed individuals in Blackhawk, private company employees (867 | 53.4%), not-for-profit organizations (308 | 19.0%), and local government employees (225 | 13.9%) make up the most common classes of employment.
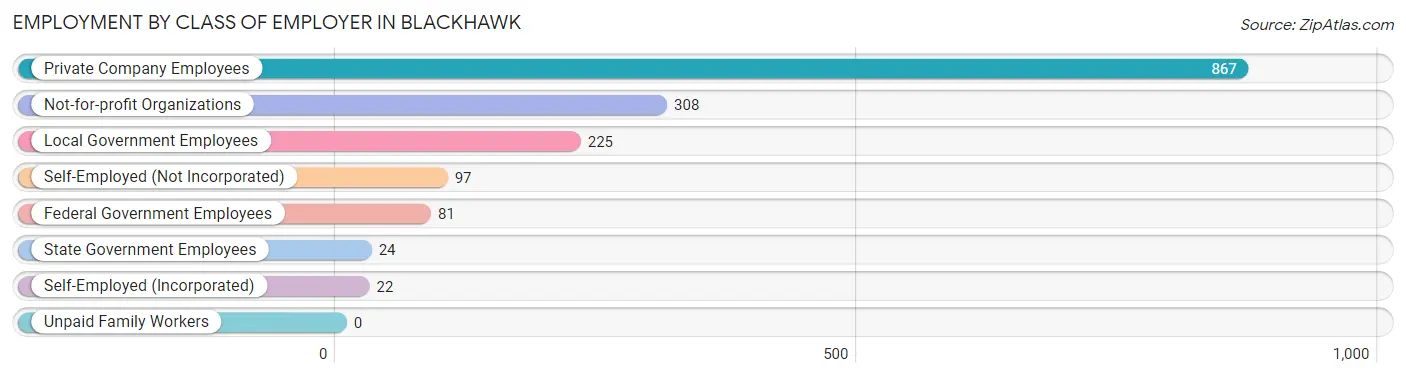
| Employer Class | # Employees | % Employees |
| Private Company Employees | 867 | 53.4% |
| Self-Employed (Incorporated) | 22 | 1.3% |
| Self-Employed (Not Incorporated) | 97 | 6.0% |
| Not-for-profit Organizations | 308 | 19.0% |
| Local Government Employees | 225 | 13.9% |
| State Government Employees | 24 | 1.5% |
| Federal Government Employees | 81 | 5.0% |
| Unpaid Family Workers | 0 | 0.0% |
| Total | 1,624 | 100.0% |
Employment Status by Age in Blackhawk
According to the labor force statistics for Blackhawk, out of the total population over 16 years of age (2,400), 73.2% or 1,757 individuals are in the labor force, with 6.4% or 112 of them unemployed. The age group with the highest labor force participation rate is 16 to 19 years, with 100.0% or 23 individuals in the labor force. Within the labor force, the 55 to 59 years age range has the highest percentage of unemployed individuals, with 31.4% or 75 of them being unemployed.
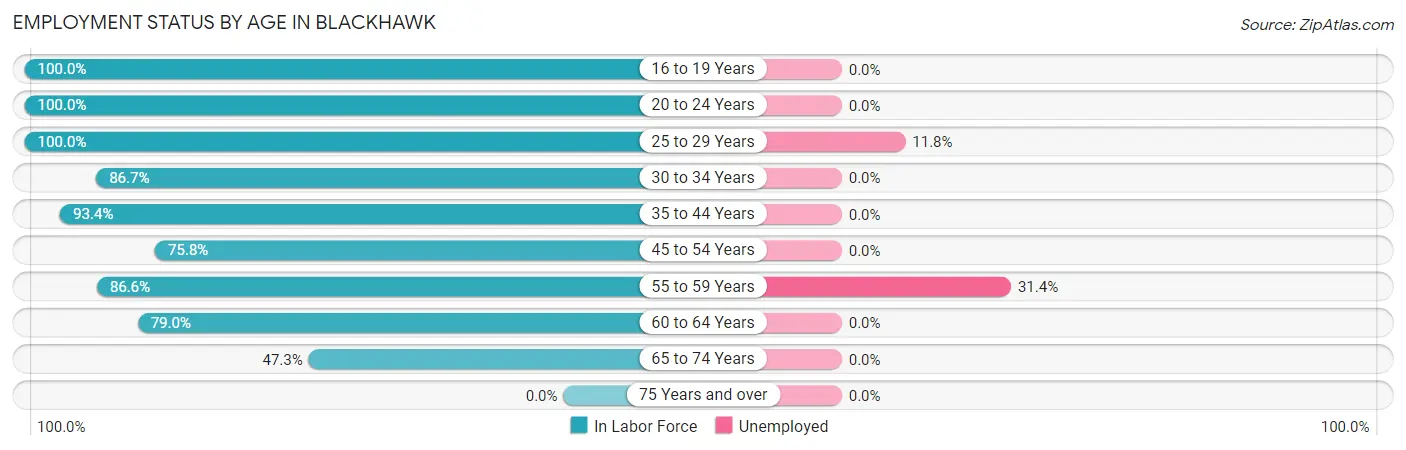
| Age Bracket | In Labor Force | Unemployed |
| 16 to 19 Years | 23 (100.0%) | 0 (0.0%) |
| 20 to 24 Years | 24 (100.0%) | 0 (0.0%) |
| 25 to 29 Years | 288 (100.0%) | 34 (11.8%) |
| 30 to 34 Years | 215 (86.7%) | 0 (0.0%) |
| 35 to 44 Years | 422 (93.4%) | 0 (0.0%) |
| 45 to 54 Years | 160 (75.8%) | 0 (0.0%) |
| 55 to 59 Years | 239 (86.6%) | 75 (31.4%) |
| 60 to 64 Years | 177 (79.0%) | 0 (0.0%) |
| 65 to 74 Years | 208 (47.3%) | 0 (0.0%) |
| 75 Years and over | 0 (0.0%) | 0 (0.0%) |
| Total | 1,757 (73.2%) | 112 (6.4%) |
Employment Status by Educational Attainment in Blackhawk
According to labor force statistics for Blackhawk, 88.3% of individuals (1,500) out of the total population between 25 and 64 years of age (1,699) are in the labor force, with 7.5% or 112 of them being unemployed. The group with the highest labor force participation rate are those with the educational attainment of bachelor's degree or higher, with 100.0% or 281 individuals in the labor force. Within the labor force, individuals with high school diploma education have the highest percentage of unemployment, with 22.7% or 83 of them being unemployed.
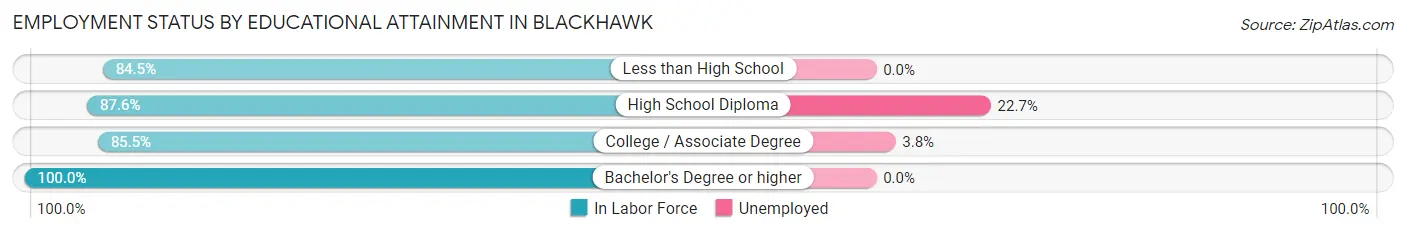
| Educational Attainment | In Labor Force | Unemployed |
| Less than High School | 120 (84.5%) | 0 (0.0%) |
| High School Diploma | 366 (87.6%) | 95 (22.7%) |
| College / Associate Degree | 734 (85.5%) | 33 (3.8%) |
| Bachelor's Degree or higher | 281 (100.0%) | 0 (0.0%) |
| Total | 1,500 (88.3%) | 127 (7.5%) |
Employment Occupations by Sex in Blackhawk
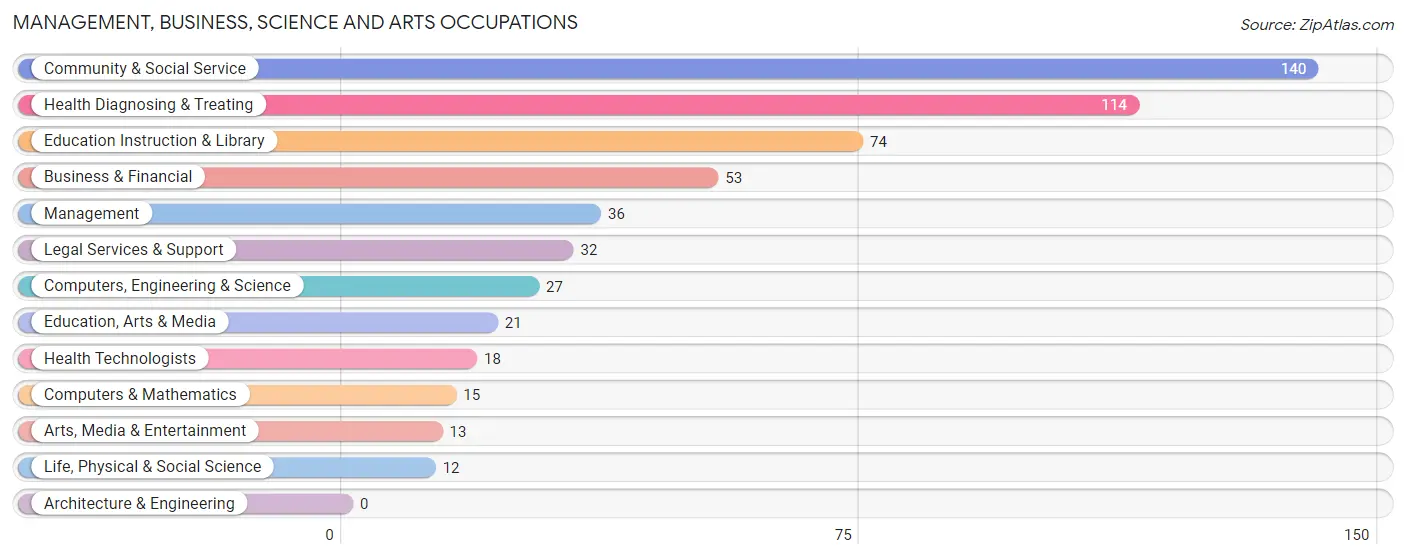
Management, Business, Science and Arts Occupations
The most common Management, Business, Science and Arts occupations in Blackhawk are Community & Social Service (140 | 8.8%), Health Diagnosing & Treating (114 | 7.1%), Education Instruction & Library (74 | 4.6%), Business & Financial (53 | 3.3%), and Management (36 | 2.3%).
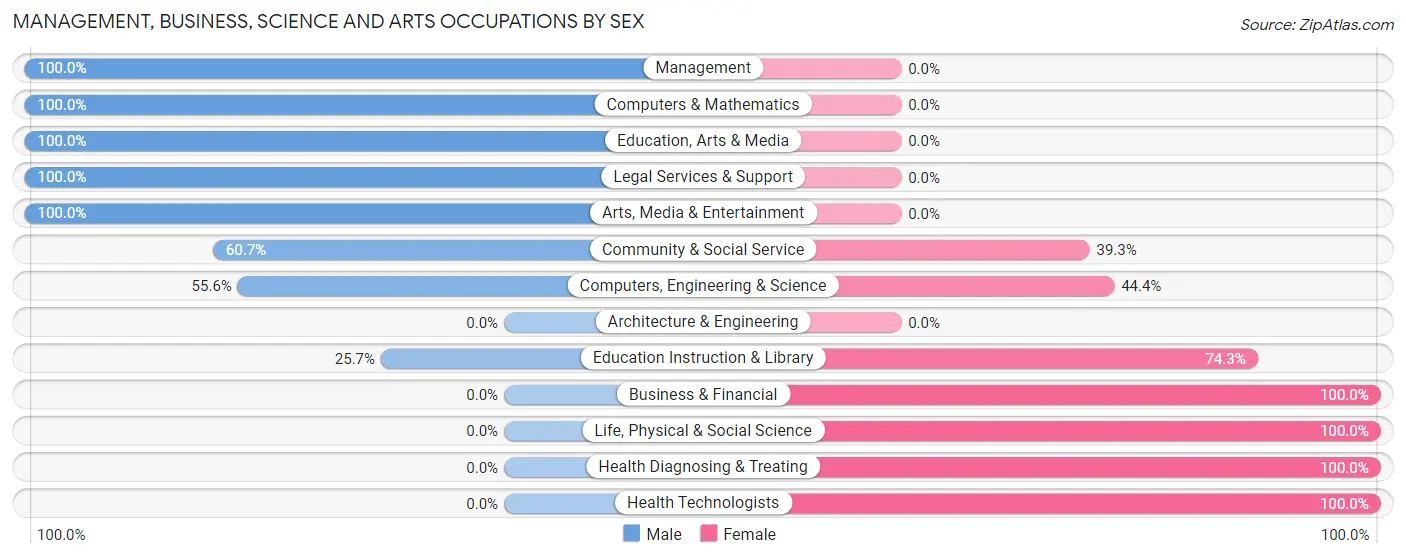
Management, Business, Science and Arts Occupations by Sex
Within the Management, Business, Science and Arts occupations in Blackhawk, the most male-oriented occupations are Management (100.0%), Computers & Mathematics (100.0%), and Education, Arts & Media (100.0%), while the most female-oriented occupations are Business & Financial (100.0%), Life, Physical & Social Science (100.0%), and Health Diagnosing & Treating (100.0%).
| Occupation | Male | Female |
| Management | 36 (100.0%) | 0 (0.0%) |
| Business & Financial | 0 (0.0%) | 53 (100.0%) |
| Computers, Engineering & Science | 15 (55.6%) | 12 (44.4%) |
| Computers & Mathematics | 15 (100.0%) | 0 (0.0%) |
| Architecture & Engineering | 0 (0.0%) | 0 (0.0%) |
| Life, Physical & Social Science | 0 (0.0%) | 12 (100.0%) |
| Community & Social Service | 85 (60.7%) | 55 (39.3%) |
| Education, Arts & Media | 21 (100.0%) | 0 (0.0%) |
| Legal Services & Support | 32 (100.0%) | 0 (0.0%) |
| Education Instruction & Library | 19 (25.7%) | 55 (74.3%) |
| Arts, Media & Entertainment | 13 (100.0%) | 0 (0.0%) |
| Health Diagnosing & Treating | 0 (0.0%) | 114 (100.0%) |
| Health Technologists | 0 (0.0%) | 18 (100.0%) |
| Total (Category) | 136 (36.8%) | 234 (63.2%) |
| Total (Overall) | 714 (44.7%) | 882 (55.3%) |
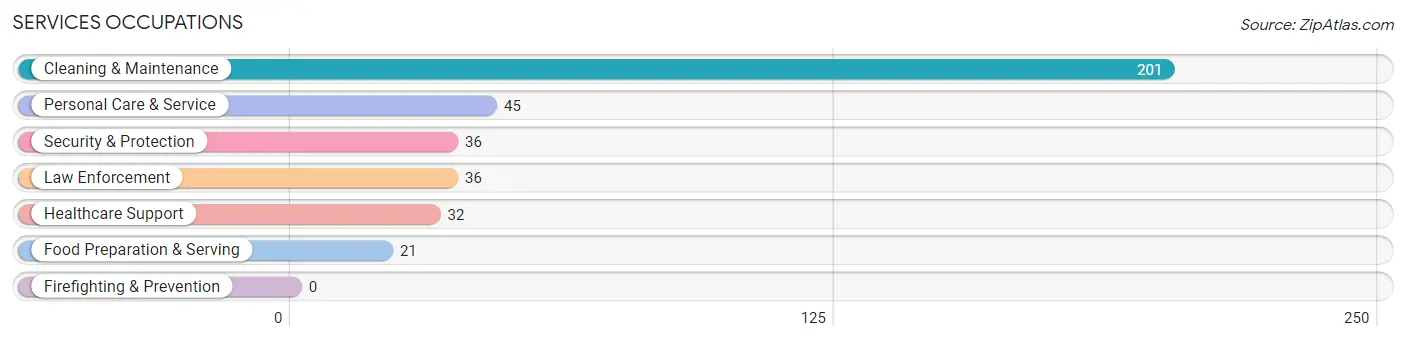
Services Occupations
The most common Services occupations in Blackhawk are Cleaning & Maintenance (201 | 12.6%), Personal Care & Service (45 | 2.8%), Security & Protection (36 | 2.3%), Law Enforcement (36 | 2.3%), and Healthcare Support (32 | 2.0%).
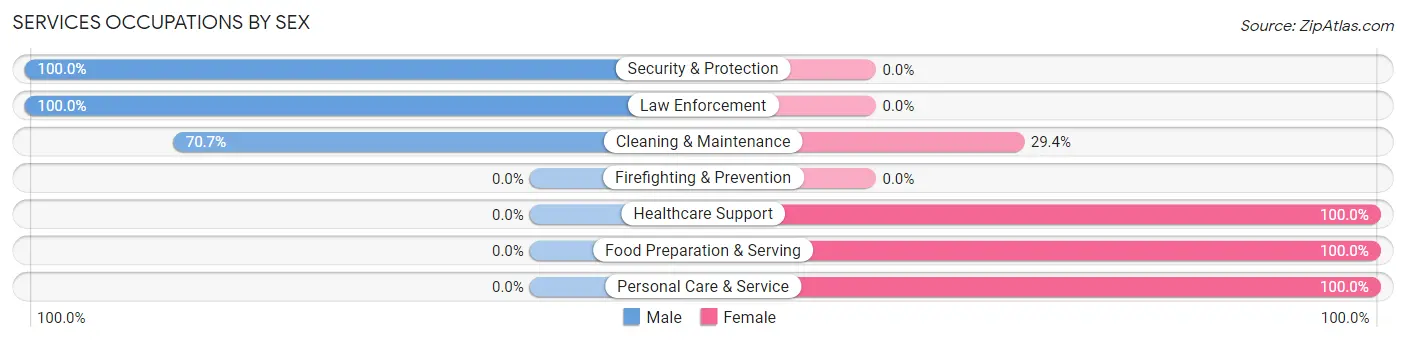
Services Occupations by Sex
Within the Services occupations in Blackhawk, the most male-oriented occupations are Security & Protection (100.0%), Law Enforcement (100.0%), and Cleaning & Maintenance (70.7%), while the most female-oriented occupations are Healthcare Support (100.0%), Food Preparation & Serving (100.0%), and Personal Care & Service (100.0%).
| Occupation | Male | Female |
| Healthcare Support | 0 (0.0%) | 32 (100.0%) |
| Security & Protection | 36 (100.0%) | 0 (0.0%) |
| Firefighting & Prevention | 0 (0.0%) | 0 (0.0%) |
| Law Enforcement | 36 (100.0%) | 0 (0.0%) |
| Food Preparation & Serving | 0 (0.0%) | 21 (100.0%) |
| Cleaning & Maintenance | 142 (70.7%) | 59 (29.3%) |
| Personal Care & Service | 0 (0.0%) | 45 (100.0%) |
| Total (Category) | 178 (53.1%) | 157 (46.9%) |
| Total (Overall) | 714 (44.7%) | 882 (55.3%) |
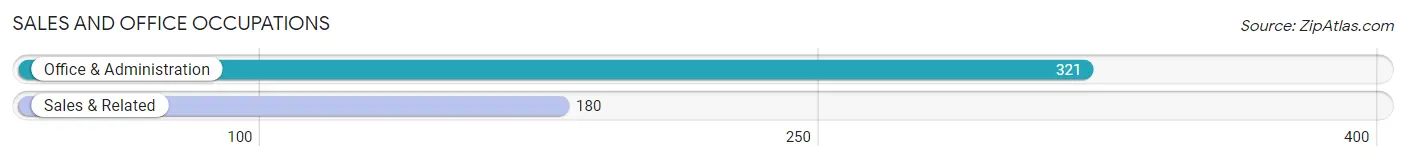
Sales and Office Occupations
The most common Sales and Office occupations in Blackhawk are Office & Administration (321 | 20.1%), and Sales & Related (180 | 11.3%).
Sales and Office Occupations by Sex
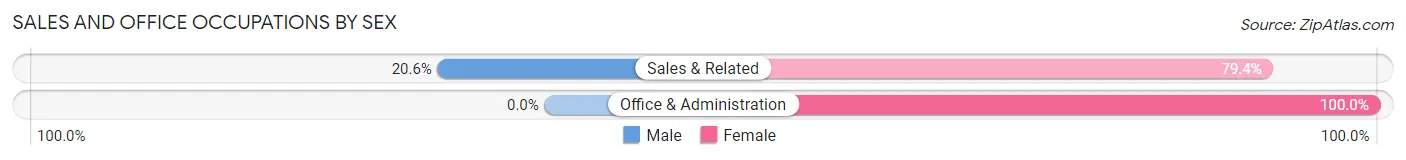
| Occupation | Male | Female |
| Sales & Related | 37 (20.6%) | 143 (79.4%) |
| Office & Administration | 0 (0.0%) | 321 (100.0%) |
| Total (Category) | 37 (7.4%) | 464 (92.6%) |
| Total (Overall) | 714 (44.7%) | 882 (55.3%) |
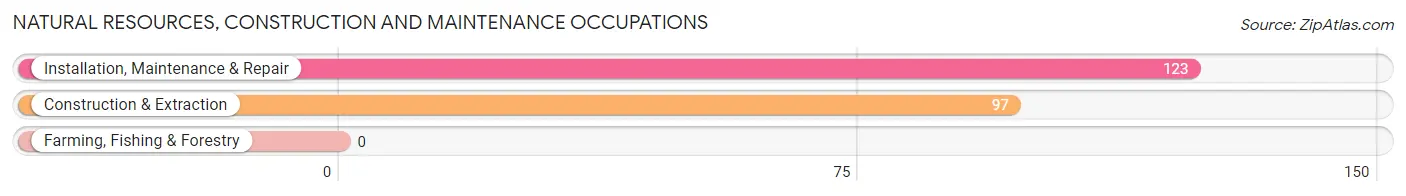
Natural Resources, Construction and Maintenance Occupations
The most common Natural Resources, Construction and Maintenance occupations in Blackhawk are Installation, Maintenance & Repair (123 | 7.7%), and Construction & Extraction (97 | 6.1%).
Natural Resources, Construction and Maintenance Occupations by Sex
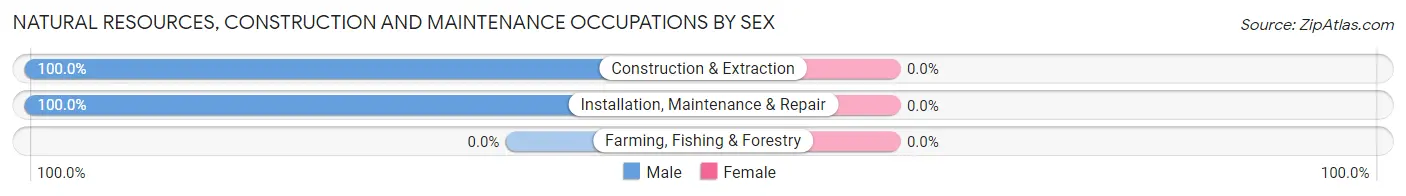
| Occupation | Male | Female |
| Farming, Fishing & Forestry | 0 (0.0%) | 0 (0.0%) |
| Construction & Extraction | 97 (100.0%) | 0 (0.0%) |
| Installation, Maintenance & Repair | 123 (100.0%) | 0 (0.0%) |
| Total (Category) | 220 (100.0%) | 0 (0.0%) |
| Total (Overall) | 714 (44.7%) | 882 (55.3%) |
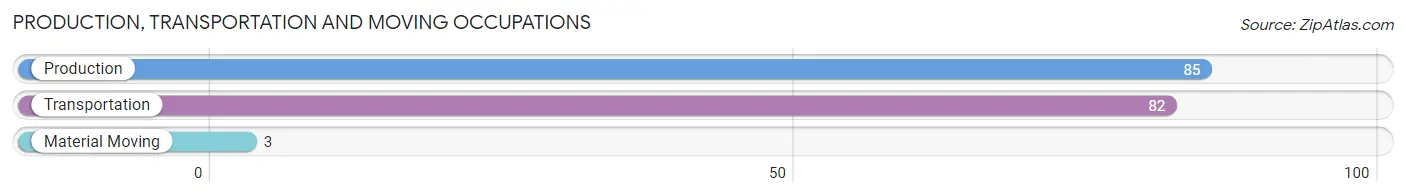
Production, Transportation and Moving Occupations
The most common Production, Transportation and Moving occupations in Blackhawk are Production (85 | 5.3%), Transportation (82 | 5.1%), and Material Moving (3 | 0.2%).
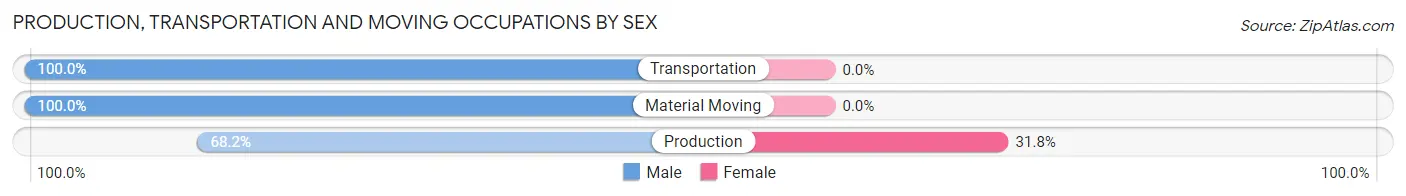
Production, Transportation and Moving Occupations by Sex
| Occupation | Male | Female |
| Production | 58 (68.2%) | 27 (31.8%) |
| Transportation | 82 (100.0%) | 0 (0.0%) |
| Material Moving | 3 (100.0%) | 0 (0.0%) |
| Total (Category) | 143 (84.1%) | 27 (15.9%) |
| Total (Overall) | 714 (44.7%) | 882 (55.3%) |
Employment Industries by Sex in Blackhawk
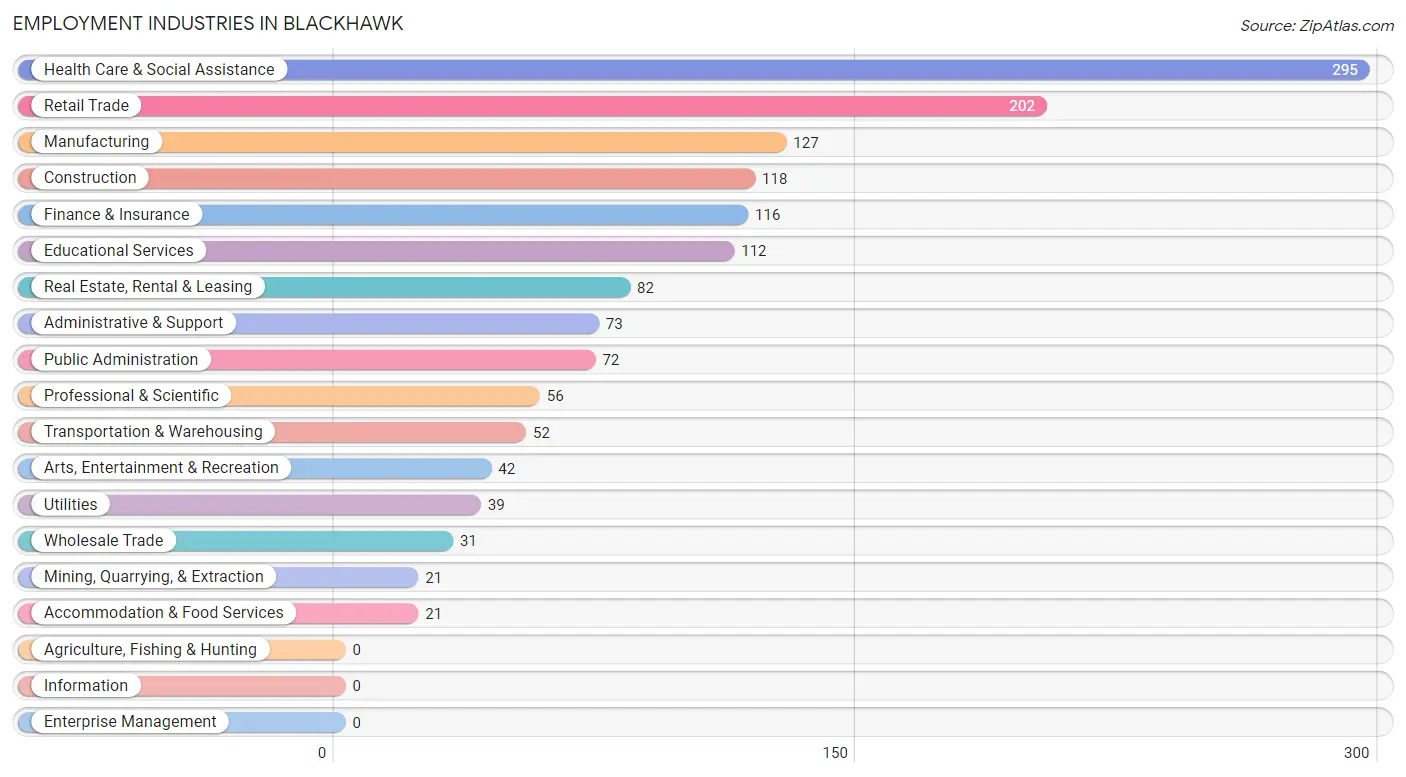
Employment Industries in Blackhawk
The major employment industries in Blackhawk include Health Care & Social Assistance (295 | 18.5%), Retail Trade (202 | 12.7%), Manufacturing (127 | 8.0%), Construction (118 | 7.4%), and Finance & Insurance (116 | 7.3%).
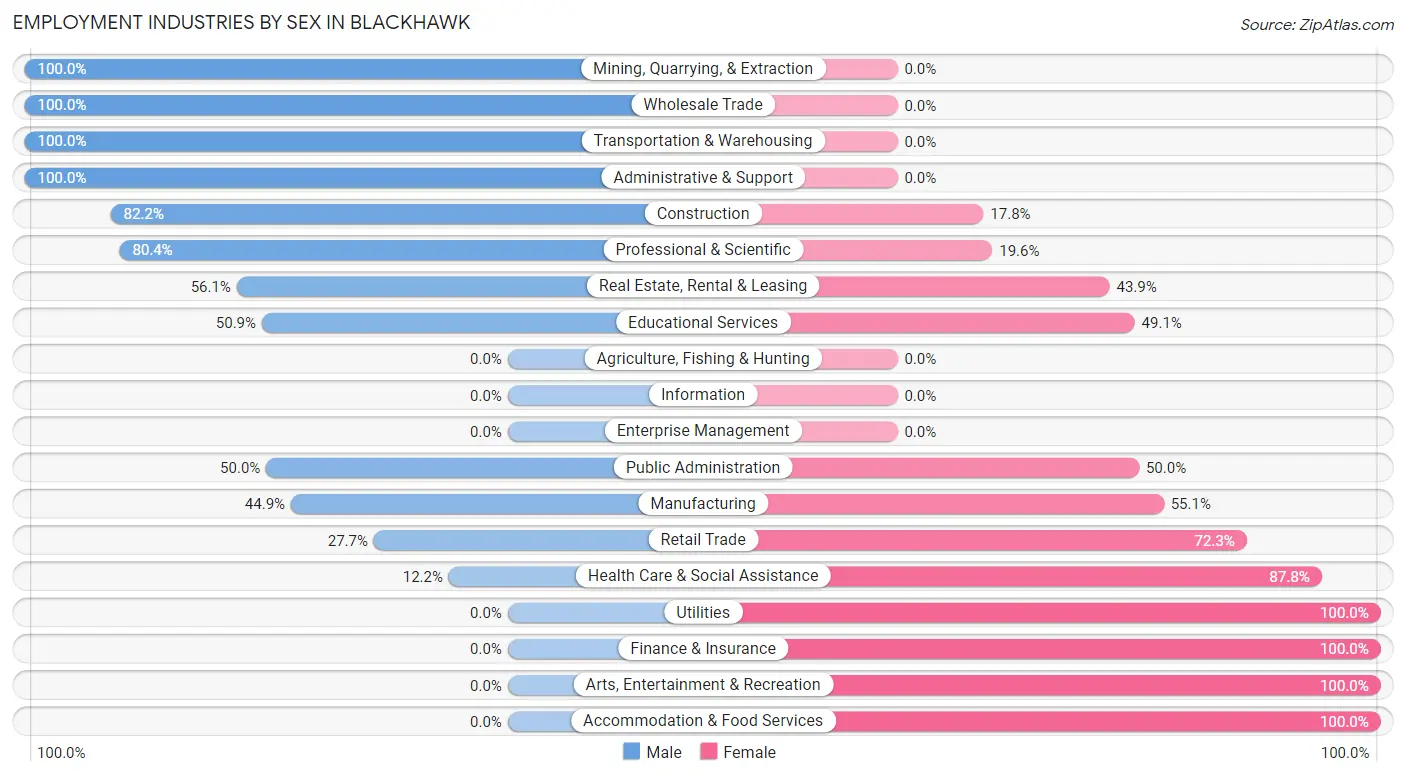
Employment Industries by Sex in Blackhawk
The Blackhawk industries that see more men than women are Mining, Quarrying, & Extraction (100.0%), Wholesale Trade (100.0%), and Transportation & Warehousing (100.0%), whereas the industries that tend to have a higher number of women are Utilities (100.0%), Finance & Insurance (100.0%), and Arts, Entertainment & Recreation (100.0%).
| Industry | Male | Female |
| Agriculture, Fishing & Hunting | 0 (0.0%) | 0 (0.0%) |
| Mining, Quarrying, & Extraction | 21 (100.0%) | 0 (0.0%) |
| Construction | 97 (82.2%) | 21 (17.8%) |
| Manufacturing | 57 (44.9%) | 70 (55.1%) |
| Wholesale Trade | 31 (100.0%) | 0 (0.0%) |
| Retail Trade | 56 (27.7%) | 146 (72.3%) |
| Transportation & Warehousing | 52 (100.0%) | 0 (0.0%) |
| Utilities | 0 (0.0%) | 39 (100.0%) |
| Information | 0 (0.0%) | 0 (0.0%) |
| Finance & Insurance | 0 (0.0%) | 116 (100.0%) |
| Real Estate, Rental & Leasing | 46 (56.1%) | 36 (43.9%) |
| Professional & Scientific | 45 (80.4%) | 11 (19.6%) |
| Enterprise Management | 0 (0.0%) | 0 (0.0%) |
| Administrative & Support | 73 (100.0%) | 0 (0.0%) |
| Educational Services | 57 (50.9%) | 55 (49.1%) |
| Health Care & Social Assistance | 36 (12.2%) | 259 (87.8%) |
| Arts, Entertainment & Recreation | 0 (0.0%) | 42 (100.0%) |
| Accommodation & Food Services | 0 (0.0%) | 21 (100.0%) |
| Public Administration | 36 (50.0%) | 36 (50.0%) |
| Total | 714 (44.7%) | 882 (55.3%) |
Education in Blackhawk
School Enrollment in Blackhawk
The most common levels of schooling among the 397 students in Blackhawk are middle school (158 | 39.8%), elementary school (79 | 19.9%), and kindergarten (68 | 17.1%).
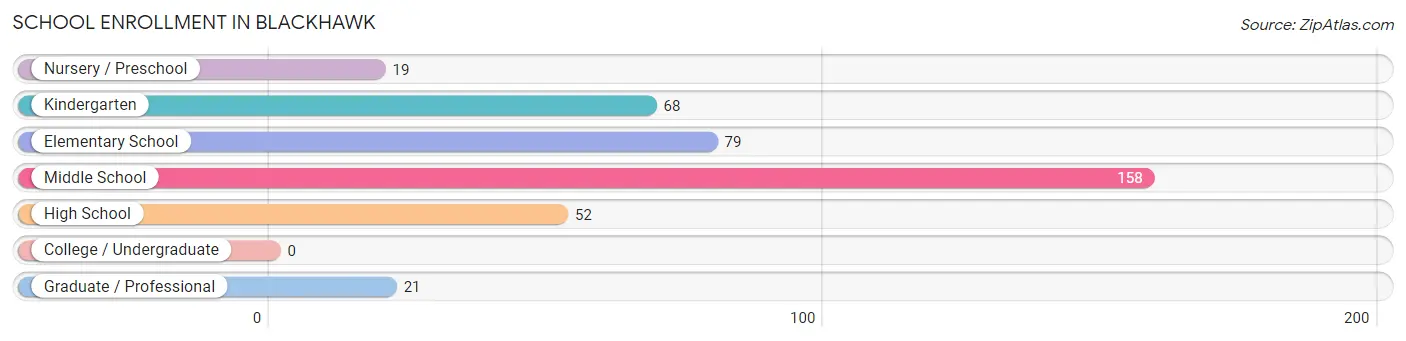
| School Level | # Students | % Students |
| Nursery / Preschool | 19 | 4.8% |
| Kindergarten | 68 | 17.1% |
| Elementary School | 79 | 19.9% |
| Middle School | 158 | 39.8% |
| High School | 52 | 13.1% |
| College / Undergraduate | 0 | 0.0% |
| Graduate / Professional | 21 | 5.3% |
| Total | 397 | 100.0% |
School Enrollment by Age by Funding Source in Blackhawk
Out of a total of 397 students who are enrolled in schools in Blackhawk, 59 (14.9%) attend a private institution, while the remaining 338 (85.1%) are enrolled in public schools. The age group of 10 to 14 year olds has the highest likelihood of being enrolled in private schools, with 40 (21.3% in the age bracket) enrolled. Conversely, the age group of 15 to 17 year olds has the lowest likelihood of being enrolled in a private school, with 52 (100.0% in the age bracket) attending a public institution.
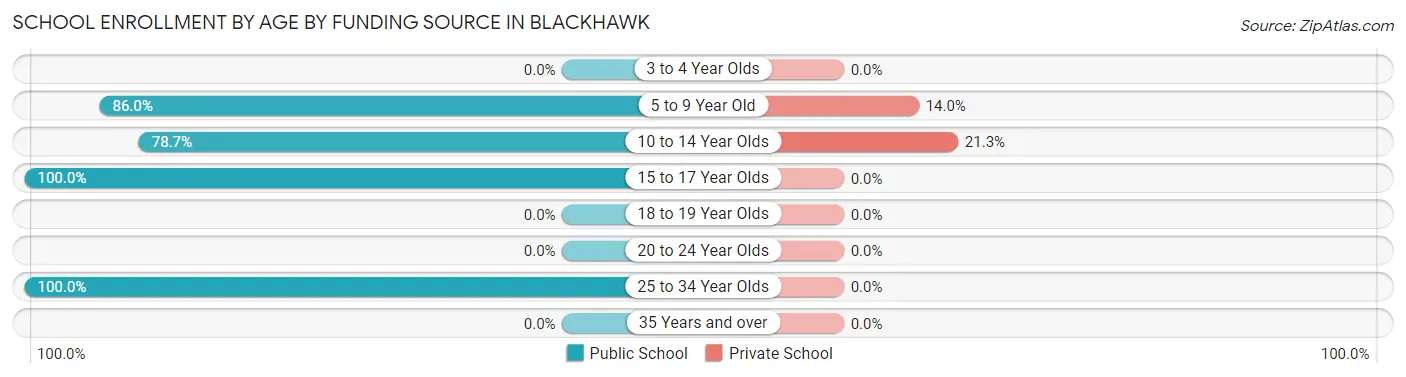
| Age Bracket | Public School | Private School |
| 3 to 4 Year Olds | 0 (0.0%) | 0 (0.0%) |
| 5 to 9 Year Old | 117 (86.0%) | 19 (14.0%) |
| 10 to 14 Year Olds | 148 (78.7%) | 40 (21.3%) |
| 15 to 17 Year Olds | 52 (100.0%) | 0 (0.0%) |
| 18 to 19 Year Olds | 0 (0.0%) | 0 (0.0%) |
| 20 to 24 Year Olds | 0 (0.0%) | 0 (0.0%) |
| 25 to 34 Year Olds | 21 (100.0%) | 0 (0.0%) |
| 35 Years and over | 0 (0.0%) | 0 (0.0%) |
| Total | 338 (85.1%) | 59 (14.9%) |
Educational Attainment by Field of Study in Blackhawk
Business (86 | 20.5%), education (75 | 17.9%), science & technology (68 | 16.2%), arts & humanities (41 | 9.8%), and social sciences (32 | 7.6%) are the most common fields of study among 419 individuals in Blackhawk who have obtained a bachelor's degree or higher.
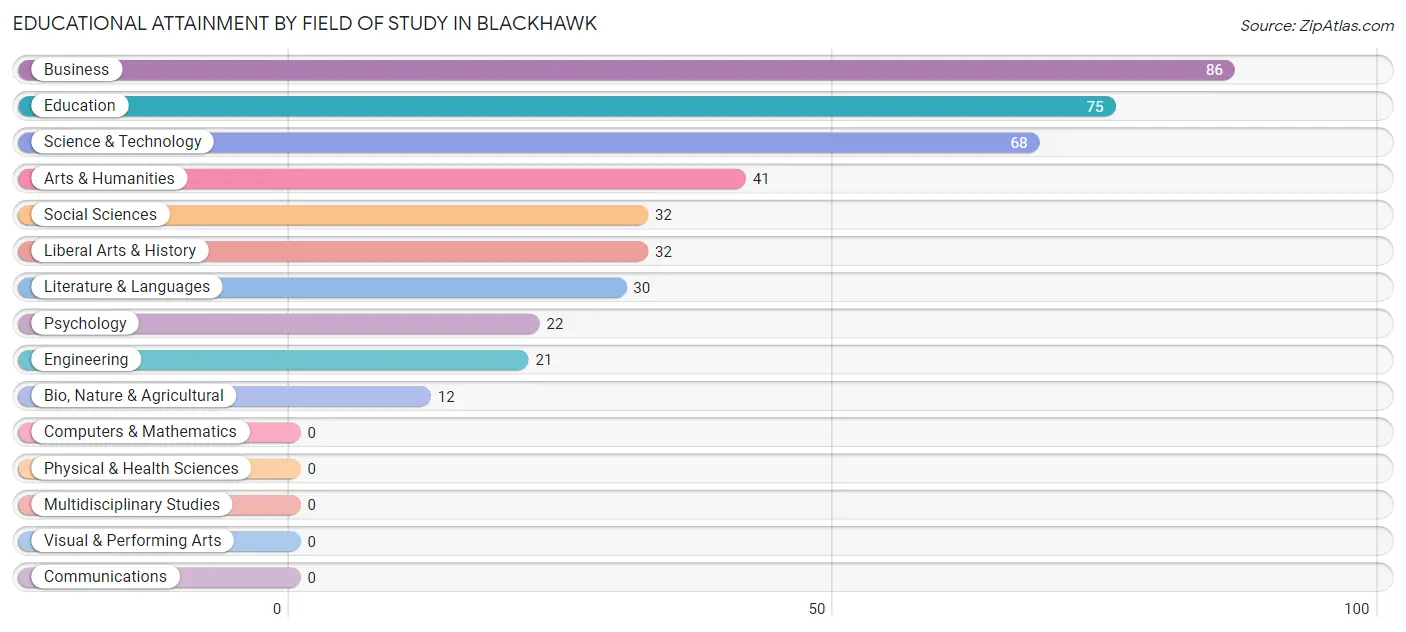
| Field of Study | # Graduates | % Graduates |
| Computers & Mathematics | 0 | 0.0% |
| Bio, Nature & Agricultural | 12 | 2.9% |
| Physical & Health Sciences | 0 | 0.0% |
| Psychology | 22 | 5.2% |
| Social Sciences | 32 | 7.6% |
| Engineering | 21 | 5.0% |
| Multidisciplinary Studies | 0 | 0.0% |
| Science & Technology | 68 | 16.2% |
| Business | 86 | 20.5% |
| Education | 75 | 17.9% |
| Literature & Languages | 30 | 7.2% |
| Liberal Arts & History | 32 | 7.6% |
| Visual & Performing Arts | 0 | 0.0% |
| Communications | 0 | 0.0% |
| Arts & Humanities | 41 | 9.8% |
| Total | 419 | 100.0% |
Transportation & Commute in Blackhawk
Vehicle Availability by Sex in Blackhawk
The most prevalent vehicle ownership categories in Blackhawk are males with 2 vehicles (307, accounting for 40.3%) and females with 2 vehicles (372, making up 35.7%).
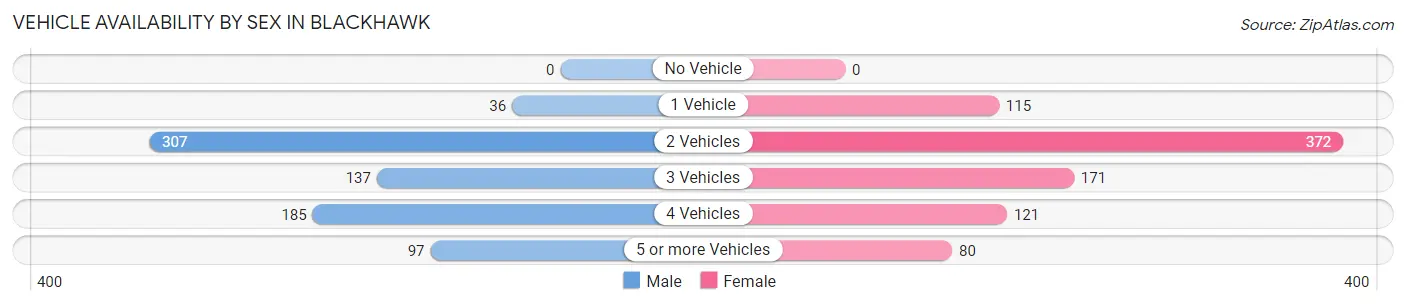
| Vehicles Available | Male | Female |
| No Vehicle | 0 (0.0%) | 0 (0.0%) |
| 1 Vehicle | 36 (4.7%) | 115 (13.4%) |
| 2 Vehicles | 307 (40.3%) | 372 (43.3%) |
| 3 Vehicles | 137 (18.0%) | 171 (19.9%) |
| 4 Vehicles | 185 (24.3%) | 121 (14.1%) |
| 5 or more Vehicles | 97 (12.7%) | 80 (9.3%) |
| Total | 762 (100.0%) | 859 (100.0%) |
Commute Time in Blackhawk
The most frequently occuring commute durations in Blackhawk are 20 to 24 minutes (464 commuters, 29.7%), 15 to 19 minutes (344 commuters, 22.1%), and 10 to 14 minutes (246 commuters, 15.8%).
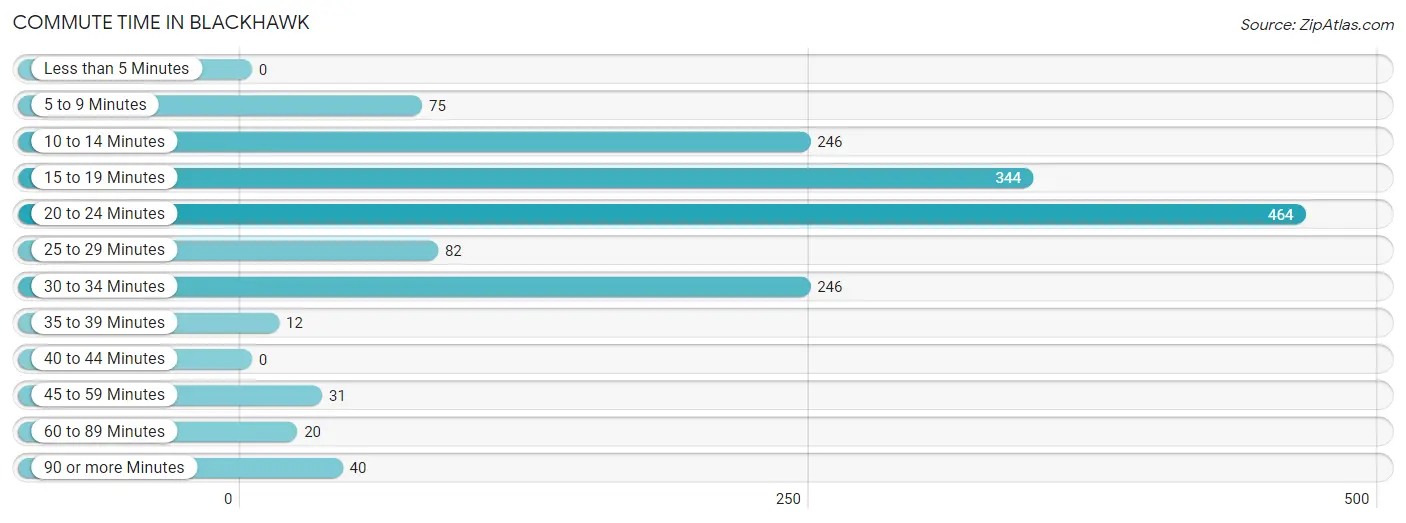
| Commute Time | # Commuters | % Commuters |
| Less than 5 Minutes | 0 | 0.0% |
| 5 to 9 Minutes | 75 | 4.8% |
| 10 to 14 Minutes | 246 | 15.8% |
| 15 to 19 Minutes | 344 | 22.1% |
| 20 to 24 Minutes | 464 | 29.7% |
| 25 to 29 Minutes | 82 | 5.3% |
| 30 to 34 Minutes | 246 | 15.8% |
| 35 to 39 Minutes | 12 | 0.8% |
| 40 to 44 Minutes | 0 | 0.0% |
| 45 to 59 Minutes | 31 | 2.0% |
| 60 to 89 Minutes | 20 | 1.3% |
| 90 or more Minutes | 40 | 2.6% |
Commute Time by Sex in Blackhawk
The most common commute times in Blackhawk are 20 to 24 minutes (269 commuters, 35.2%) for males and 15 to 19 minutes (253 commuters, 31.8%) for females.
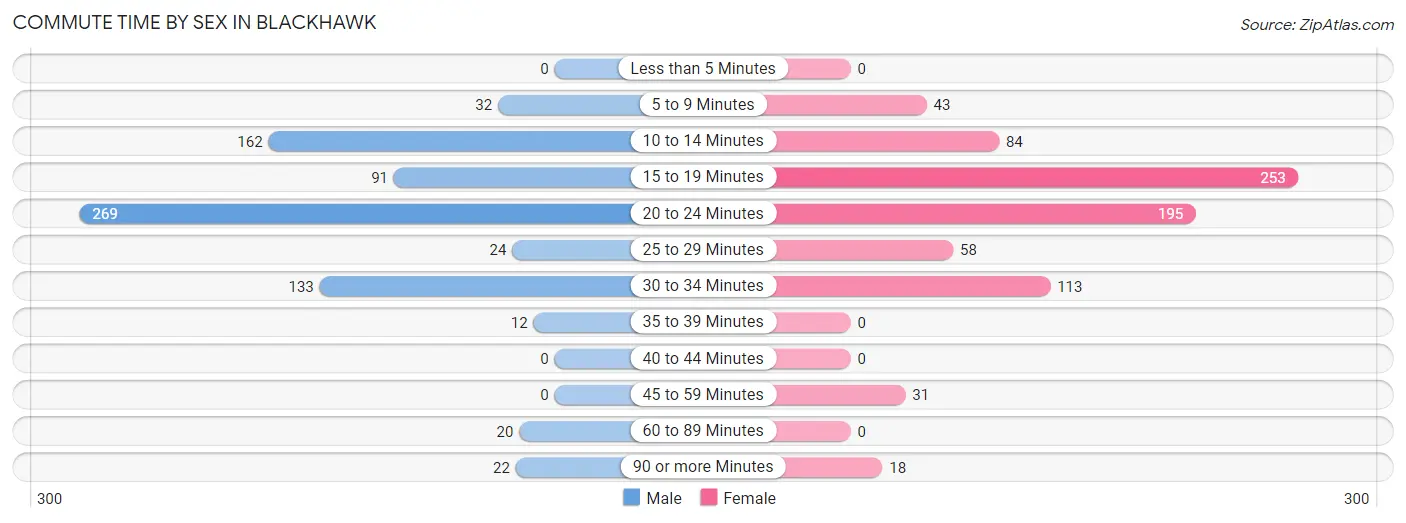
| Commute Time | Male | Female |
| Less than 5 Minutes | 0 (0.0%) | 0 (0.0%) |
| 5 to 9 Minutes | 32 (4.2%) | 43 (5.4%) |
| 10 to 14 Minutes | 162 (21.2%) | 84 (10.6%) |
| 15 to 19 Minutes | 91 (11.9%) | 253 (31.8%) |
| 20 to 24 Minutes | 269 (35.2%) | 195 (24.5%) |
| 25 to 29 Minutes | 24 (3.1%) | 58 (7.3%) |
| 30 to 34 Minutes | 133 (17.4%) | 113 (14.2%) |
| 35 to 39 Minutes | 12 (1.6%) | 0 (0.0%) |
| 40 to 44 Minutes | 0 (0.0%) | 0 (0.0%) |
| 45 to 59 Minutes | 0 (0.0%) | 31 (3.9%) |
| 60 to 89 Minutes | 20 (2.6%) | 0 (0.0%) |
| 90 or more Minutes | 22 (2.9%) | 18 (2.3%) |
Time of Departure to Work by Sex in Blackhawk
The most frequent times of departure to work in Blackhawk are 7:00 AM to 7:29 AM (201, 26.3%) for males and 7:30 AM to 7:59 AM (326, 41.0%) for females.
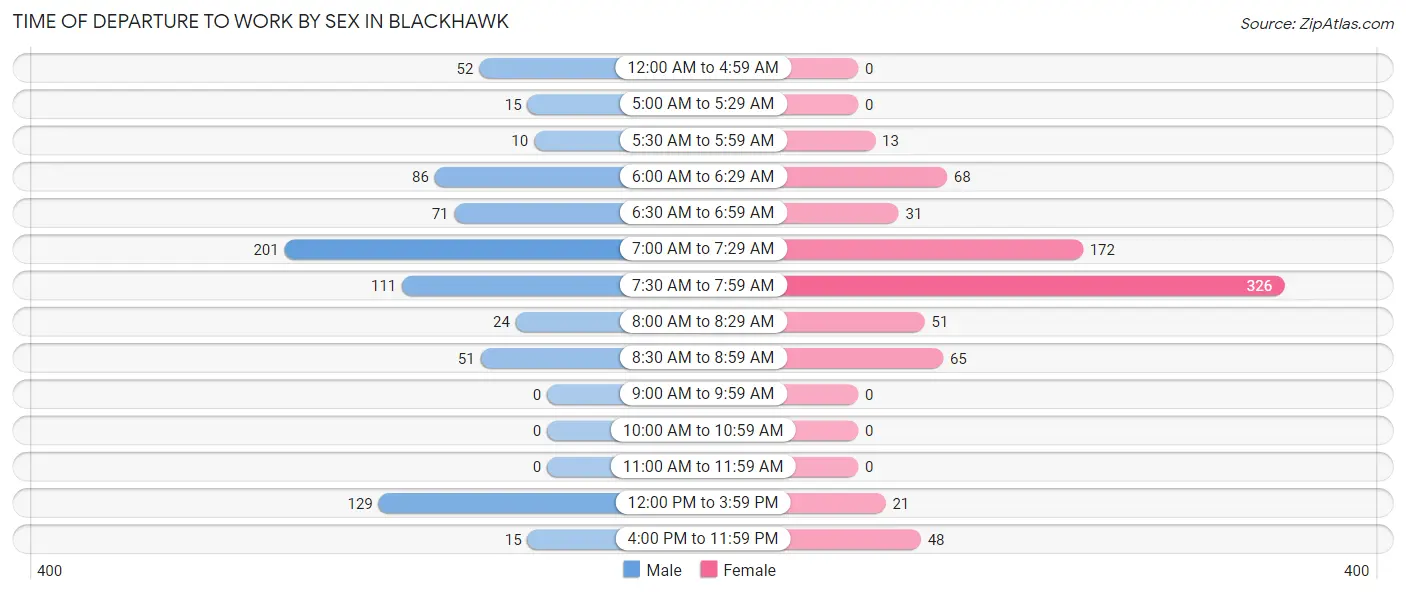
| Time of Departure | Male | Female |
| 12:00 AM to 4:59 AM | 52 (6.8%) | 0 (0.0%) |
| 5:00 AM to 5:29 AM | 15 (2.0%) | 0 (0.0%) |
| 5:30 AM to 5:59 AM | 10 (1.3%) | 13 (1.6%) |
| 6:00 AM to 6:29 AM | 86 (11.2%) | 68 (8.6%) |
| 6:30 AM to 6:59 AM | 71 (9.3%) | 31 (3.9%) |
| 7:00 AM to 7:29 AM | 201 (26.3%) | 172 (21.6%) |
| 7:30 AM to 7:59 AM | 111 (14.5%) | 326 (41.0%) |
| 8:00 AM to 8:29 AM | 24 (3.1%) | 51 (6.4%) |
| 8:30 AM to 8:59 AM | 51 (6.7%) | 65 (8.2%) |
| 9:00 AM to 9:59 AM | 0 (0.0%) | 0 (0.0%) |
| 10:00 AM to 10:59 AM | 0 (0.0%) | 0 (0.0%) |
| 11:00 AM to 11:59 AM | 0 (0.0%) | 0 (0.0%) |
| 12:00 PM to 3:59 PM | 129 (16.9%) | 21 (2.6%) |
| 4:00 PM to 11:59 PM | 15 (2.0%) | 48 (6.0%) |
| Total | 765 (100.0%) | 795 (100.0%) |
Housing Occupancy in Blackhawk
Occupancy by Ownership in Blackhawk
Of the total 1,273 dwellings in Blackhawk, owner-occupied units account for 1,230 (96.6%), while renter-occupied units make up 43 (3.4%).
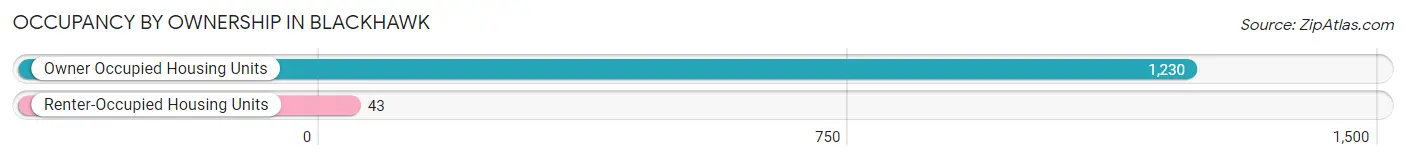
| Occupancy | # Housing Units | % Housing Units |
| Owner Occupied Housing Units | 1,230 | 96.6% |
| Renter-Occupied Housing Units | 43 | 3.4% |
| Total Occupied Housing Units | 1,273 | 100.0% |
Occupancy by Household Size in Blackhawk
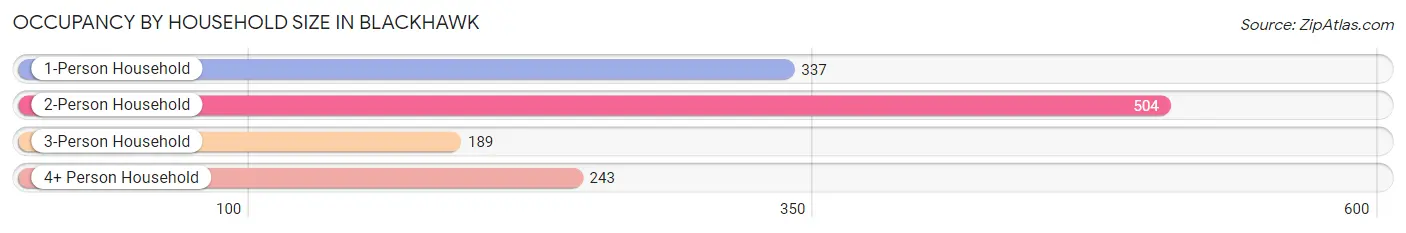
| Household Size | # Housing Units | % Housing Units |
| 1-Person Household | 337 | 26.5% |
| 2-Person Household | 504 | 39.6% |
| 3-Person Household | 189 | 14.8% |
| 4+ Person Household | 243 | 19.1% |
| Total Housing Units | 1,273 | 100.0% |
Occupancy by Ownership by Household Size in Blackhawk
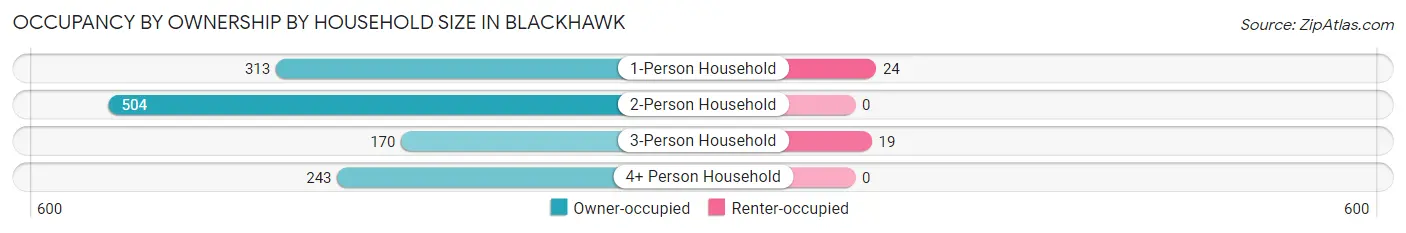
| Household Size | Owner-occupied | Renter-occupied |
| 1-Person Household | 313 (92.9%) | 24 (7.1%) |
| 2-Person Household | 504 (100.0%) | 0 (0.0%) |
| 3-Person Household | 170 (89.9%) | 19 (10.1%) |
| 4+ Person Household | 243 (100.0%) | 0 (0.0%) |
| Total Housing Units | 1,230 (96.6%) | 43 (3.4%) |
Occupancy by Educational Attainment in Blackhawk
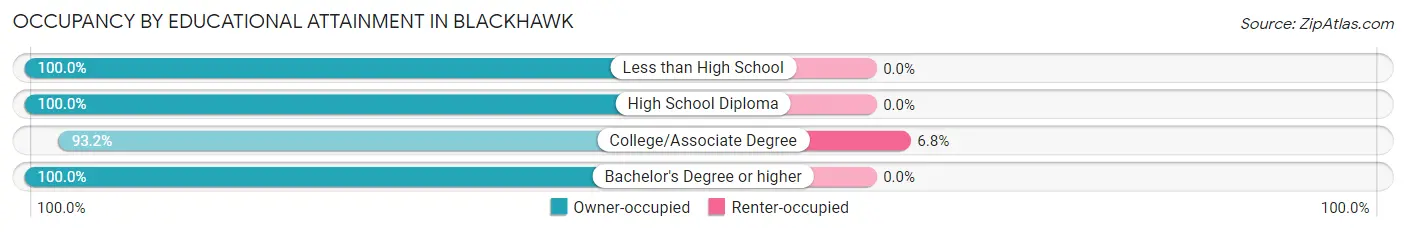
| Household Size | Owner-occupied | Renter-occupied |
| Less than High School | 211 (100.0%) | 0 (0.0%) |
| High School Diploma | 210 (100.0%) | 0 (0.0%) |
| College/Associate Degree | 590 (93.2%) | 43 (6.8%) |
| Bachelor's Degree or higher | 219 (100.0%) | 0 (0.0%) |
Occupancy by Age of Householder in Blackhawk
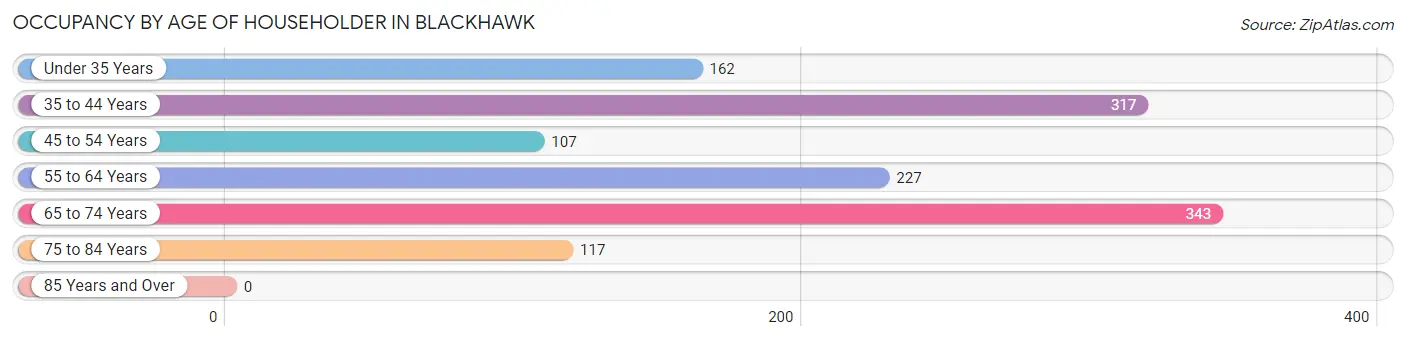
| Age Bracket | # Households | % Households |
| Under 35 Years | 162 | 12.7% |
| 35 to 44 Years | 317 | 24.9% |
| 45 to 54 Years | 107 | 8.4% |
| 55 to 64 Years | 227 | 17.8% |
| 65 to 74 Years | 343 | 26.9% |
| 75 to 84 Years | 117 | 9.2% |
| 85 Years and Over | 0 | 0.0% |
| Total | 1,273 | 100.0% |
Housing Finances in Blackhawk
Median Income by Occupancy in Blackhawk
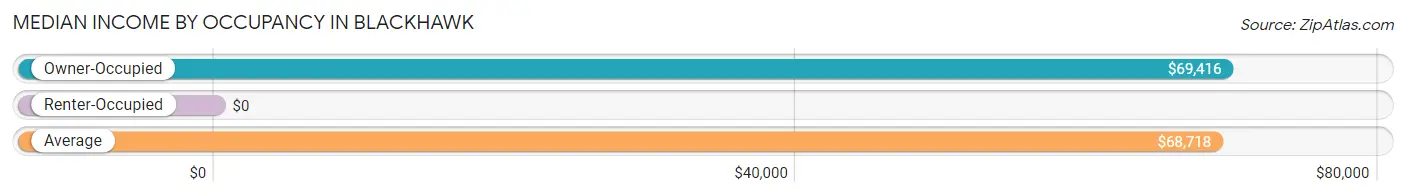
| Occupancy Type | # Households | Median Income |
| Owner-Occupied | 1,230 (96.6%) | $69,416 |
| Renter-Occupied | 43 (3.4%) | $0 |
| Average | 1,273 (100.0%) | $68,718 |
Occupancy by Householder Income Bracket in Blackhawk
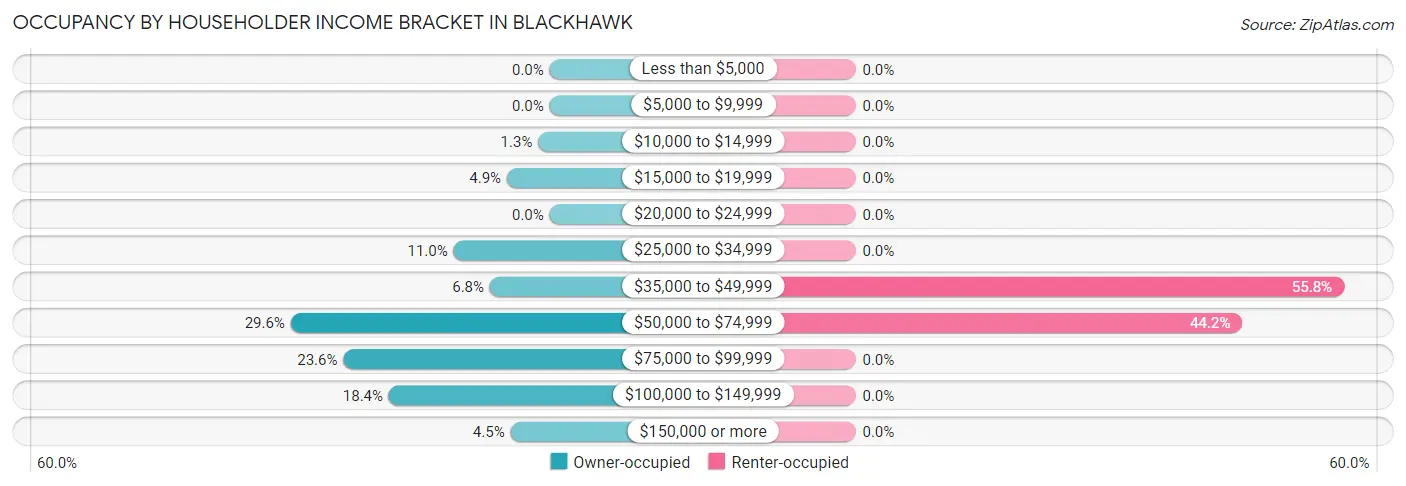
| Income Bracket | Owner-occupied | Renter-occupied |
| Less than $5,000 | 0 (0.0%) | 0 (0.0%) |
| $5,000 to $9,999 | 0 (0.0%) | 0 (0.0%) |
| $10,000 to $14,999 | 16 (1.3%) | 0 (0.0%) |
| $15,000 to $19,999 | 60 (4.9%) | 0 (0.0%) |
| $20,000 to $24,999 | 0 (0.0%) | 0 (0.0%) |
| $25,000 to $34,999 | 135 (11.0%) | 0 (0.0%) |
| $35,000 to $49,999 | 84 (6.8%) | 24 (55.8%) |
| $50,000 to $74,999 | 364 (29.6%) | 19 (44.2%) |
| $75,000 to $99,999 | 290 (23.6%) | 0 (0.0%) |
| $100,000 to $149,999 | 226 (18.4%) | 0 (0.0%) |
| $150,000 or more | 55 (4.5%) | 0 (0.0%) |
| Total | 1,230 (100.0%) | 43 (100.0%) |
Monthly Housing Cost Tiers in Blackhawk
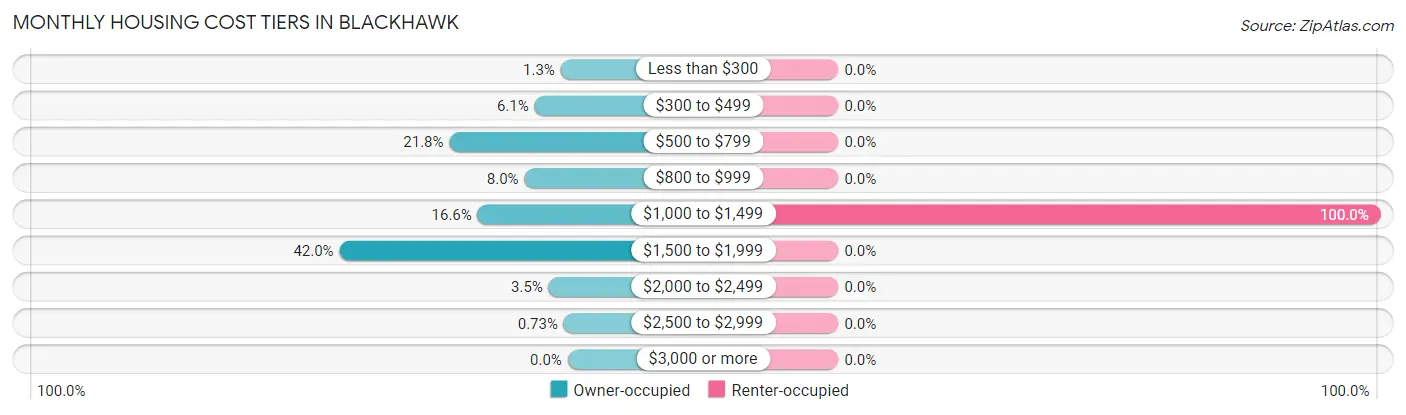
| Monthly Cost | Owner-occupied | Renter-occupied |
| Less than $300 | 16 (1.3%) | 0 (0.0%) |
| $300 to $499 | 75 (6.1%) | 0 (0.0%) |
| $500 to $799 | 268 (21.8%) | 0 (0.0%) |
| $800 to $999 | 98 (8.0%) | 0 (0.0%) |
| $1,000 to $1,499 | 204 (16.6%) | 43 (100.0%) |
| $1,500 to $1,999 | 517 (42.0%) | 0 (0.0%) |
| $2,000 to $2,499 | 43 (3.5%) | 0 (0.0%) |
| $2,500 to $2,999 | 9 (0.7%) | 0 (0.0%) |
| $3,000 or more | 0 (0.0%) | 0 (0.0%) |
| Total | 1,230 (100.0%) | 43 (100.0%) |
Physical Housing Characteristics in Blackhawk
Housing Structures in Blackhawk
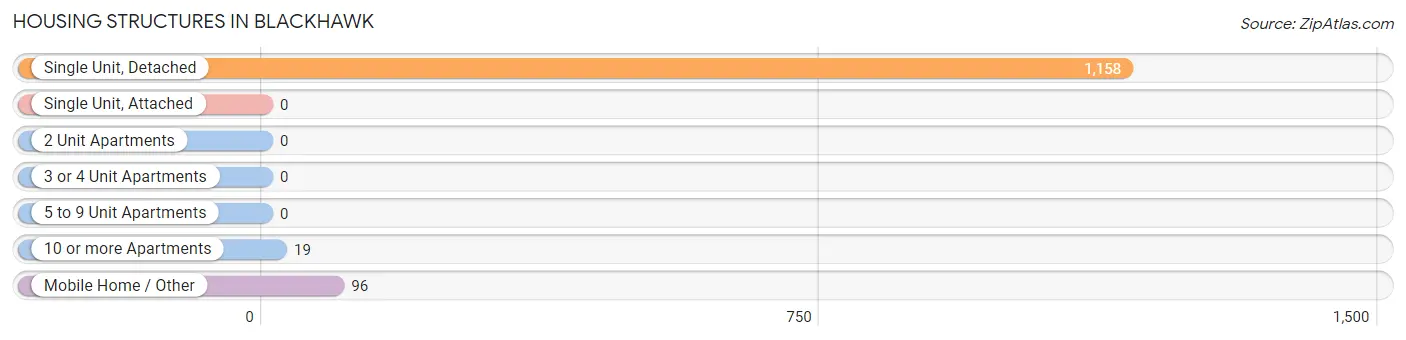
| Structure Type | # Housing Units | % Housing Units |
| Single Unit, Detached | 1,158 | 91.0% |
| Single Unit, Attached | 0 | 0.0% |
| 2 Unit Apartments | 0 | 0.0% |
| 3 or 4 Unit Apartments | 0 | 0.0% |
| 5 to 9 Unit Apartments | 0 | 0.0% |
| 10 or more Apartments | 19 | 1.5% |
| Mobile Home / Other | 96 | 7.5% |
| Total | 1,273 | 100.0% |
Housing Structures by Occupancy in Blackhawk
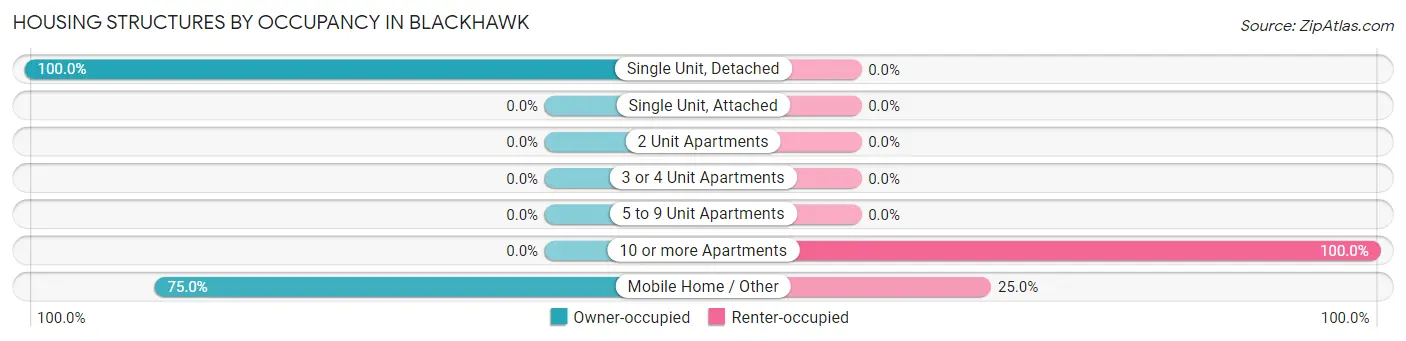
| Structure Type | Owner-occupied | Renter-occupied |
| Single Unit, Detached | 1,158 (100.0%) | 0 (0.0%) |
| Single Unit, Attached | 0 (0.0%) | 0 (0.0%) |
| 2 Unit Apartments | 0 (0.0%) | 0 (0.0%) |
| 3 or 4 Unit Apartments | 0 (0.0%) | 0 (0.0%) |
| 5 to 9 Unit Apartments | 0 (0.0%) | 0 (0.0%) |
| 10 or more Apartments | 0 (0.0%) | 19 (100.0%) |
| Mobile Home / Other | 72 (75.0%) | 24 (25.0%) |
| Total | 1,230 (96.6%) | 43 (3.4%) |
Housing Structures by Number of Rooms in Blackhawk
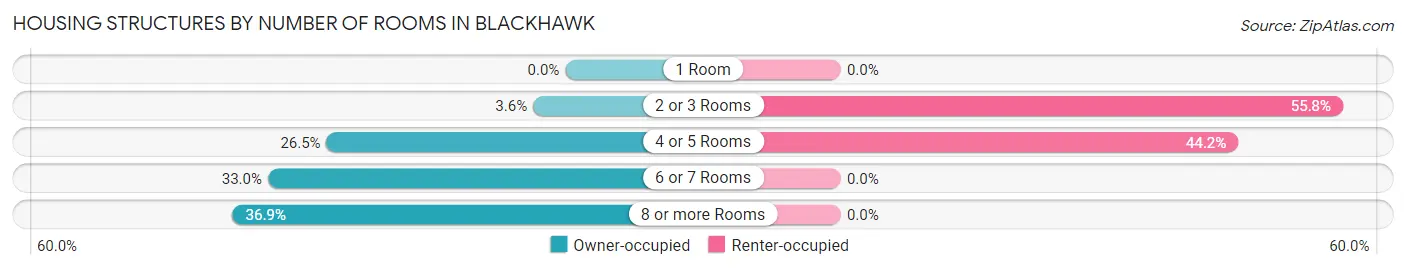
| Number of Rooms | Owner-occupied | Renter-occupied |
| 1 Room | 0 (0.0%) | 0 (0.0%) |
| 2 or 3 Rooms | 44 (3.6%) | 24 (55.8%) |
| 4 or 5 Rooms | 326 (26.5%) | 19 (44.2%) |
| 6 or 7 Rooms | 406 (33.0%) | 0 (0.0%) |
| 8 or more Rooms | 454 (36.9%) | 0 (0.0%) |
| Total | 1,230 (100.0%) | 43 (100.0%) |
Housing Structure by Heating Type in Blackhawk
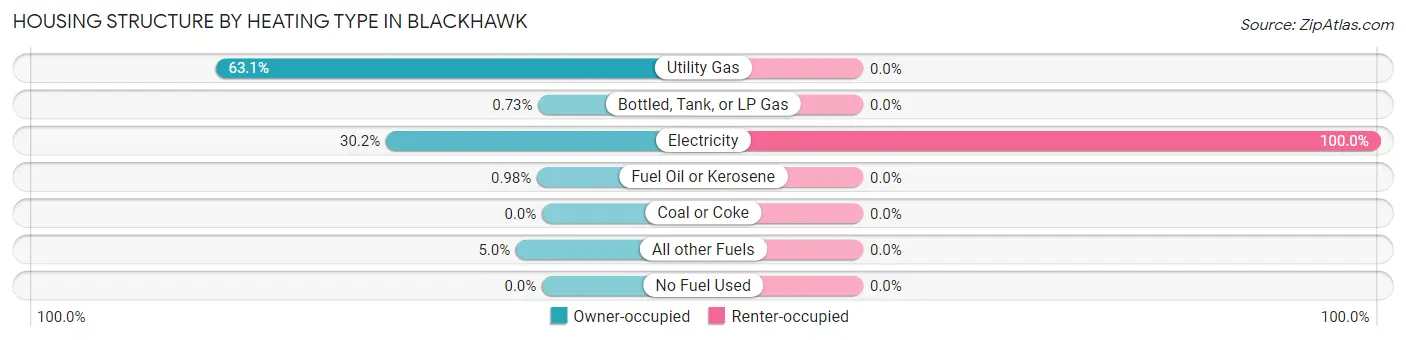
| Heating Type | Owner-occupied | Renter-occupied |
| Utility Gas | 776 (63.1%) | 0 (0.0%) |
| Bottled, Tank, or LP Gas | 9 (0.7%) | 0 (0.0%) |
| Electricity | 371 (30.2%) | 43 (100.0%) |
| Fuel Oil or Kerosene | 12 (1.0%) | 0 (0.0%) |
| Coal or Coke | 0 (0.0%) | 0 (0.0%) |
| All other Fuels | 62 (5.0%) | 0 (0.0%) |
| No Fuel Used | 0 (0.0%) | 0 (0.0%) |
| Total | 1,230 (100.0%) | 43 (100.0%) |
Household Vehicle Usage in Blackhawk
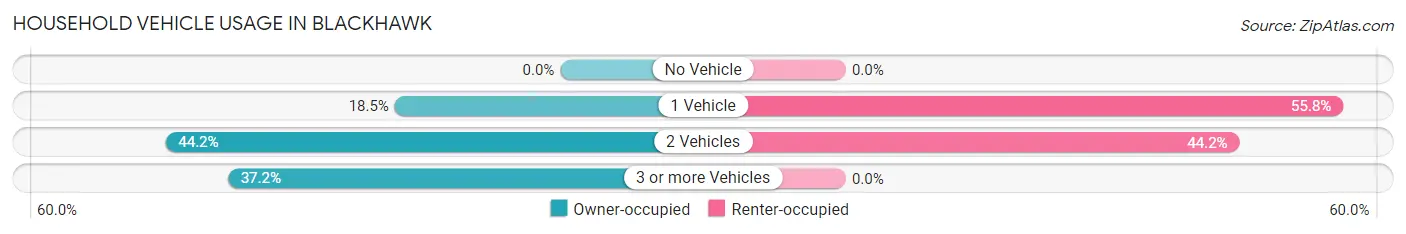
| Vehicles per Household | Owner-occupied | Renter-occupied |
| No Vehicle | 0 (0.0%) | 0 (0.0%) |
| 1 Vehicle | 228 (18.5%) | 24 (55.8%) |
| 2 Vehicles | 544 (44.2%) | 19 (44.2%) |
| 3 or more Vehicles | 458 (37.2%) | 0 (0.0%) |
| Total | 1,230 (100.0%) | 43 (100.0%) |
Real Estate & Mortgages in Blackhawk
Real Estate and Mortgage Overview in Blackhawk
| Characteristic | Without Mortgage | With Mortgage |
| Housing Units | 338 | 892 |
| Median Property Value | $312,000 | $224,200 |
| Median Household Income | $55,872 | $55 |
| Monthly Housing Costs | $580 | $0 |
| Real Estate Taxes | $2,506 | $0 |
Property Value by Mortgage Status in Blackhawk
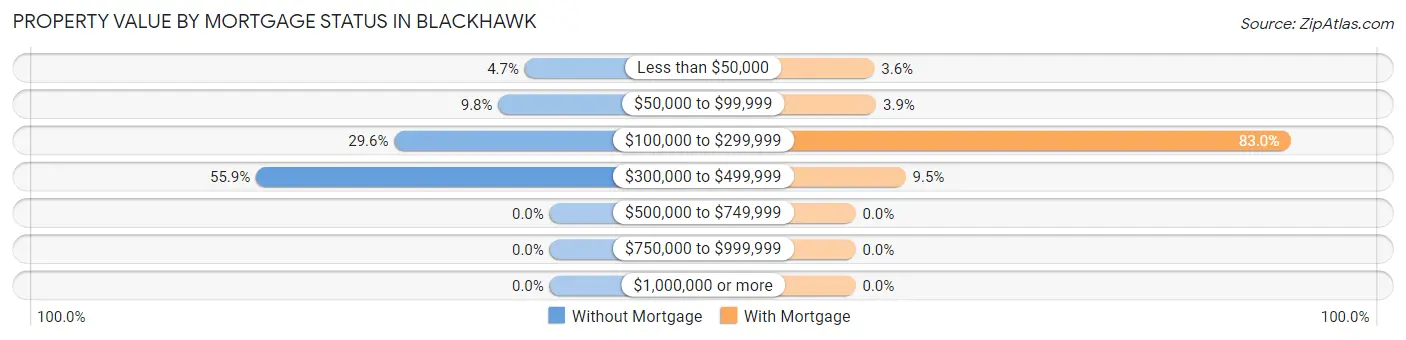
| Property Value | Without Mortgage | With Mortgage |
| Less than $50,000 | 16 (4.7%) | 32 (3.6%) |
| $50,000 to $99,999 | 33 (9.8%) | 35 (3.9%) |
| $100,000 to $299,999 | 100 (29.6%) | 740 (83.0%) |
| $300,000 to $499,999 | 189 (55.9%) | 85 (9.5%) |
| $500,000 to $749,999 | 0 (0.0%) | 0 (0.0%) |
| $750,000 to $999,999 | 0 (0.0%) | 0 (0.0%) |
| $1,000,000 or more | 0 (0.0%) | 0 (0.0%) |
| Total | 338 (100.0%) | 892 (100.0%) |
Household Income by Mortgage Status in Blackhawk
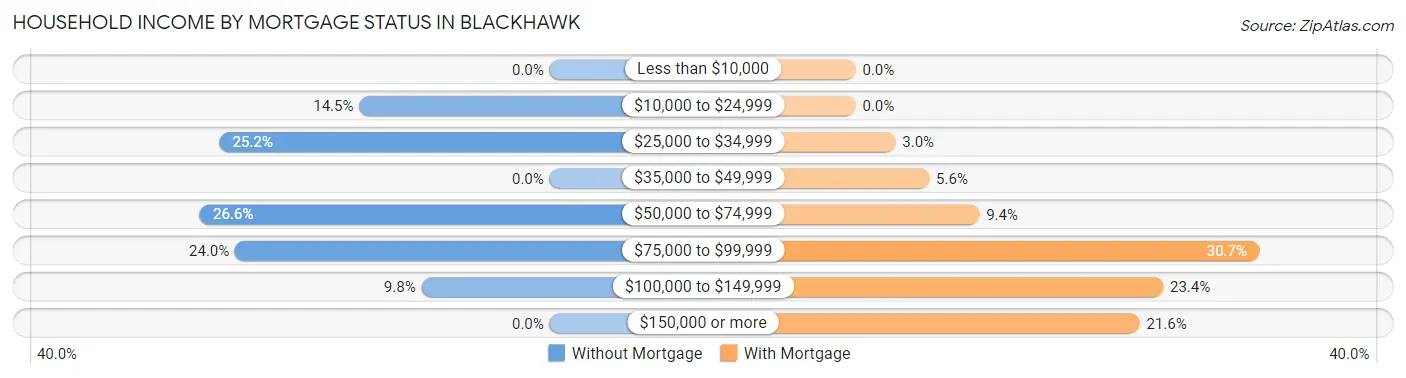
| Household Income | Without Mortgage | With Mortgage |
| Less than $10,000 | 0 (0.0%) | 0 (0.0%) |
| $10,000 to $24,999 | 49 (14.5%) | 0 (0.0%) |
| $25,000 to $34,999 | 85 (25.2%) | 27 (3.0%) |
| $35,000 to $49,999 | 0 (0.0%) | 50 (5.6%) |
| $50,000 to $74,999 | 90 (26.6%) | 84 (9.4%) |
| $75,000 to $99,999 | 81 (24.0%) | 274 (30.7%) |
| $100,000 to $149,999 | 33 (9.8%) | 209 (23.4%) |
| $150,000 or more | 0 (0.0%) | 193 (21.6%) |
| Total | 338 (100.0%) | 892 (100.0%) |
Property Value to Household Income Ratio in Blackhawk
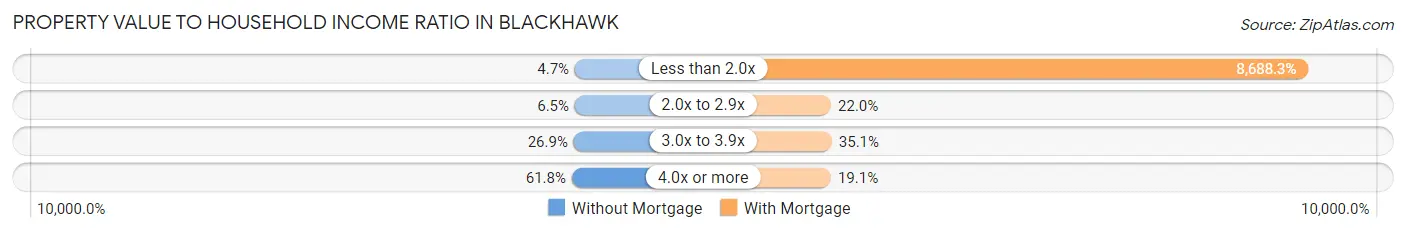
| Value-to-Income Ratio | Without Mortgage | With Mortgage |
| Less than 2.0x | 16 (4.7%) | 77,500 (8,688.3%) |
| 2.0x to 2.9x | 22 (6.5%) | 196 (22.0%) |
| 3.0x to 3.9x | 91 (26.9%) | 313 (35.1%) |
| 4.0x or more | 209 (61.8%) | 170 (19.1%) |
| Total | 338 (100.0%) | 892 (100.0%) |
Real Estate Taxes by Mortgage Status in Blackhawk
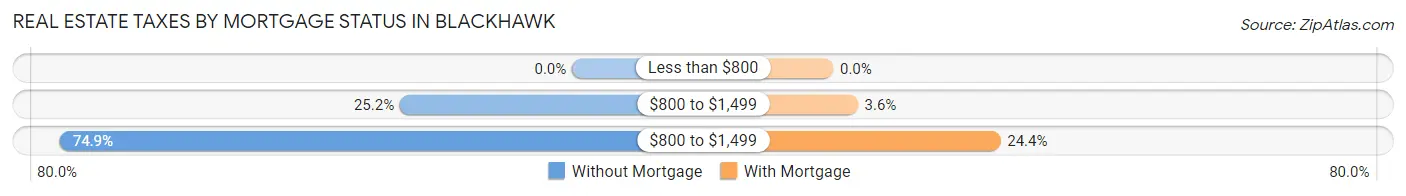
| Property Taxes | Without Mortgage | With Mortgage |
| Less than $800 | 0 (0.0%) | 0 (0.0%) |
| $800 to $1,499 | 85 (25.2%) | 32 (3.6%) |
| $800 to $1,499 | 253 (74.9%) | 218 (24.4%) |
| Total | 338 (100.0%) | 892 (100.0%) |
Health & Disability in Blackhawk
Health Insurance Coverage by Age in Blackhawk
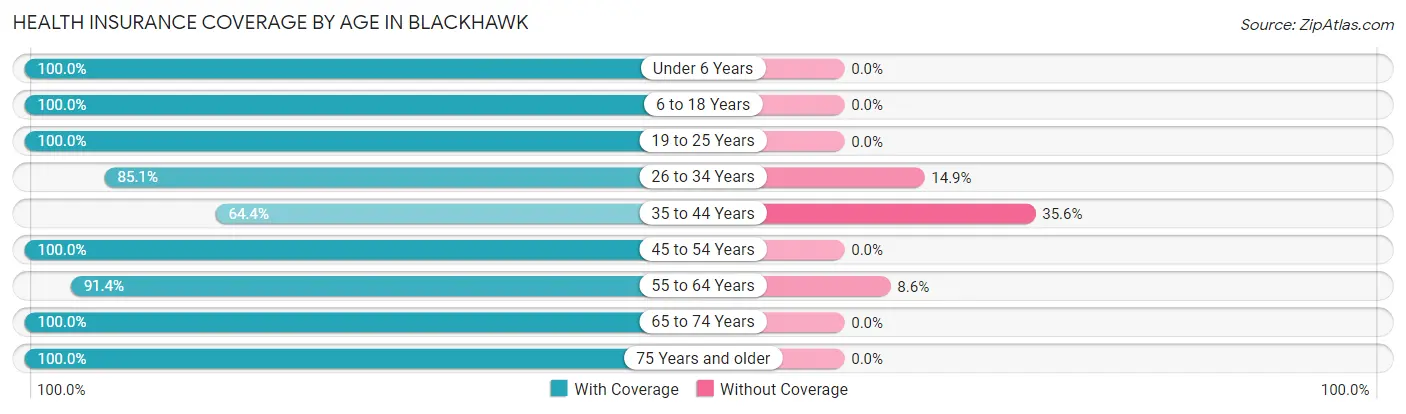
| Age Bracket | With Coverage | Without Coverage |
| Under 6 Years | 214 (100.0%) | 0 (0.0%) |
| 6 to 18 Years | 339 (100.0%) | 0 (0.0%) |
| 19 to 25 Years | 40 (100.0%) | 0 (0.0%) |
| 26 to 34 Years | 399 (85.1%) | 70 (14.9%) |
| 35 to 44 Years | 291 (64.4%) | 161 (35.6%) |
| 45 to 54 Years | 211 (100.0%) | 0 (0.0%) |
| 55 to 64 Years | 457 (91.4%) | 43 (8.6%) |
| 65 to 74 Years | 440 (100.0%) | 0 (0.0%) |
| 75 Years and older | 214 (100.0%) | 0 (0.0%) |
| Total | 2,605 (90.5%) | 274 (9.5%) |
Health Insurance Coverage by Citizenship Status in Blackhawk
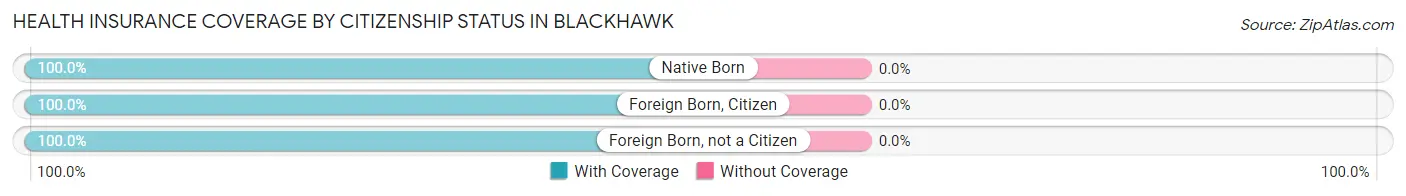
| Citizenship Status | With Coverage | Without Coverage |
| Native Born | 214 (100.0%) | 0 (0.0%) |
| Foreign Born, Citizen | 339 (100.0%) | 0 (0.0%) |
| Foreign Born, not a Citizen | 40 (100.0%) | 0 (0.0%) |
Health Insurance Coverage by Household Income in Blackhawk
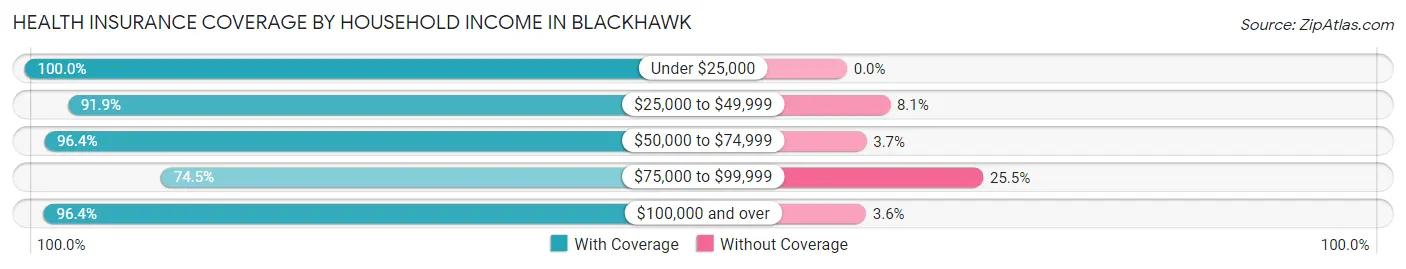
| Household Income | With Coverage | Without Coverage |
| Under $25,000 | 113 (100.0%) | 0 (0.0%) |
| $25,000 to $49,999 | 273 (91.9%) | 24 (8.1%) |
| $50,000 to $74,999 | 791 (96.4%) | 30 (3.6%) |
| $75,000 to $99,999 | 537 (74.5%) | 184 (25.5%) |
| $100,000 and over | 891 (96.4%) | 33 (3.6%) |
Public vs Private Health Insurance Coverage by Age in Blackhawk
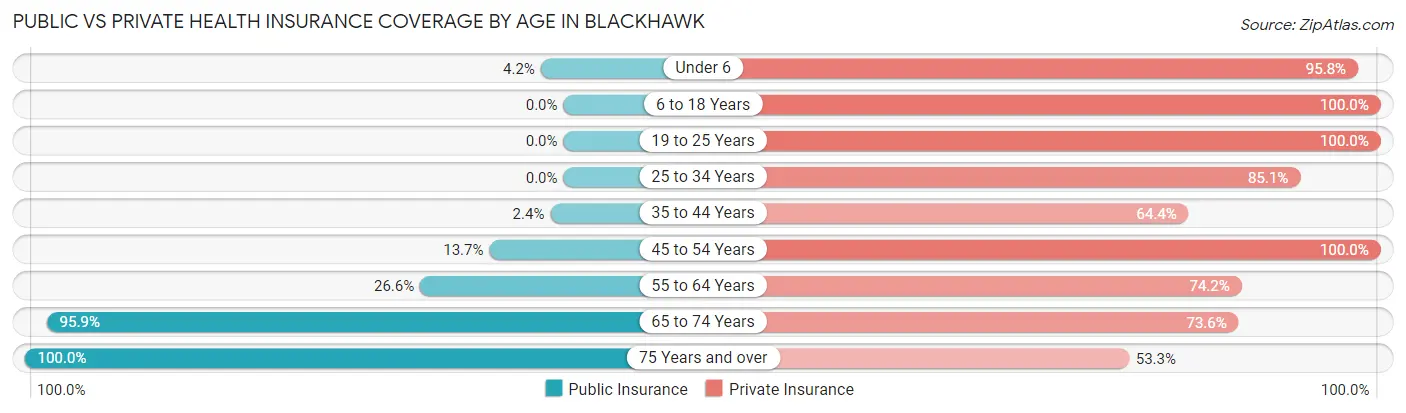
| Age Bracket | Public Insurance | Private Insurance |
| Under 6 | 9 (4.2%) | 205 (95.8%) |
| 6 to 18 Years | 0 (0.0%) | 339 (100.0%) |
| 19 to 25 Years | 0 (0.0%) | 40 (100.0%) |
| 25 to 34 Years | 0 (0.0%) | 399 (85.1%) |
| 35 to 44 Years | 11 (2.4%) | 291 (64.4%) |
| 45 to 54 Years | 29 (13.7%) | 211 (100.0%) |
| 55 to 64 Years | 133 (26.6%) | 371 (74.2%) |
| 65 to 74 Years | 422 (95.9%) | 324 (73.6%) |
| 75 Years and over | 214 (100.0%) | 114 (53.3%) |
| Total | 818 (28.4%) | 2,294 (79.7%) |
Disability Status by Sex by Age in Blackhawk
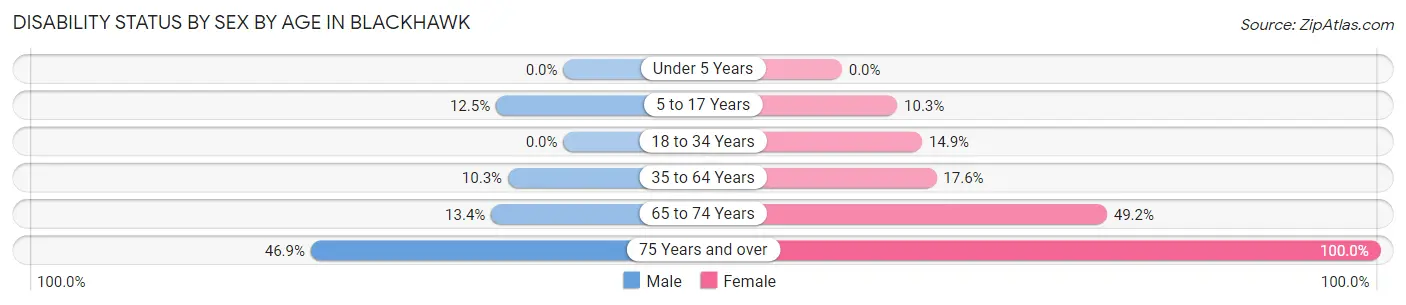
| Age Bracket | Male | Female |
| Under 5 Years | 0 (0.0%) | 0 (0.0%) |
| 5 to 17 Years | 19 (12.5%) | 23 (10.3%) |
| 18 to 34 Years | 0 (0.0%) | 43 (14.9%) |
| 35 to 64 Years | 64 (10.3%) | 95 (17.6%) |
| 65 to 74 Years | 26 (13.4%) | 121 (49.2%) |
| 75 Years and over | 60 (46.9%) | 86 (100.0%) |
Disability Class by Sex by Age in Blackhawk
Disability Class: Hearing Difficulty
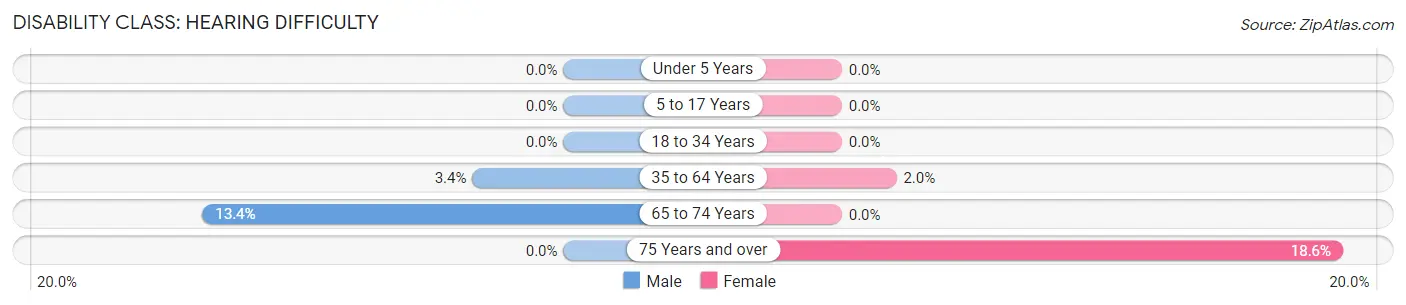
| Age Bracket | Male | Female |
| Under 5 Years | 0 (0.0%) | 0 (0.0%) |
| 5 to 17 Years | 0 (0.0%) | 0 (0.0%) |
| 18 to 34 Years | 0 (0.0%) | 0 (0.0%) |
| 35 to 64 Years | 21 (3.4%) | 11 (2.0%) |
| 65 to 74 Years | 26 (13.4%) | 0 (0.0%) |
| 75 Years and over | 0 (0.0%) | 16 (18.6%) |
Disability Class: Vision Difficulty
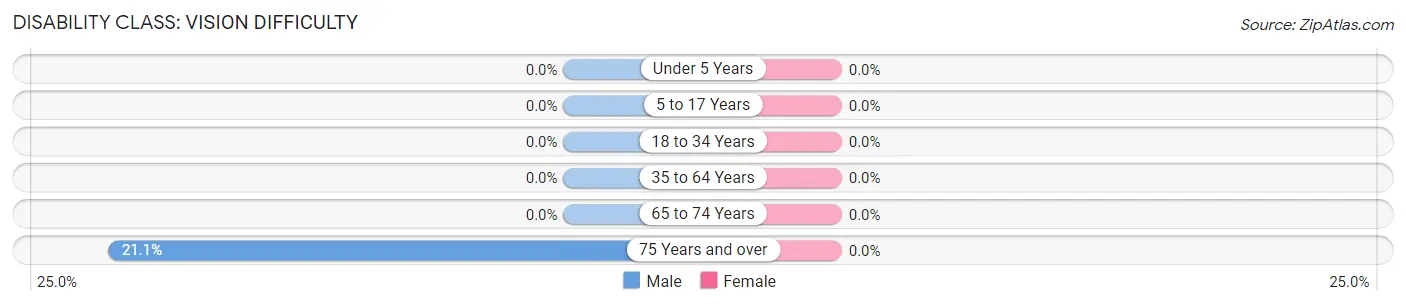
| Age Bracket | Male | Female |
| Under 5 Years | 0 (0.0%) | 0 (0.0%) |
| 5 to 17 Years | 0 (0.0%) | 0 (0.0%) |
| 18 to 34 Years | 0 (0.0%) | 0 (0.0%) |
| 35 to 64 Years | 0 (0.0%) | 0 (0.0%) |
| 65 to 74 Years | 0 (0.0%) | 0 (0.0%) |
| 75 Years and over | 27 (21.1%) | 0 (0.0%) |
Disability Class: Cognitive Difficulty
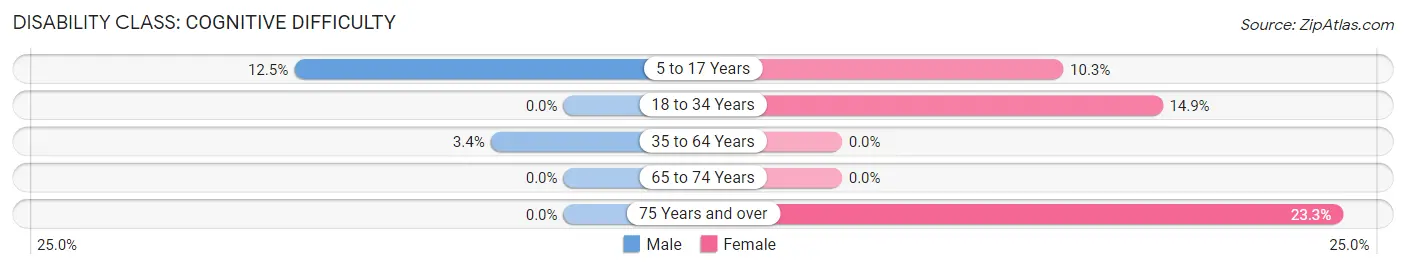
| Age Bracket | Male | Female |
| 5 to 17 Years | 19 (12.5%) | 23 (10.3%) |
| 18 to 34 Years | 0 (0.0%) | 43 (14.9%) |
| 35 to 64 Years | 21 (3.4%) | 0 (0.0%) |
| 65 to 74 Years | 0 (0.0%) | 0 (0.0%) |
| 75 Years and over | 0 (0.0%) | 20 (23.3%) |
Disability Class: Ambulatory Difficulty
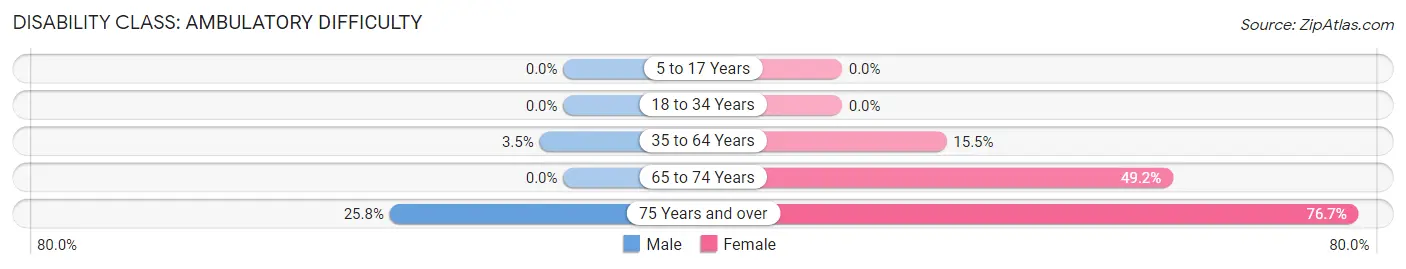
| Age Bracket | Male | Female |
| 5 to 17 Years | 0 (0.0%) | 0 (0.0%) |
| 18 to 34 Years | 0 (0.0%) | 0 (0.0%) |
| 35 to 64 Years | 22 (3.5%) | 84 (15.5%) |
| 65 to 74 Years | 0 (0.0%) | 121 (49.2%) |
| 75 Years and over | 33 (25.8%) | 66 (76.7%) |
Disability Class: Self-Care Difficulty
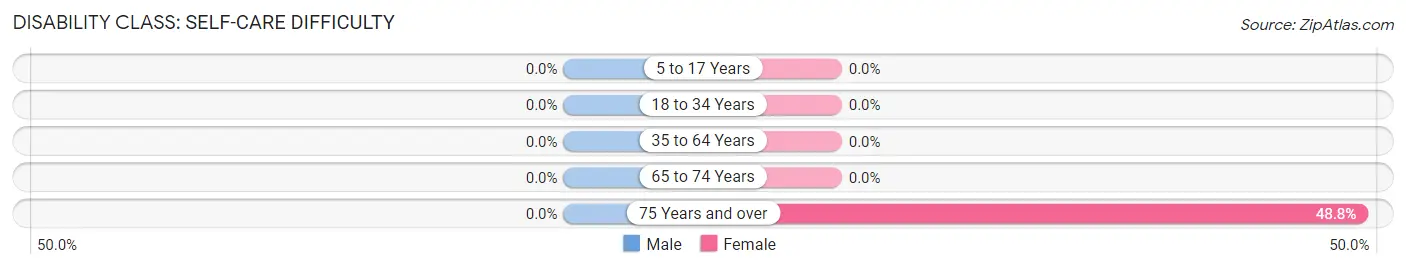
| Age Bracket | Male | Female |
| 5 to 17 Years | 0 (0.0%) | 0 (0.0%) |
| 18 to 34 Years | 0 (0.0%) | 0 (0.0%) |
| 35 to 64 Years | 0 (0.0%) | 0 (0.0%) |
| 65 to 74 Years | 0 (0.0%) | 0 (0.0%) |
| 75 Years and over | 0 (0.0%) | 42 (48.8%) |
Technology Access in Blackhawk
Computing Device Access in Blackhawk
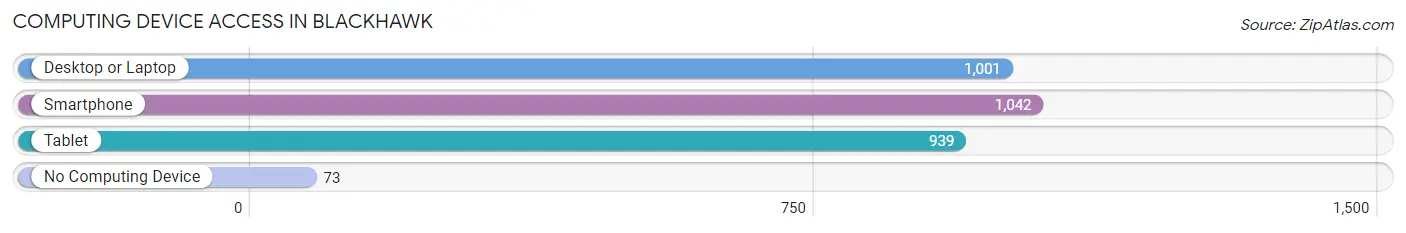
| Device Type | # Households | % Households |
| Desktop or Laptop | 1,001 | 78.6% |
| Smartphone | 1,042 | 81.9% |
| Tablet | 939 | 73.8% |
| No Computing Device | 73 | 5.7% |
| Total | 1,273 | 100.0% |
Internet Access in Blackhawk
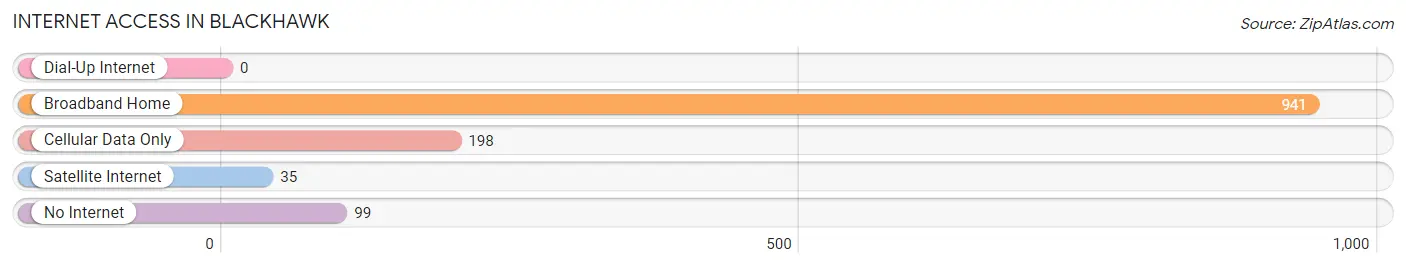
| Internet Type | # Households | % Households |
| Dial-Up Internet | 0 | 0.0% |
| Broadband Home | 941 | 73.9% |
| Cellular Data Only | 198 | 15.5% |
| Satellite Internet | 35 | 2.8% |
| No Internet | 99 | 7.8% |
| Total | 1,273 | 100.0% |
Blackhawk Summary
Blackhawk, South Dakota is a small town located in the Black Hills region of South Dakota. It is situated in the northern part of the state, about 20 miles south of Rapid City. The town was founded in 1876 and is named after the Blackhawk Indian tribe. The population of Blackhawk was 1,093 at the 2010 census.
History
The area that is now Blackhawk was originally inhabited by the Lakota Sioux. The first settlers arrived in the area in the late 1870s, and the town was officially founded in 1876. The town was named after the Blackhawk Indian tribe, which had a reservation in the area.
The town grew rapidly in the late 19th century, and by the early 20th century it had become a bustling mining town. The town was home to several gold and silver mines, as well as a number of other businesses. The town also had a railroad station, which connected it to other towns in the region.
In the early 20th century, the town began to decline as the mining industry declined. The town was hit hard by the Great Depression, and many of the businesses closed. The town was also affected by the Dust Bowl, and many of the residents moved away.
In the late 20th century, the town began to experience a resurgence. The town was revitalized by the opening of the Black Hills National Forest, which brought in tourists and new businesses. The town also experienced a population boom, as people moved to the area to take advantage of the outdoor recreation opportunities.
Geography
Blackhawk is located in the northern part of South Dakota, about 20 miles south of Rapid City. The town is situated in the Black Hills region of the state, and is surrounded by rolling hills and forests. The town is located at an elevation of 4,890 feet.
The town is located in the Black Hills National Forest, which is a popular destination for outdoor recreation. The forest is home to a variety of wildlife, including deer, elk, bighorn sheep, and mountain lions. The forest also contains a number of hiking trails, camping sites, and other recreational opportunities.
Economy
The economy of Blackhawk is largely based on tourism and outdoor recreation. The town is located in the Black Hills National Forest, which attracts visitors from all over the country. The town is also home to a number of businesses, including restaurants, hotels, and retail stores.
The town is also home to a number of mining operations, which are responsible for a significant portion of the town’s economy. The mines produce gold, silver, and other minerals, which are sold to local and international markets.
Demographics
As of the 2010 census, the population of Blackhawk was 1,093. The town has a median age of 44.7 years, and a median household income of $41,250. The town is predominantly white, with 91.3% of the population identifying as white. The town also has a small Hispanic population, with 4.2% of the population identifying as Hispanic or Latino.
Common Questions
What is the Total Population of Blackhawk?
Total Population of Blackhawk is 2,930.
What is the Total Male Population of Blackhawk?
Total Male Population of Blackhawk is 1,466.
What is the Total Female Population of Blackhawk?
Total Female Population of Blackhawk is 1,464.
What is the Ratio of Males per 100 Females in Blackhawk?
There are 100.14 Males per 100 Females in Blackhawk.
What is the Ratio of Females per 100 Males in Blackhawk?
There are 99.86 Females per 100 Males in Blackhawk.
What is the Median Population Age in Blackhawk?
Median Population Age in Blackhawk is 42.6 Years.
What is the Average Family Size in Blackhawk
Average Family Size in Blackhawk is 2.8 People.
What is the Average Household Size in Blackhawk
Average Household Size in Blackhawk is 2.3 People.
What is Per Capita Income in Blackhawk?
Per Capita income in Blackhawk is $33,623.
What is the Median Family Income in Blackhawk?
Median Family Income in Blackhawk is $76,764.
What is the Median Household income in Blackhawk?
Median Household Income in Blackhawk is $68,718.
What is Income or Wage Gap in Blackhawk?
Income or Wage Gap in Blackhawk is 37.8%.
Women in Blackhawk earn 62.2 cents for every dollar earned by a man.
What is Inequality or Gini Index in Blackhawk?
Inequality or Gini Index in Blackhawk is 0.27.
How Large is the Labor Force in Blackhawk?
There are 1,757 People in the Labor Forcein in Blackhawk.
What is the Percentage of People in the Labor Force in Blackhawk?
73.2% of People are in the Labor Force in Blackhawk.
What is the Unemployment Rate in Blackhawk?
Unemployment Rate in Blackhawk is 6.4%.