Anderson, SD
Anderson Map
Anderson Overview
418
TOTAL POPULATION
197
MALE POPULATION
221
FEMALE POPULATION
89.14
MALES / 100 FEMALES
112.18
FEMALES / 100 MALES
51.9
MEDIAN AGE
3.2
AVG FAMILY SIZE
3.0
AVG HOUSEHOLD SIZE
$59,134
PER CAPITA INCOME
$153,125
AVG FAMILY INCOME
$137,109
AVG HOUSEHOLD INCOME
0.34
INEQUALITY / GINI INDEX
260
LABOR FORCE [ PEOPLE ]
73.7%
PERCENT IN LABOR FORCE
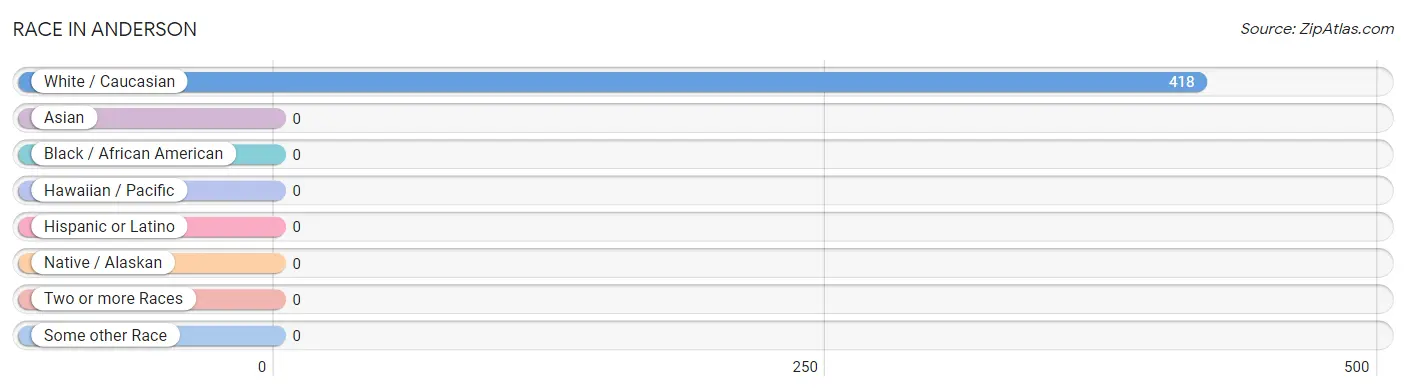
Race in Anderson
The most populous races in Anderson are , and White / Caucasian (418 | 100.0%).
| Race | # Population | % Population |
| Asian | 0 | 0.0% |
| Black / African American | 0 | 0.0% |
| Hawaiian / Pacific | 0 | 0.0% |
| Hispanic or Latino | 0 | 0.0% |
| Native / Alaskan | 0 | 0.0% |
| White / Caucasian | 418 | 100.0% |
| Two or more Races | 0 | 0.0% |
| Some other Race | 0 | 0.0% |
| Total | 418 | 100.0% |
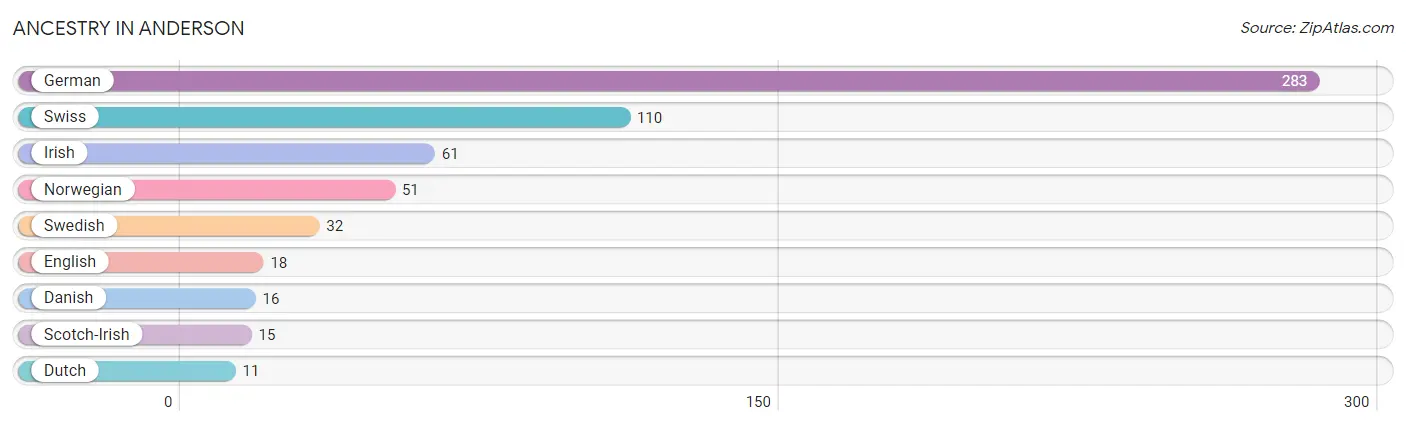
Ancestry in Anderson
The most populous ancestries reported in Anderson are German (283 | 67.7%), Swiss (110 | 26.3%), Irish (61 | 14.6%), Norwegian (51 | 12.2%), and Swedish (32 | 7.7%), together accounting for 128.5% of all Anderson residents.
| Ancestry | # Population | % Population |
| Danish | 16 | 3.8% |
| Dutch | 11 | 2.6% |
| English | 18 | 4.3% |
| German | 283 | 67.7% |
| Irish | 61 | 14.6% |
| Norwegian | 51 | 12.2% |
| Scotch-Irish | 15 | 3.6% |
| Swedish | 32 | 7.7% |
| Swiss | 110 | 26.3% | View All 9 Rows |
Immigrants in Anderson

| Immigration Origin | # Population | % Population | View All 0 Rows |
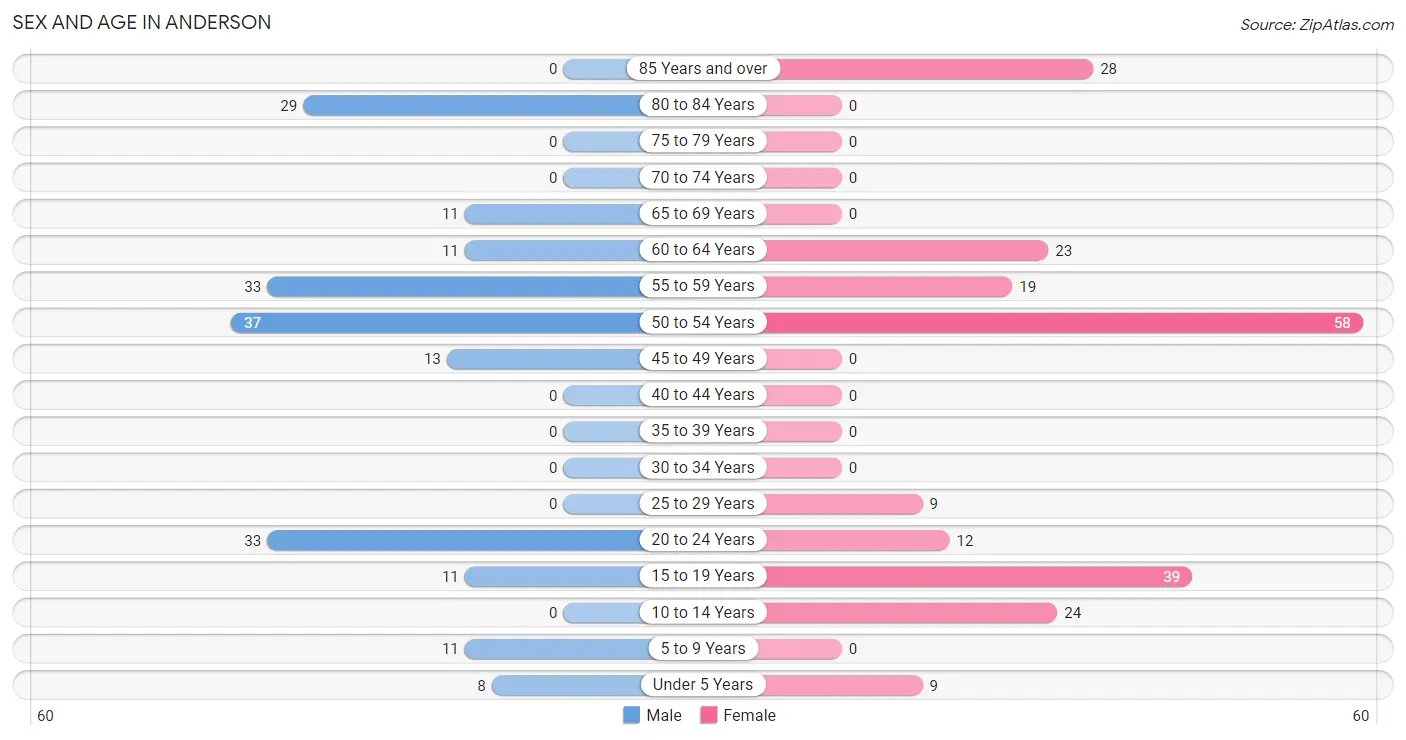
Sex and Age in Anderson
Sex and Age in Anderson
The most populous age groups in Anderson are 50 to 54 Years (37 | 18.8%) for men and 50 to 54 Years (58 | 26.2%) for women.
| Age Bracket | Male | Female |
| Under 5 Years | 8 (4.1%) | 9 (4.1%) |
| 5 to 9 Years | 11 (5.6%) | 0 (0.0%) |
| 10 to 14 Years | 0 (0.0%) | 24 (10.9%) |
| 15 to 19 Years | 11 (5.6%) | 39 (17.6%) |
| 20 to 24 Years | 33 (16.8%) | 12 (5.4%) |
| 25 to 29 Years | 0 (0.0%) | 9 (4.1%) |
| 30 to 34 Years | 0 (0.0%) | 0 (0.0%) |
| 35 to 39 Years | 0 (0.0%) | 0 (0.0%) |
| 40 to 44 Years | 0 (0.0%) | 0 (0.0%) |
| 45 to 49 Years | 13 (6.6%) | 0 (0.0%) |
| 50 to 54 Years | 37 (18.8%) | 58 (26.2%) |
| 55 to 59 Years | 33 (16.8%) | 19 (8.6%) |
| 60 to 64 Years | 11 (5.6%) | 23 (10.4%) |
| 65 to 69 Years | 11 (5.6%) | 0 (0.0%) |
| 70 to 74 Years | 0 (0.0%) | 0 (0.0%) |
| 75 to 79 Years | 0 (0.0%) | 0 (0.0%) |
| 80 to 84 Years | 29 (14.7%) | 0 (0.0%) |
| 85 Years and over | 0 (0.0%) | 28 (12.7%) |
| Total | 197 (100.0%) | 221 (100.0%) |
Families and Households in Anderson
Median Family Size in Anderson
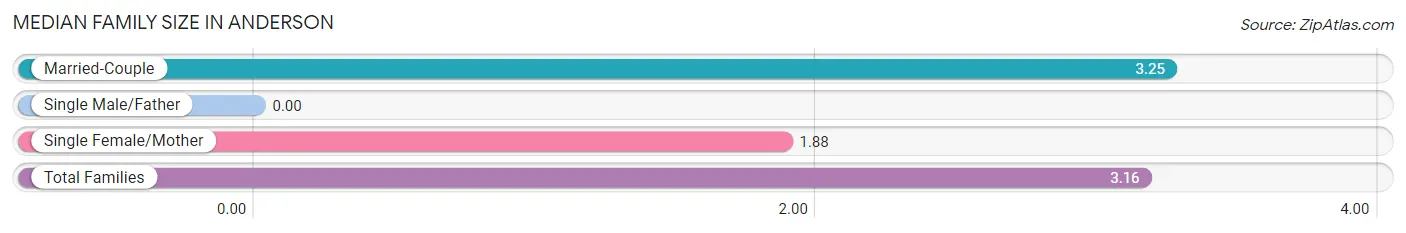
| Family Type | # Families | Family Size |
| Married-Couple | 122 (93.9%) | 3.25 |
| Single Male/Father | 0 (0.0%) | - |
| Single Female/Mother | 8 (6.1%) | 1.88 |
| Total Families | 130 (100.0%) | 3.16 |
Median Household Size in Anderson
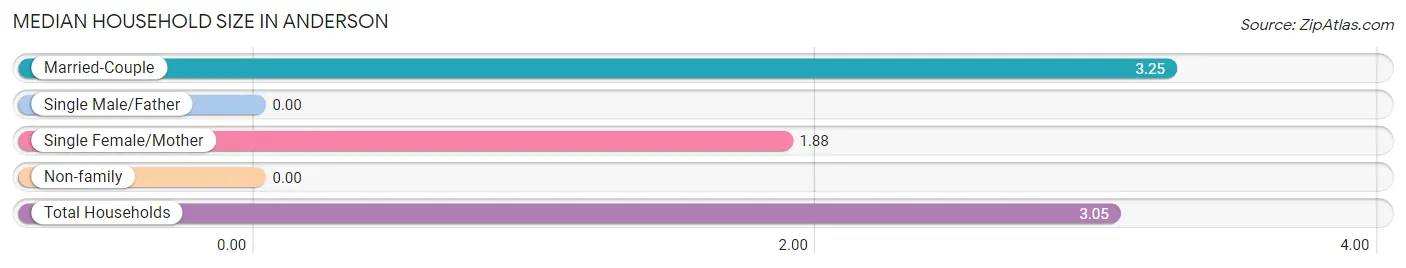
| Household Type | # Households | Household Size |
| Married-Couple | 122 (89.0%) | 3.25 |
| Single Male/Father | 0 (0.0%) | - |
| Single Female/Mother | 8 (5.8%) | 1.88 |
| Non-family | 7 (5.1%) | - |
| Total Households | 137 (100.0%) | 3.05 |
Household Size by Marriage Status in Anderson
Out of a total of 137 households in Anderson, 130 (94.9%) are family households, while 7 (5.1%) are nonfamily households. The most numerous type of family households are 2-person households, comprising 93, and the most common type of nonfamily households are 1-person households, comprising 7.
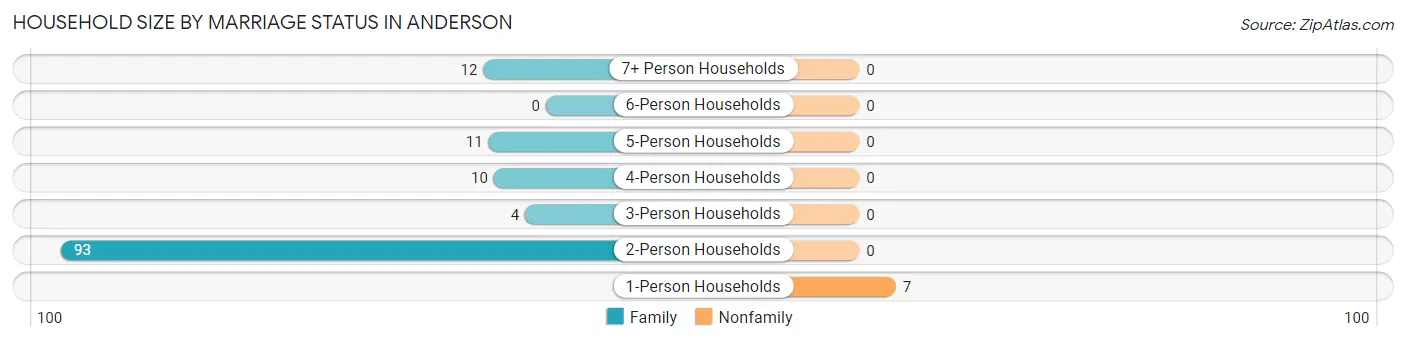
| Household Size | Family Households | Nonfamily Households |
| 1-Person Households | - | 7 (5.1%) |
| 2-Person Households | 93 (67.9%) | 0 (0.0%) |
| 3-Person Households | 4 (2.9%) | 0 (0.0%) |
| 4-Person Households | 10 (7.3%) | 0 (0.0%) |
| 5-Person Households | 11 (8.0%) | 0 (0.0%) |
| 6-Person Households | 0 (0.0%) | 0 (0.0%) |
| 7+ Person Households | 12 (8.8%) | 0 (0.0%) |
| Total | 130 (94.9%) | 7 (5.1%) |
Female Fertility in Anderson
Fertility by Age in Anderson
| Age Bracket | Women with Births | Births / 1,000 Women |
| 15 to 19 years | 0 (0.0%) | 0.0 |
| 20 to 34 years | 0 (0.0%) | 0.0 |
| 35 to 50 years | 0 (0.0%) | 0.0 |
| Total | 0 (0.0%) | 0.0 |
Fertility by Age by Marriage Status in Anderson
| Age Bracket | Married | Unmarried |
| 15 to 19 years | 0 (0.0%) | 0 (0.0%) |
| 20 to 34 years | 0 (0.0%) | 0 (0.0%) |
| 35 to 50 years | 0 (0.0%) | 0 (0.0%) |
| Total | 0 (0.0%) | 0 (0.0%) |
Fertility by Education in Anderson
| Educational Attainment | Women with Births | Births / 1,000 Women |
| Less than High School | 0 (0.0%) | 0.0 |
| High School Diploma | 0 (0.0%) | 0.0 |
| College or Associate's Degree | 0 (0.0%) | 0.0 |
| Bachelor's Degree | 0 (0.0%) | 0.0 |
| Graduate Degree | 0 (0.0%) | 0.0 |
| Total | 0 (0.0%) | 0.0 |
Fertility by Education by Marriage Status in Anderson
| Educational Attainment | Married | Unmarried |
| Less than High School | 0 (0.0%) | 0 (0.0%) |
| High School Diploma | 0 (0.0%) | 0 (0.0%) |
| College or Associate's Degree | 0 (0.0%) | 0 (0.0%) |
| Bachelor's Degree | 0 (0.0%) | 0 (0.0%) |
| Graduate Degree | 0 (0.0%) | 0 (0.0%) |
| Total | 0 (0.0%) | 0 (0.0%) |
Income in Anderson
Income Overview in Anderson
Per Capita Income in Anderson is $59,134, while median incomes of families and households are $153,125 and $137,109 respectively.
| Characteristic | Number | Measure |
| Per Capita Income | 418 | $59,134 |
| Median Family Income | 130 | $153,125 |
| Mean Family Income | 130 | $192,251 |
| Median Household Income | 137 | $137,109 |
| Mean Household Income | 137 | $185,731 |
| Income Deficit | 130 | $0 |
| Wage / Income Gap (%) | 418 | 0.00% |
| Wage / Income Gap ($) | 418 | 100.00¢ per $1 |
| Gini / Inequality Index | 418 | 0.34 |
Earnings by Sex in Anderson
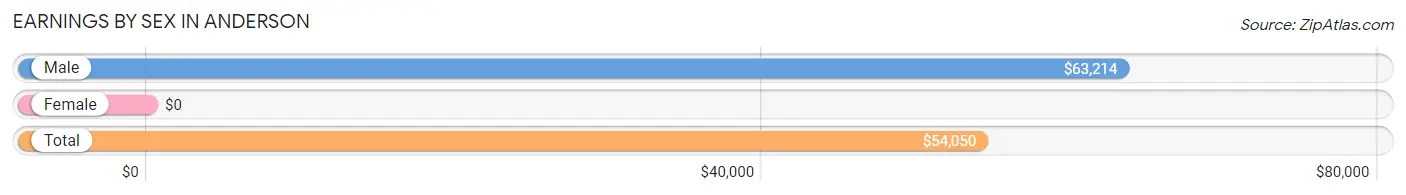
| Sex | Number | Average Earnings |
| Male | 142 (53.2%) | $63,214 |
| Female | 125 (46.8%) | $0 |
| Total | 267 (100.0%) | $54,050 |
Earnings by Sex by Income Bracket in Anderson
The most common earnings brackets in Anderson are $65,000 to $74,999 for men (25 | 17.6%) and $50,000 to $54,999 for women (25 | 20.0%).
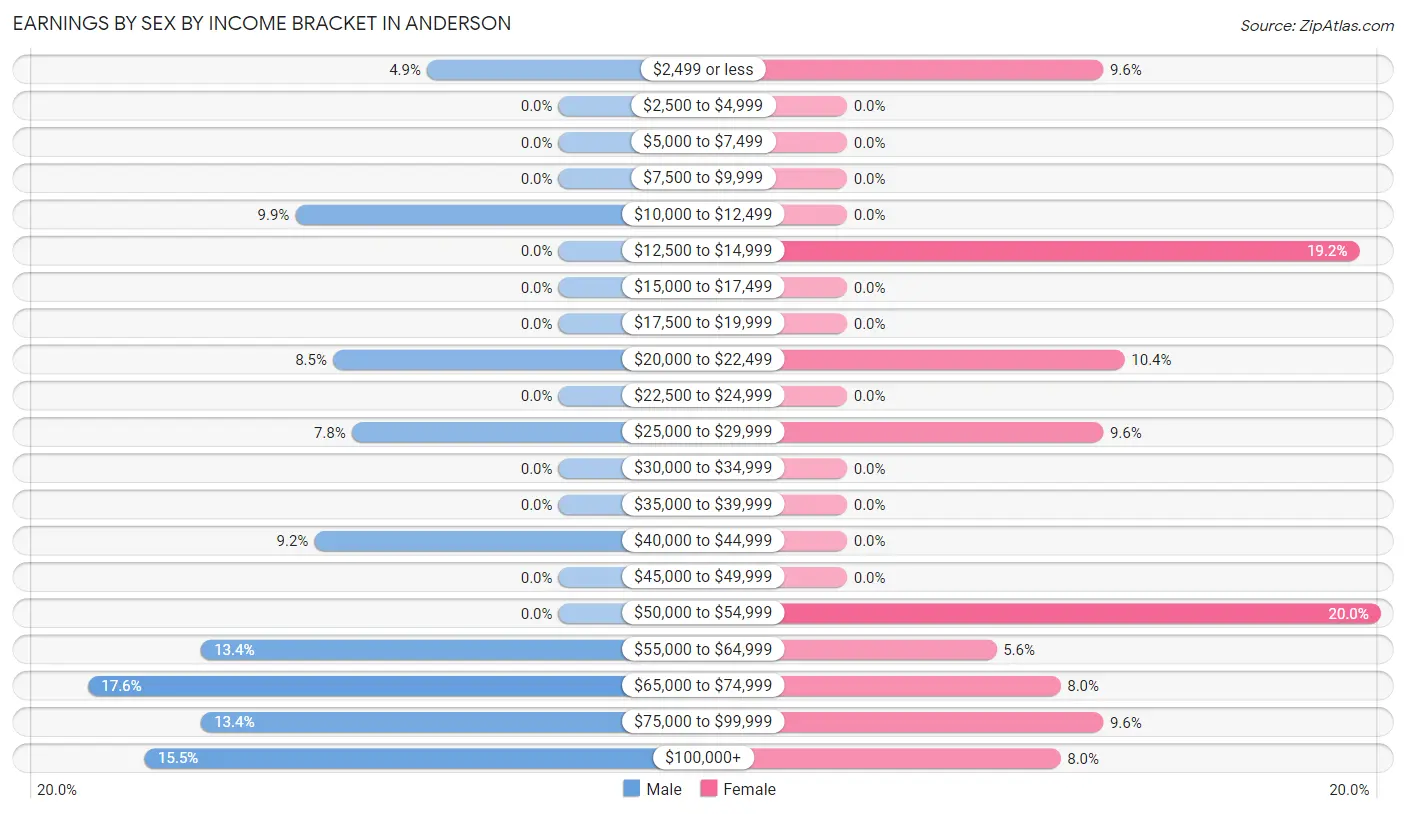
| Income | Male | Female |
| $2,499 or less | 7 (4.9%) | 12 (9.6%) |
| $2,500 to $4,999 | 0 (0.0%) | 0 (0.0%) |
| $5,000 to $7,499 | 0 (0.0%) | 0 (0.0%) |
| $7,500 to $9,999 | 0 (0.0%) | 0 (0.0%) |
| $10,000 to $12,499 | 14 (9.9%) | 0 (0.0%) |
| $12,500 to $14,999 | 0 (0.0%) | 24 (19.2%) |
| $15,000 to $17,499 | 0 (0.0%) | 0 (0.0%) |
| $17,500 to $19,999 | 0 (0.0%) | 0 (0.0%) |
| $20,000 to $22,499 | 12 (8.5%) | 13 (10.4%) |
| $22,500 to $24,999 | 0 (0.0%) | 0 (0.0%) |
| $25,000 to $29,999 | 11 (7.7%) | 12 (9.6%) |
| $30,000 to $34,999 | 0 (0.0%) | 0 (0.0%) |
| $35,000 to $39,999 | 0 (0.0%) | 0 (0.0%) |
| $40,000 to $44,999 | 13 (9.1%) | 0 (0.0%) |
| $45,000 to $49,999 | 0 (0.0%) | 0 (0.0%) |
| $50,000 to $54,999 | 0 (0.0%) | 25 (20.0%) |
| $55,000 to $64,999 | 19 (13.4%) | 7 (5.6%) |
| $65,000 to $74,999 | 25 (17.6%) | 10 (8.0%) |
| $75,000 to $99,999 | 19 (13.4%) | 12 (9.6%) |
| $100,000+ | 22 (15.5%) | 10 (8.0%) |
| Total | 142 (100.0%) | 125 (100.0%) |
Earnings by Sex by Educational Attainment in Anderson
Average earnings in Anderson are $69,048 for men and $54,550 for women, a difference of 21.0%. Men with an educational attainment of high school diploma enjoy the highest average annual earnings of $80,066, while those with high school diploma education earn the least with $80,066. Women with an educational attainment of college or associate's degree earn the most with the average annual earnings of $54,531, while those with college or associate's degree education have the smallest earnings of $54,531.
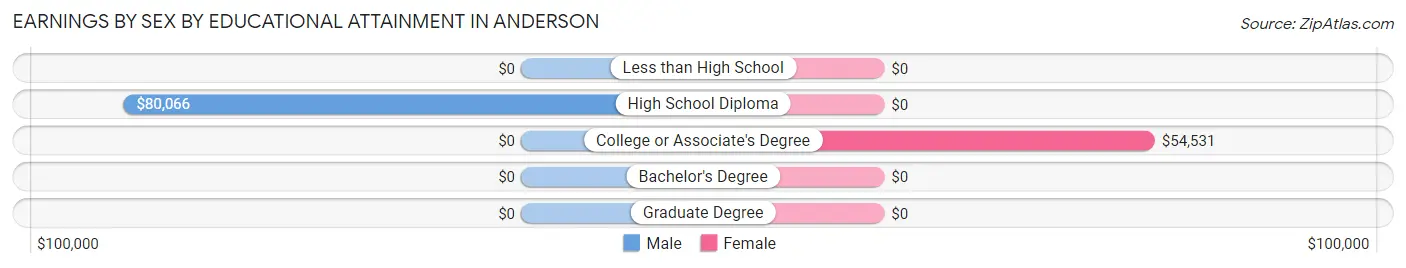
| Educational Attainment | Male Income | Female Income |
| Less than High School | - | - |
| High School Diploma | $80,066 | $0 |
| College or Associate's Degree | - | - |
| Bachelor's Degree | - | - |
| Graduate Degree | - | - |
| Total | $69,048 | $54,550 |
Family Income in Anderson
Family Income Brackets in Anderson
According to the Anderson family income data, there are 45 families falling into the $100,000 to $149,999 income range, which is the most common income bracket and makes up 34.6% of all families.
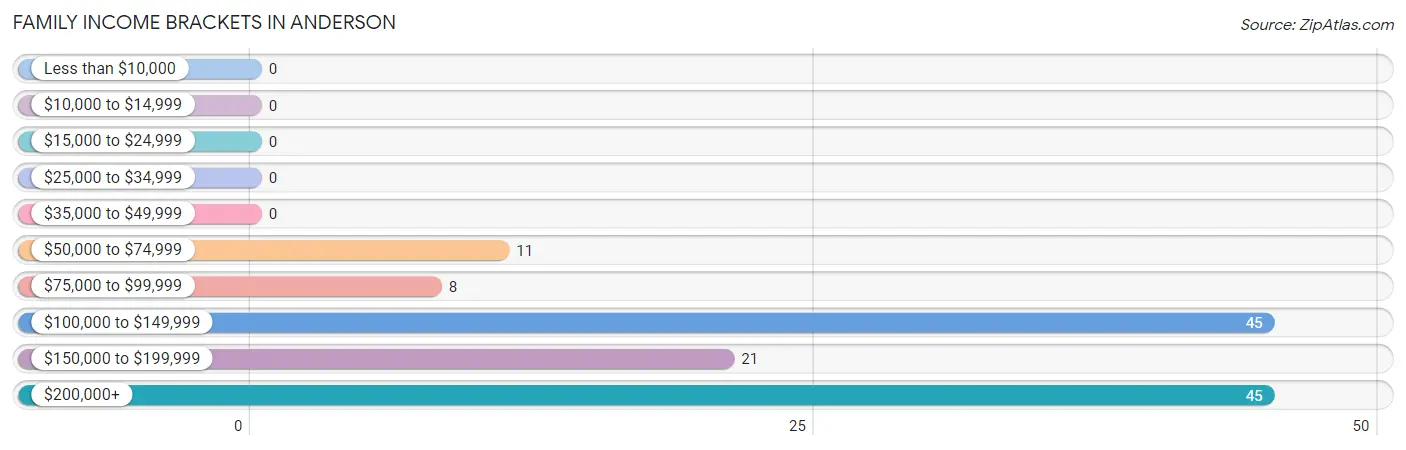
| Income Bracket | # Families | % Families |
| Less than $10,000 | 0 | 0.0% |
| $10,000 to $14,999 | 0 | 0.0% |
| $15,000 to $24,999 | 0 | 0.0% |
| $25,000 to $34,999 | 0 | 0.0% |
| $35,000 to $49,999 | 0 | 0.0% |
| $50,000 to $74,999 | 11 | 8.5% |
| $75,000 to $99,999 | 8 | 6.2% |
| $100,000 to $149,999 | 45 | 34.6% |
| $150,000 to $199,999 | 21 | 16.2% |
| $200,000+ | 45 | 34.6% |
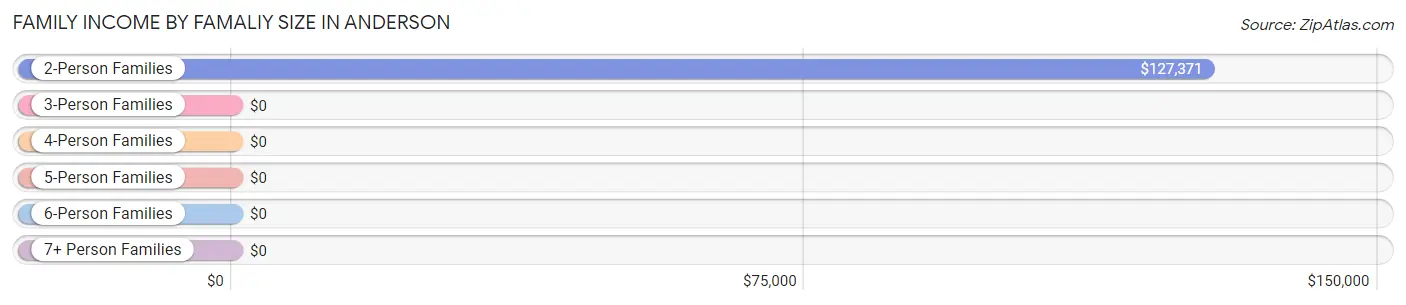
Family Income by Famaliy Size in Anderson
2-person families (93 | 71.5%) account for the highest median family income in Anderson with $127,371 per family, while 2-person families (93 | 71.5%) have the highest median income of $63,686 per family member.
| Income Bracket | # Families | Median Income |
| 2-Person Families | 93 (71.5%) | $127,371 |
| 3-Person Families | 4 (3.1%) | $0 |
| 4-Person Families | 10 (7.7%) | $0 |
| 5-Person Families | 11 (8.5%) | $0 |
| 6-Person Families | 0 (0.0%) | $0 |
| 7+ Person Families | 12 (9.2%) | $0 |
| Total | 130 (100.0%) | $153,125 |
Family Income by Number of Earners in Anderson
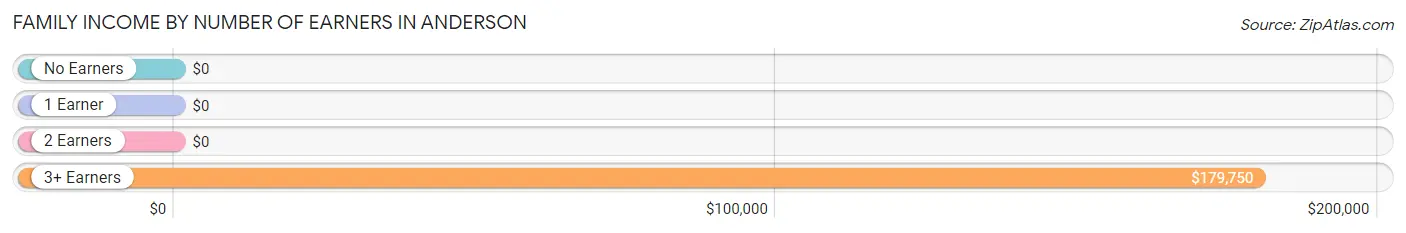
| Number of Earners | # Families | Median Income |
| No Earners | 36 (27.7%) | $0 |
| 1 Earner | 5 (3.8%) | $0 |
| 2 Earners | 63 (48.5%) | $0 |
| 3+ Earners | 26 (20.0%) | $179,750 |
| Total | 130 (100.0%) | $153,125 |
Household Income in Anderson
Household Income Brackets in Anderson
With 45 households falling in the category, the $100,000 to $149,999 income range is the most frequent in Anderson, accounting for 32.9% of all households.
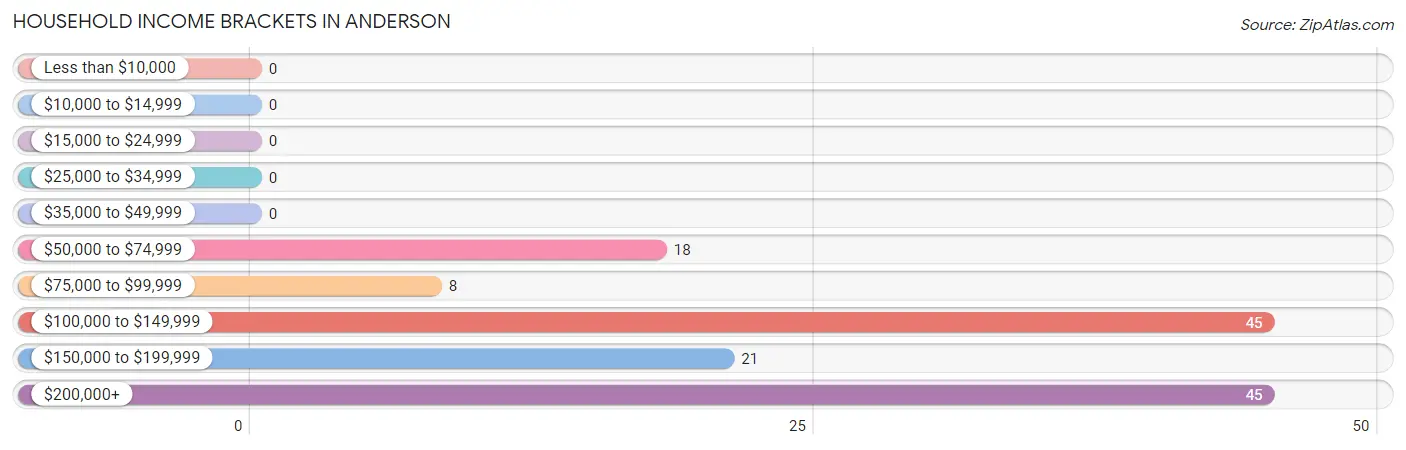
| Income Bracket | # Households | % Households |
| Less than $10,000 | 0 | 0.0% |
| $10,000 to $14,999 | 0 | 0.0% |
| $15,000 to $24,999 | 0 | 0.0% |
| $25,000 to $34,999 | 0 | 0.0% |
| $35,000 to $49,999 | 0 | 0.0% |
| $50,000 to $74,999 | 18 | 13.1% |
| $75,000 to $99,999 | 8 | 5.8% |
| $100,000 to $149,999 | 45 | 32.8% |
| $150,000 to $199,999 | 21 | 15.3% |
| $200,000+ | 45 | 32.8% |
Household Income by Householder Age in Anderson
The median household income in Anderson is $137,109, with the highest median household income of $178,625 found in the 45 to 64 years age bracket for the primary householder. A total of 101 households (73.7%) fall into this category.
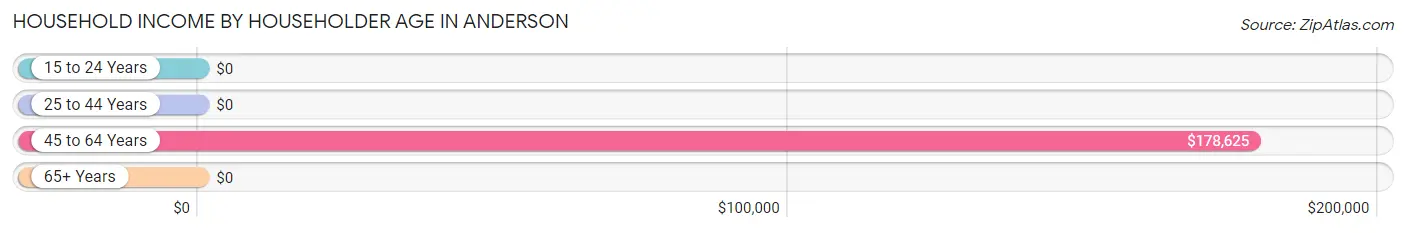
| Income Bracket | # Households | Median Income |
| 15 to 24 Years | 0 (0.0%) | $0 |
| 25 to 44 Years | 0 (0.0%) | $0 |
| 45 to 64 Years | 101 (73.7%) | $178,625 |
| 65+ Years | 36 (26.3%) | $0 |
| Total | 137 (100.0%) | $137,109 |
Poverty in Anderson
Income Below Poverty by Sex and Age in Anderson
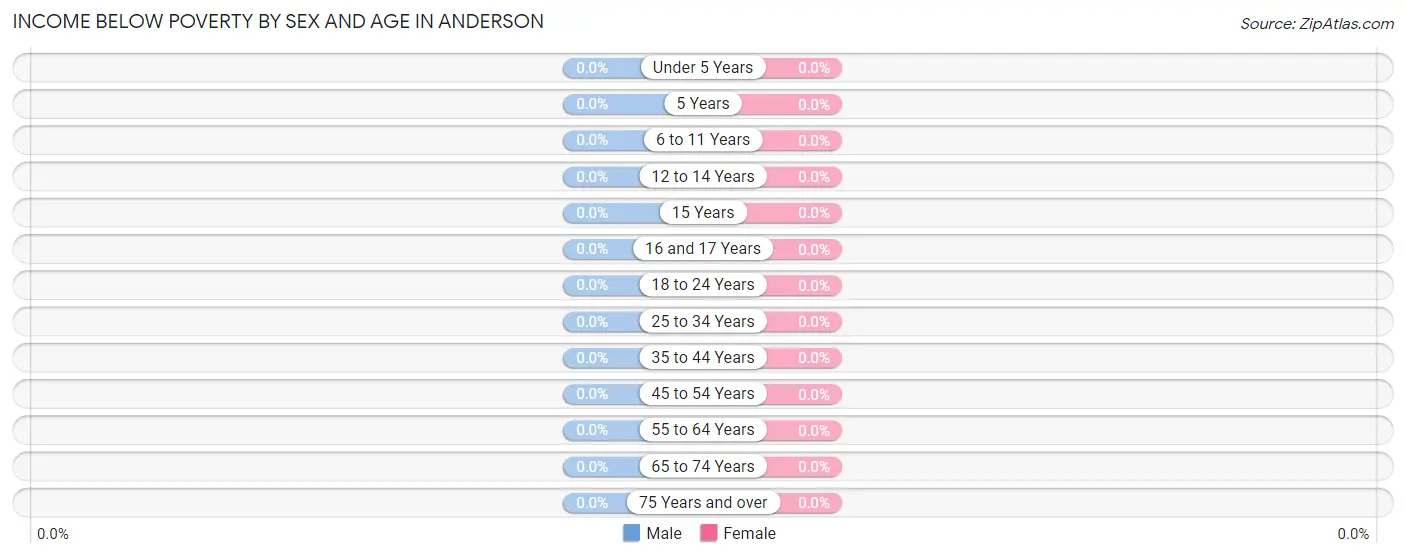
| Age Bracket | Male | Female |
| Under 5 Years | 0 (0.0%) | 0 (0.0%) |
| 5 Years | 0 (0.0%) | 0 (0.0%) |
| 6 to 11 Years | 0 (0.0%) | 0 (0.0%) |
| 12 to 14 Years | 0 (0.0%) | 0 (0.0%) |
| 15 Years | 0 (0.0%) | 0 (0.0%) |
| 16 and 17 Years | 0 (0.0%) | 0 (0.0%) |
| 18 to 24 Years | 0 (0.0%) | 0 (0.0%) |
| 25 to 34 Years | 0 (0.0%) | 0 (0.0%) |
| 35 to 44 Years | 0 (0.0%) | 0 (0.0%) |
| 45 to 54 Years | 0 (0.0%) | 0 (0.0%) |
| 55 to 64 Years | 0 (0.0%) | 0 (0.0%) |
| 65 to 74 Years | 0 (0.0%) | 0 (0.0%) |
| 75 Years and over | 0 (0.0%) | 0 (0.0%) |
| Total | 0 (0.0%) | 0 (0.0%) |
Income Above Poverty by Sex and Age in Anderson
According to the poverty statistics in Anderson, males aged under 5 years and females aged under 5 years are the age groups that are most secure financially, with 100.0% of males and 100.0% of females in these age groups living above the poverty line.
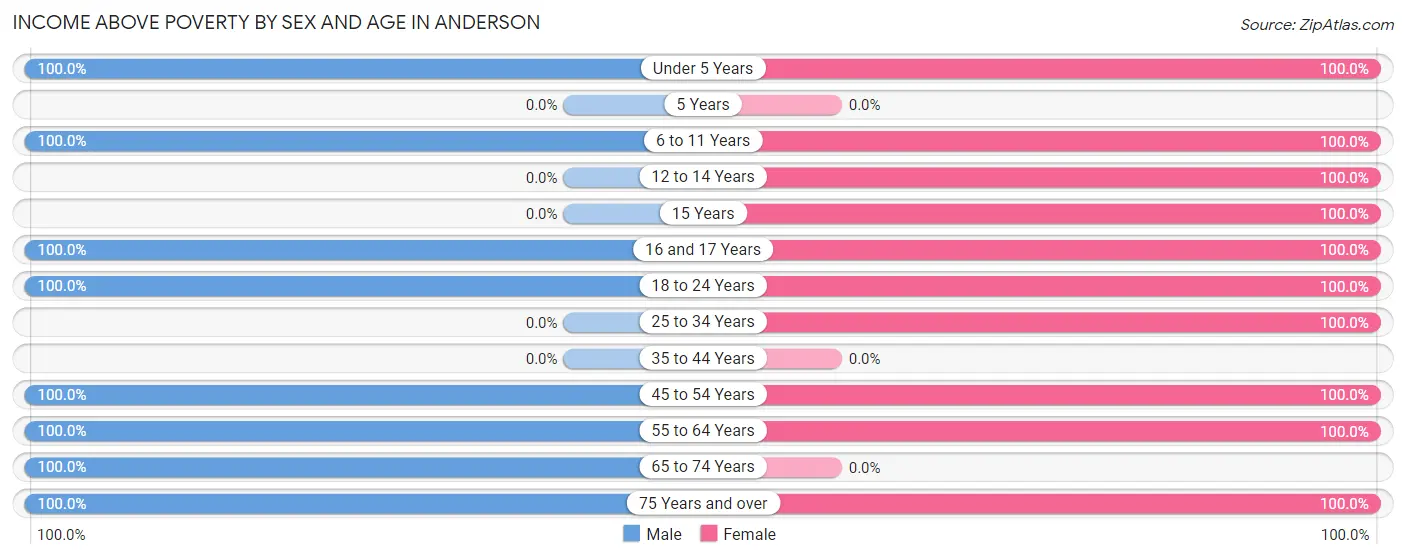
| Age Bracket | Male | Female |
| Under 5 Years | 8 (100.0%) | 9 (100.0%) |
| 5 Years | 0 (0.0%) | 0 (0.0%) |
| 6 to 11 Years | 11 (100.0%) | 12 (100.0%) |
| 12 to 14 Years | 0 (0.0%) | 12 (100.0%) |
| 15 Years | 0 (0.0%) | 13 (100.0%) |
| 16 and 17 Years | 4 (100.0%) | 13 (100.0%) |
| 18 to 24 Years | 40 (100.0%) | 25 (100.0%) |
| 25 to 34 Years | 0 (0.0%) | 9 (100.0%) |
| 35 to 44 Years | 0 (0.0%) | 0 (0.0%) |
| 45 to 54 Years | 50 (100.0%) | 58 (100.0%) |
| 55 to 64 Years | 44 (100.0%) | 42 (100.0%) |
| 65 to 74 Years | 11 (100.0%) | 0 (0.0%) |
| 75 Years and over | 29 (100.0%) | 28 (100.0%) |
| Total | 197 (100.0%) | 221 (100.0%) |
Income Below Poverty Among Married-Couple Families in Anderson
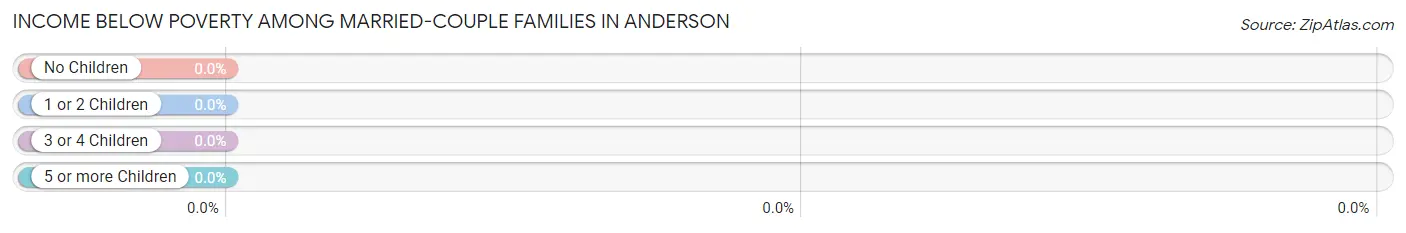
| Children | Above Poverty | Below Poverty |
| No Children | 95 (100.0%) | 0 (0.0%) |
| 1 or 2 Children | 15 (100.0%) | 0 (0.0%) |
| 3 or 4 Children | 0 (0.0%) | 0 (0.0%) |
| 5 or more Children | 12 (100.0%) | 0 (0.0%) |
| Total | 122 (100.0%) | 0 (0.0%) |
Income Below Poverty Among Single-Parent Households in Anderson
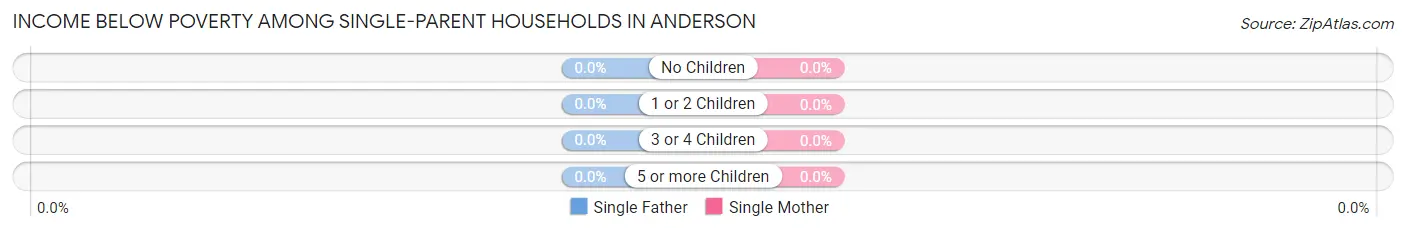
| Children | Single Father | Single Mother |
| No Children | 0 (0.0%) | 0 (0.0%) |
| 1 or 2 Children | 0 (0.0%) | 0 (0.0%) |
| 3 or 4 Children | 0 (0.0%) | 0 (0.0%) |
| 5 or more Children | 0 (0.0%) | 0 (0.0%) |
| Total | 0 (0.0%) | 0 (0.0%) |
Income Below Poverty Among Married-Couple vs Single-Parent Households in Anderson
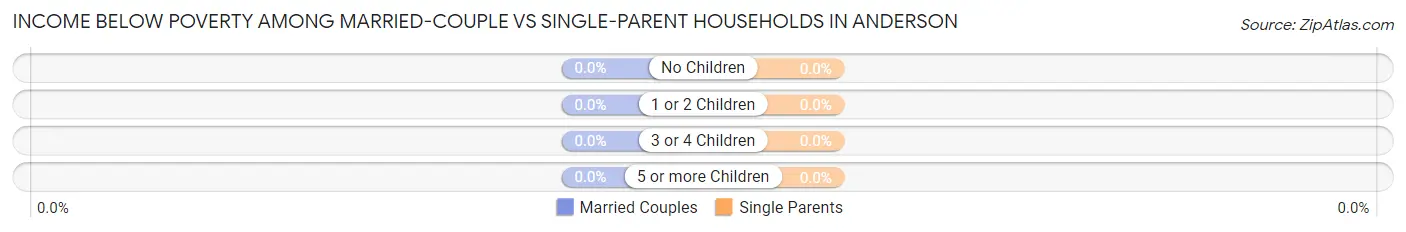
| Children | Married-Couple Families | Single-Parent Households |
| No Children | 0 (0.0%) | 0 (0.0%) |
| 1 or 2 Children | 0 (0.0%) | 0 (0.0%) |
| 3 or 4 Children | 0 (0.0%) | 0 (0.0%) |
| 5 or more Children | 0 (0.0%) | 0 (0.0%) |
| Total | 0 (0.0%) | 0 (0.0%) |
Employment Characteristics in Anderson
Employment by Class of Employer in Anderson
Among the 250 employed individuals in Anderson, private company employees (137 | 54.8%), self-employed (incorporated) (47 | 18.8%), and not-for-profit organizations (44 | 17.6%) make up the most common classes of employment.
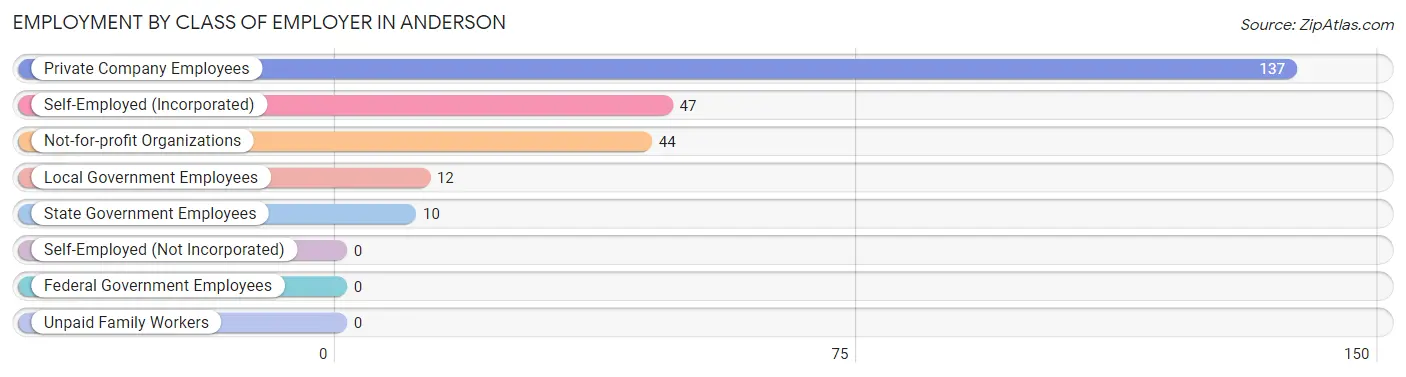
| Employer Class | # Employees | % Employees |
| Private Company Employees | 137 | 54.8% |
| Self-Employed (Incorporated) | 47 | 18.8% |
| Self-Employed (Not Incorporated) | 0 | 0.0% |
| Not-for-profit Organizations | 44 | 17.6% |
| Local Government Employees | 12 | 4.8% |
| State Government Employees | 10 | 4.0% |
| Federal Government Employees | 0 | 0.0% |
| Unpaid Family Workers | 0 | 0.0% |
| Total | 250 | 100.0% |
Employment Status by Age in Anderson
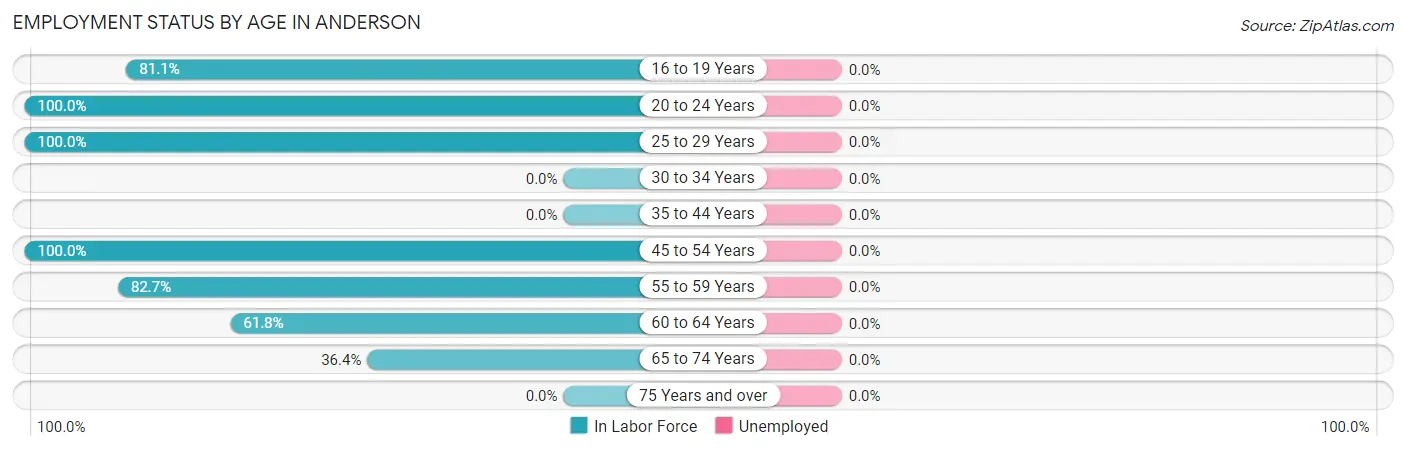
| Age Bracket | In Labor Force | Unemployed |
| 16 to 19 Years | 30 (81.1%) | 0 (0.0%) |
| 20 to 24 Years | 45 (100.0%) | 0 (0.0%) |
| 25 to 29 Years | 9 (100.0%) | 0 (0.0%) |
| 30 to 34 Years | 0 (0.0%) | 0 (0.0%) |
| 35 to 44 Years | 0 (0.0%) | 0 (0.0%) |
| 45 to 54 Years | 108 (100.0%) | 0 (0.0%) |
| 55 to 59 Years | 43 (82.7%) | 0 (0.0%) |
| 60 to 64 Years | 21 (61.8%) | 0 (0.0%) |
| 65 to 74 Years | 4 (36.4%) | 0 (0.0%) |
| 75 Years and over | 0 (0.0%) | 0 (0.0%) |
| Total | 260 (73.7%) | 0 (0.0%) |
Employment Status by Educational Attainment in Anderson
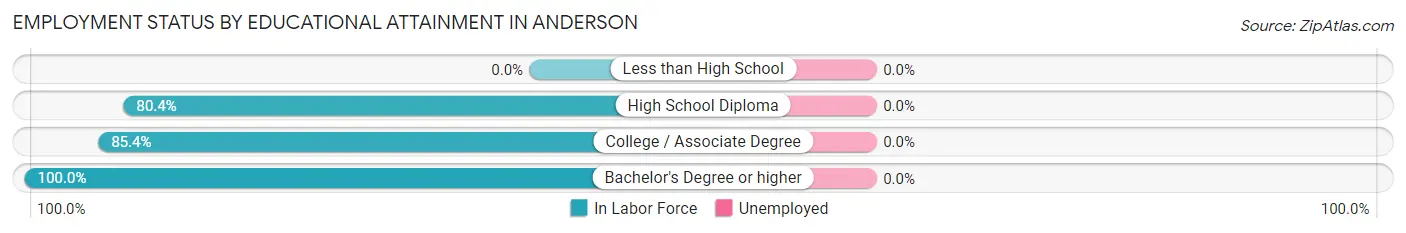
| Educational Attainment | In Labor Force | Unemployed |
| Less than High School | 0 (0.0%) | 0 (0.0%) |
| High School Diploma | 37 (80.4%) | 0 (0.0%) |
| College / Associate Degree | 76 (85.4%) | 0 (0.0%) |
| Bachelor's Degree or higher | 68 (100.0%) | 0 (0.0%) |
| Total | 181 (89.2%) | 0 (0.0%) |
Employment Occupations by Sex in Anderson
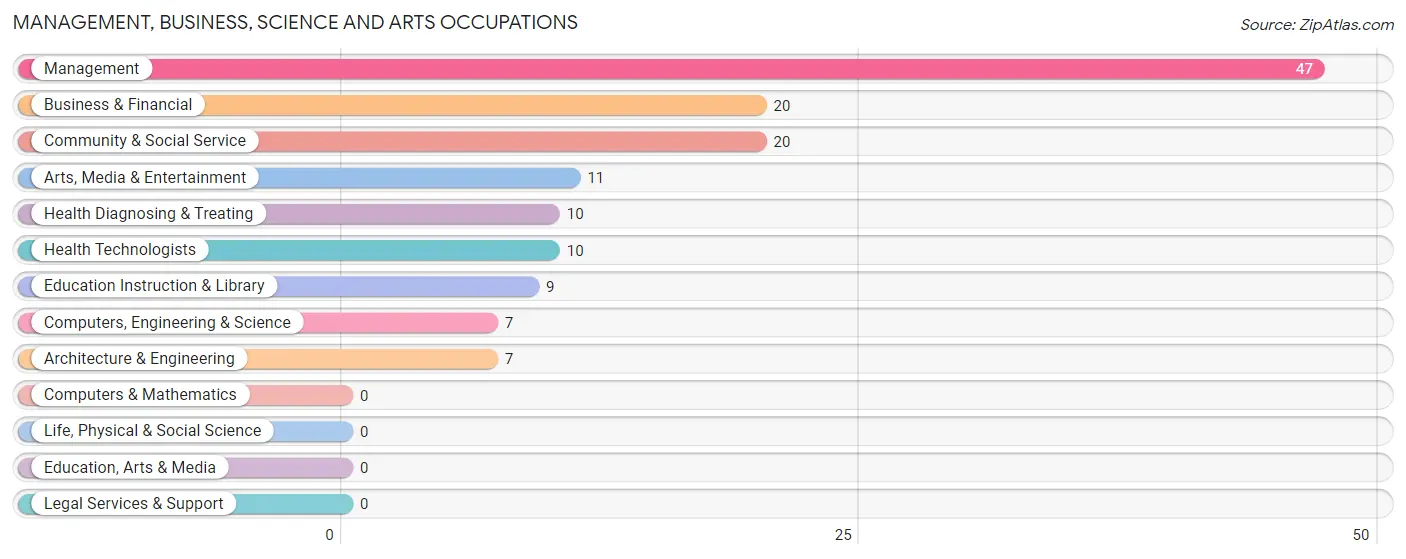
Management, Business, Science and Arts Occupations
The most common Management, Business, Science and Arts occupations in Anderson are Management (47 | 18.1%), Business & Financial (20 | 7.7%), Community & Social Service (20 | 7.7%), Arts, Media & Entertainment (11 | 4.2%), and Health Diagnosing & Treating (10 | 3.8%).
Management, Business, Science and Arts Occupations by Sex
Within the Management, Business, Science and Arts occupations in Anderson, the most male-oriented occupations are Management (74.5%), and Business & Financial (50.0%), while the most female-oriented occupations are Computers, Engineering & Science (100.0%), Architecture & Engineering (100.0%), and Community & Social Service (100.0%).
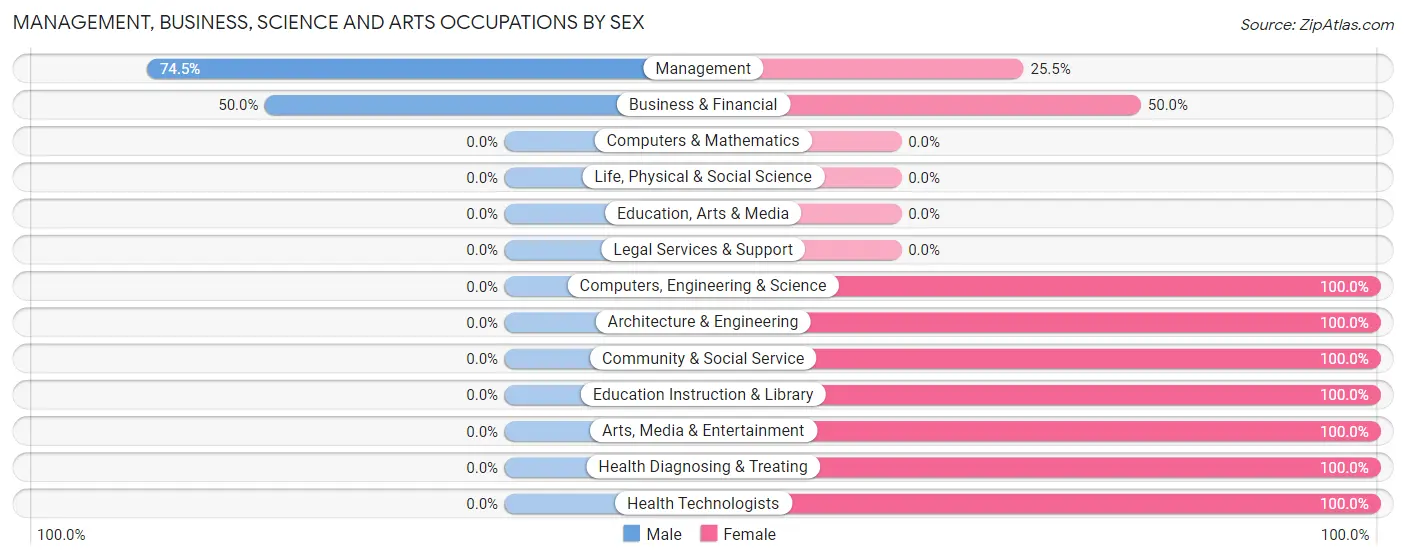
| Occupation | Male | Female |
| Management | 35 (74.5%) | 12 (25.5%) |
| Business & Financial | 10 (50.0%) | 10 (50.0%) |
| Computers, Engineering & Science | 0 (0.0%) | 7 (100.0%) |
| Computers & Mathematics | 0 (0.0%) | 0 (0.0%) |
| Architecture & Engineering | 0 (0.0%) | 7 (100.0%) |
| Life, Physical & Social Science | 0 (0.0%) | 0 (0.0%) |
| Community & Social Service | 0 (0.0%) | 20 (100.0%) |
| Education, Arts & Media | 0 (0.0%) | 0 (0.0%) |
| Legal Services & Support | 0 (0.0%) | 0 (0.0%) |
| Education Instruction & Library | 0 (0.0%) | 9 (100.0%) |
| Arts, Media & Entertainment | 0 (0.0%) | 11 (100.0%) |
| Health Diagnosing & Treating | 0 (0.0%) | 10 (100.0%) |
| Health Technologists | 0 (0.0%) | 10 (100.0%) |
| Total (Category) | 45 (43.3%) | 59 (56.7%) |
| Total (Overall) | 135 (51.9%) | 125 (48.1%) |
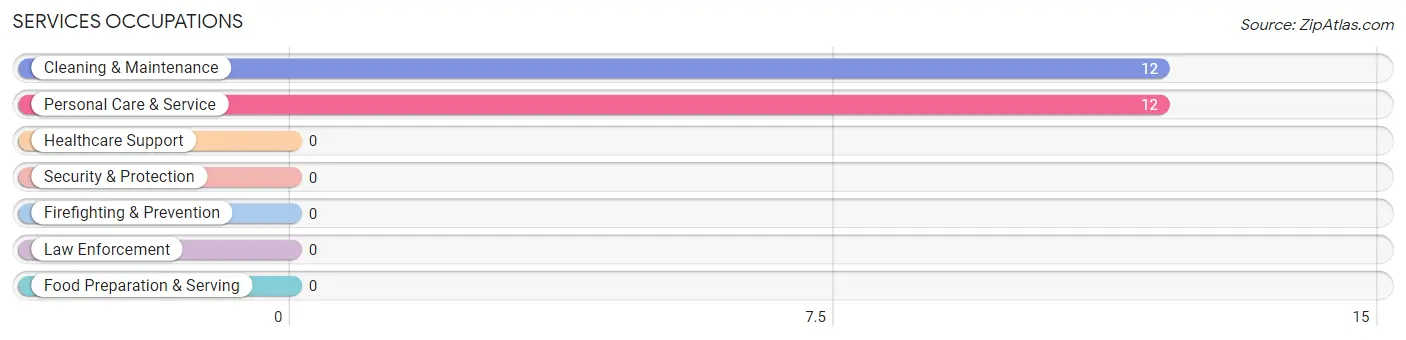
Services Occupations
The most common Services occupations in Anderson are Cleaning & Maintenance (12 | 4.6%), and Personal Care & Service (12 | 4.6%).
Services Occupations by Sex
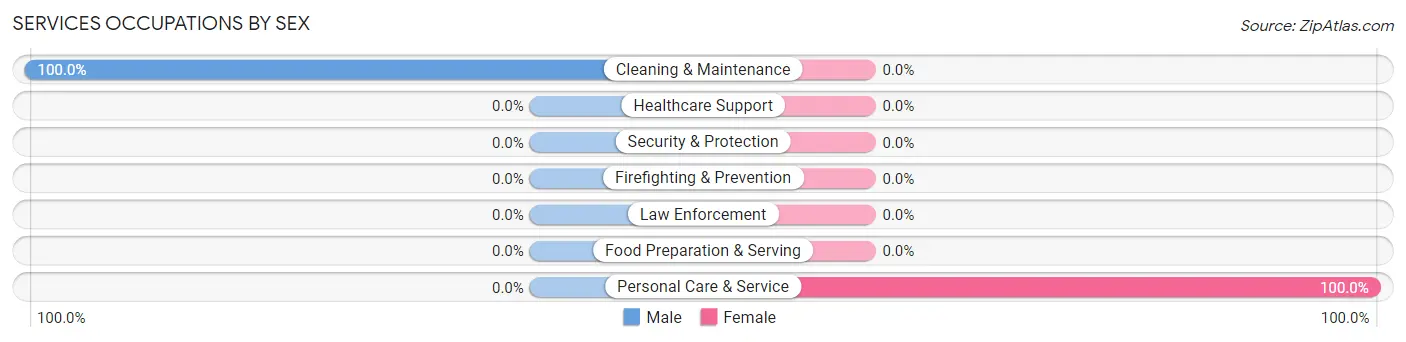
| Occupation | Male | Female |
| Healthcare Support | 0 (0.0%) | 0 (0.0%) |
| Security & Protection | 0 (0.0%) | 0 (0.0%) |
| Firefighting & Prevention | 0 (0.0%) | 0 (0.0%) |
| Law Enforcement | 0 (0.0%) | 0 (0.0%) |
| Food Preparation & Serving | 0 (0.0%) | 0 (0.0%) |
| Cleaning & Maintenance | 12 (100.0%) | 0 (0.0%) |
| Personal Care & Service | 0 (0.0%) | 12 (100.0%) |
| Total (Category) | 12 (50.0%) | 12 (50.0%) |
| Total (Overall) | 135 (51.9%) | 125 (48.1%) |
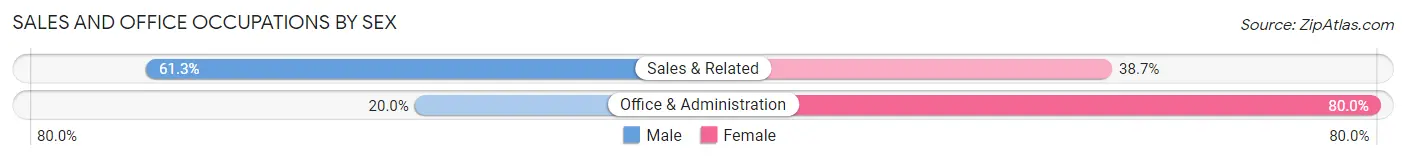
Sales and Office Occupations
The most common Sales and Office occupations in Anderson are Sales & Related (31 | 11.9%), and Office & Administration (20 | 7.7%).
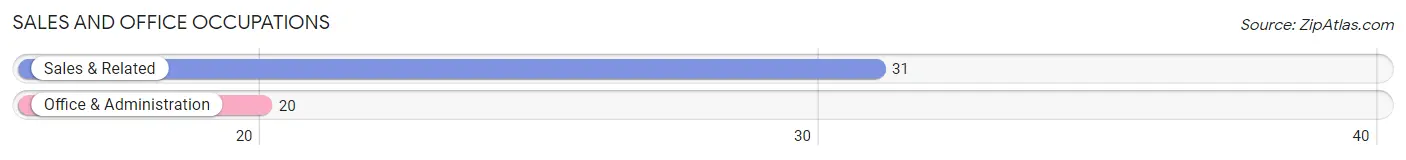
Sales and Office Occupations by Sex
| Occupation | Male | Female |
| Sales & Related | 19 (61.3%) | 12 (38.7%) |
| Office & Administration | 4 (20.0%) | 16 (80.0%) |
| Total (Category) | 23 (45.1%) | 28 (54.9%) |
| Total (Overall) | 135 (51.9%) | 125 (48.1%) |
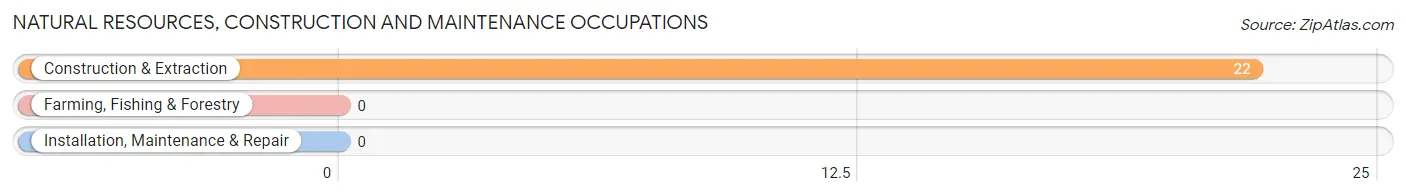
Natural Resources, Construction and Maintenance Occupations
The most common Natural Resources, Construction and Maintenance occupations in Anderson are , and Construction & Extraction (22 | 8.5%).
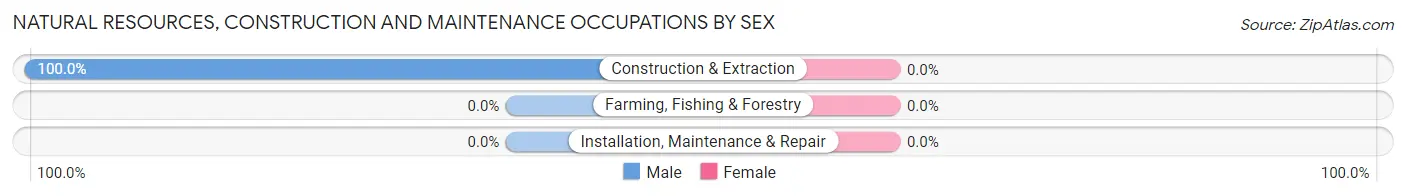
Natural Resources, Construction and Maintenance Occupations by Sex
| Occupation | Male | Female |
| Farming, Fishing & Forestry | 0 (0.0%) | 0 (0.0%) |
| Construction & Extraction | 22 (100.0%) | 0 (0.0%) |
| Installation, Maintenance & Repair | 0 (0.0%) | 0 (0.0%) |
| Total (Category) | 22 (100.0%) | 0 (0.0%) |
| Total (Overall) | 135 (51.9%) | 125 (48.1%) |
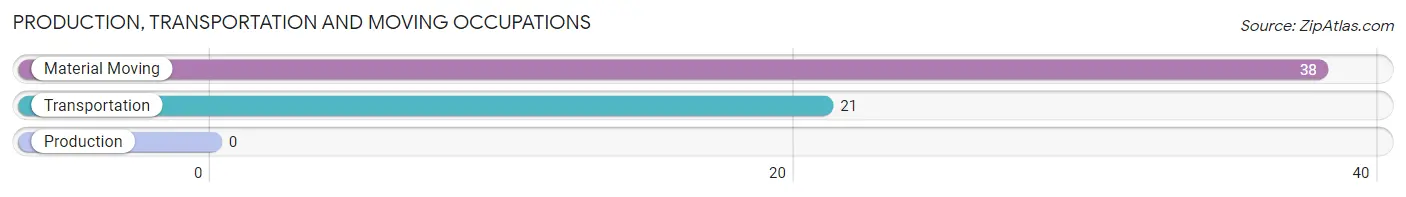
Production, Transportation and Moving Occupations
The most common Production, Transportation and Moving occupations in Anderson are Material Moving (38 | 14.6%), and Transportation (21 | 8.1%).
Production, Transportation and Moving Occupations by Sex
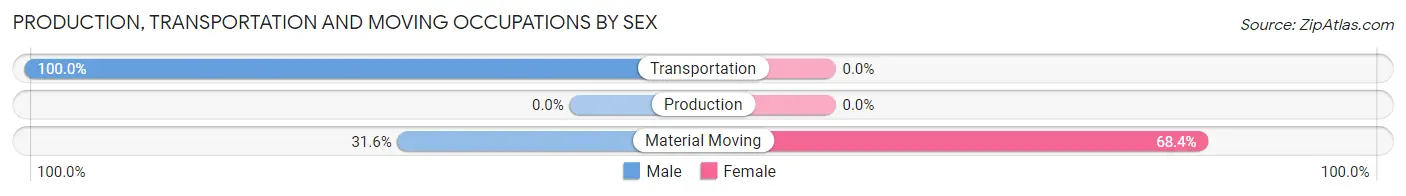
| Occupation | Male | Female |
| Production | 0 (0.0%) | 0 (0.0%) |
| Transportation | 21 (100.0%) | 0 (0.0%) |
| Material Moving | 12 (31.6%) | 26 (68.4%) |
| Total (Category) | 33 (55.9%) | 26 (44.1%) |
| Total (Overall) | 135 (51.9%) | 125 (48.1%) |
Employment Industries by Sex in Anderson
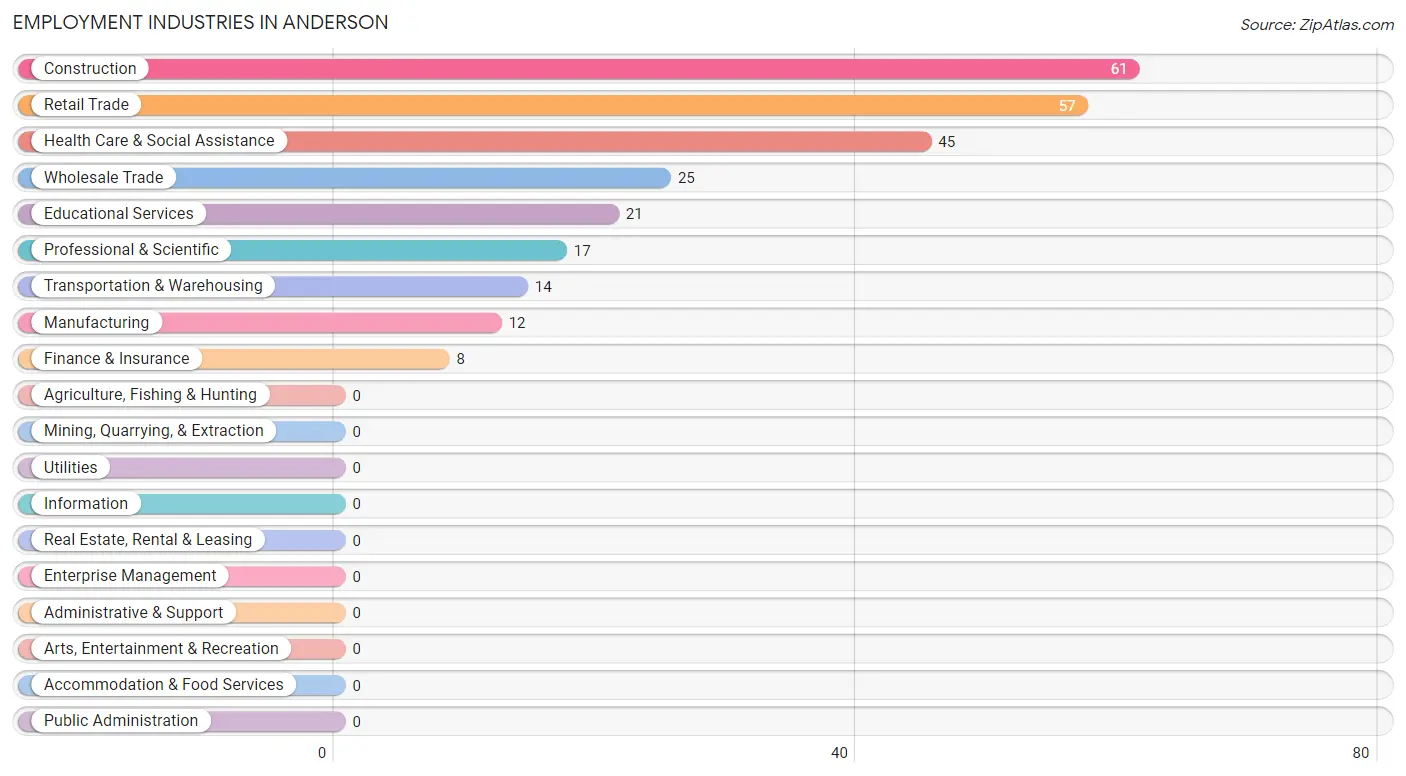
Employment Industries in Anderson
The major employment industries in Anderson include Construction (61 | 23.5%), Retail Trade (57 | 21.9%), Health Care & Social Assistance (45 | 17.3%), Wholesale Trade (25 | 9.6%), and Educational Services (21 | 8.1%).
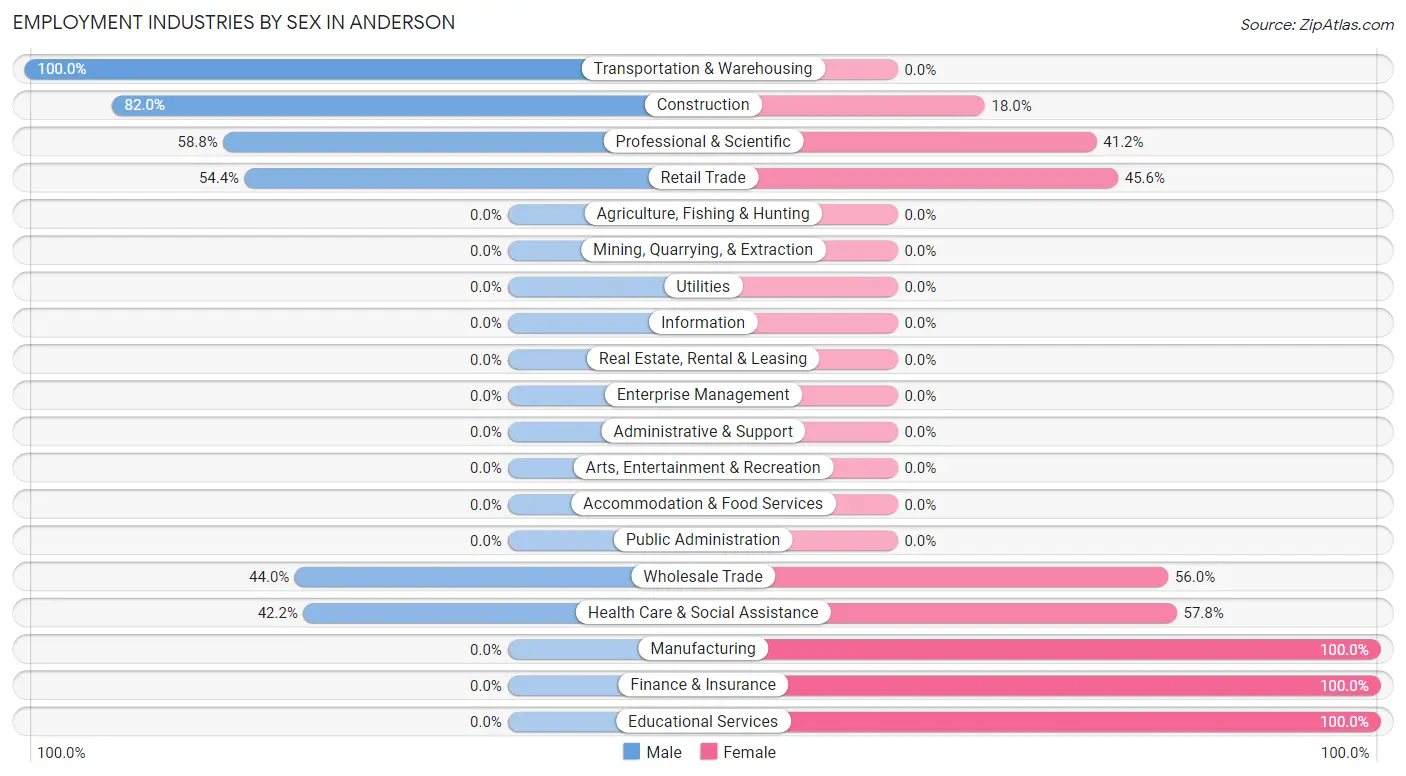
Employment Industries by Sex in Anderson
The Anderson industries that see more men than women are Transportation & Warehousing (100.0%), Construction (82.0%), and Professional & Scientific (58.8%), whereas the industries that tend to have a higher number of women are Manufacturing (100.0%), Finance & Insurance (100.0%), and Educational Services (100.0%).
| Industry | Male | Female |
| Agriculture, Fishing & Hunting | 0 (0.0%) | 0 (0.0%) |
| Mining, Quarrying, & Extraction | 0 (0.0%) | 0 (0.0%) |
| Construction | 50 (82.0%) | 11 (18.0%) |
| Manufacturing | 0 (0.0%) | 12 (100.0%) |
| Wholesale Trade | 11 (44.0%) | 14 (56.0%) |
| Retail Trade | 31 (54.4%) | 26 (45.6%) |
| Transportation & Warehousing | 14 (100.0%) | 0 (0.0%) |
| Utilities | 0 (0.0%) | 0 (0.0%) |
| Information | 0 (0.0%) | 0 (0.0%) |
| Finance & Insurance | 0 (0.0%) | 8 (100.0%) |
| Real Estate, Rental & Leasing | 0 (0.0%) | 0 (0.0%) |
| Professional & Scientific | 10 (58.8%) | 7 (41.2%) |
| Enterprise Management | 0 (0.0%) | 0 (0.0%) |
| Administrative & Support | 0 (0.0%) | 0 (0.0%) |
| Educational Services | 0 (0.0%) | 21 (100.0%) |
| Health Care & Social Assistance | 19 (42.2%) | 26 (57.8%) |
| Arts, Entertainment & Recreation | 0 (0.0%) | 0 (0.0%) |
| Accommodation & Food Services | 0 (0.0%) | 0 (0.0%) |
| Public Administration | 0 (0.0%) | 0 (0.0%) |
| Total | 135 (51.9%) | 125 (48.1%) |
Education in Anderson
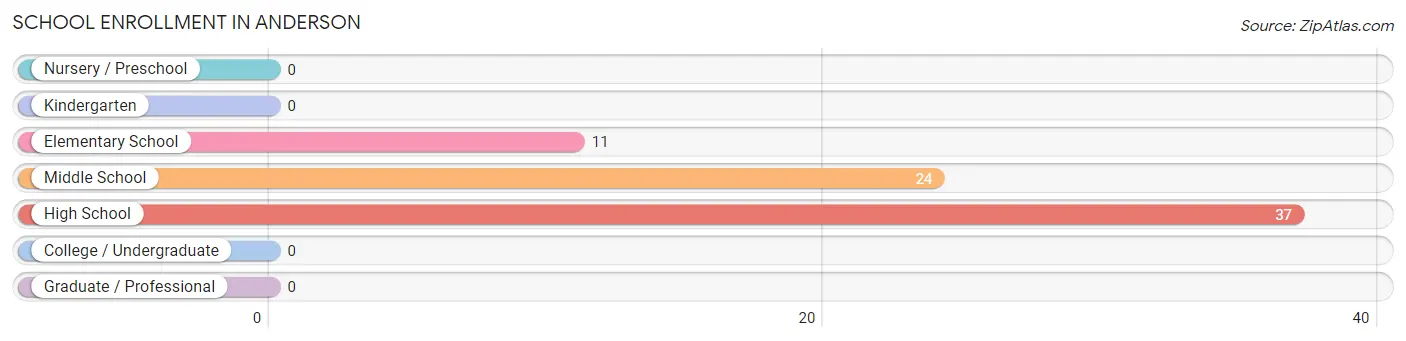
School Enrollment in Anderson
The most common levels of schooling among the 72 students in Anderson are high school (37 | 51.4%), middle school (24 | 33.3%), and elementary school (11 | 15.3%).
| School Level | # Students | % Students |
| Nursery / Preschool | 0 | 0.0% |
| Kindergarten | 0 | 0.0% |
| Elementary School | 11 | 15.3% |
| Middle School | 24 | 33.3% |
| High School | 37 | 51.4% |
| College / Undergraduate | 0 | 0.0% |
| Graduate / Professional | 0 | 0.0% |
| Total | 72 | 100.0% |
School Enrollment by Age by Funding Source in Anderson
Out of a total of 72 students who are enrolled in schools in Anderson, 61 (84.7%) attend a private institution, while the remaining 11 (15.3%) are enrolled in public schools. The age group of 5 to 9 year old has the highest likelihood of being enrolled in private schools, with 11 (100.0% in the age bracket) enrolled. Conversely, the age group of 18 to 19 year olds has the lowest likelihood of being enrolled in a private school, with 7 (100.0% in the age bracket) attending a public institution.
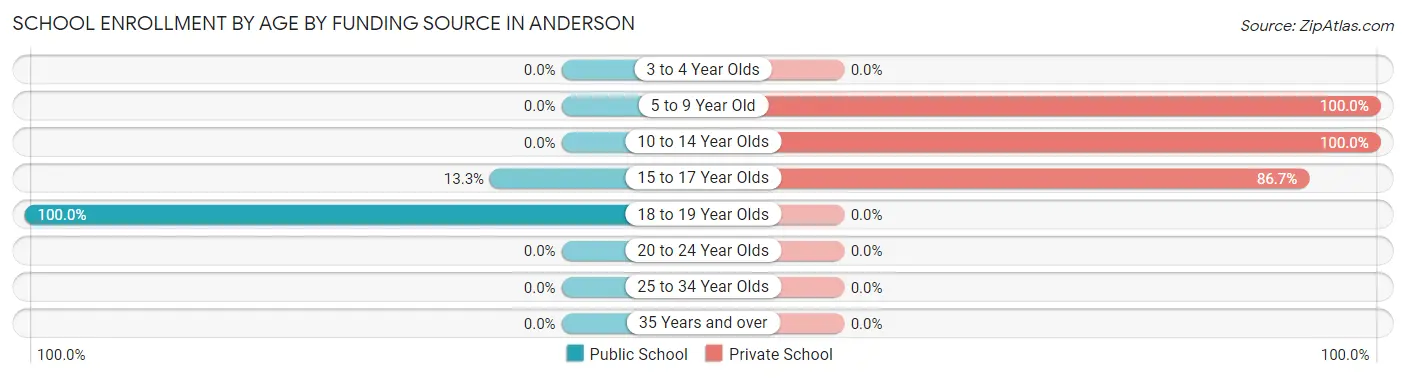
| Age Bracket | Public School | Private School |
| 3 to 4 Year Olds | 0 (0.0%) | 0 (0.0%) |
| 5 to 9 Year Old | 0 (0.0%) | 11 (100.0%) |
| 10 to 14 Year Olds | 0 (0.0%) | 24 (100.0%) |
| 15 to 17 Year Olds | 4 (13.3%) | 26 (86.7%) |
| 18 to 19 Year Olds | 7 (100.0%) | 0 (0.0%) |
| 20 to 24 Year Olds | 0 (0.0%) | 0 (0.0%) |
| 25 to 34 Year Olds | 0 (0.0%) | 0 (0.0%) |
| 35 Years and over | 0 (0.0%) | 0 (0.0%) |
| Total | 11 (15.3%) | 61 (84.7%) |
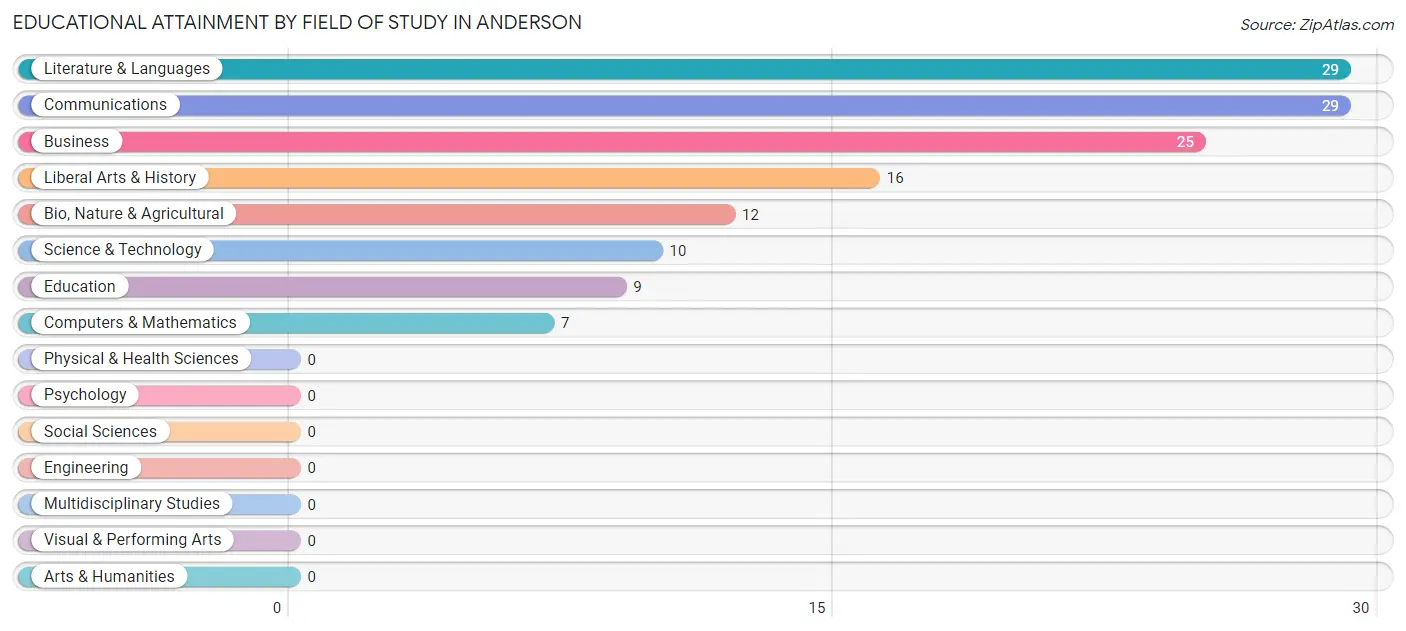
Educational Attainment by Field of Study in Anderson
Literature & languages (29 | 21.2%), communications (29 | 21.2%), business (25 | 18.2%), liberal arts & history (16 | 11.7%), and bio, nature & agricultural (12 | 8.8%) are the most common fields of study among 137 individuals in Anderson who have obtained a bachelor's degree or higher.
| Field of Study | # Graduates | % Graduates |
| Computers & Mathematics | 7 | 5.1% |
| Bio, Nature & Agricultural | 12 | 8.8% |
| Physical & Health Sciences | 0 | 0.0% |
| Psychology | 0 | 0.0% |
| Social Sciences | 0 | 0.0% |
| Engineering | 0 | 0.0% |
| Multidisciplinary Studies | 0 | 0.0% |
| Science & Technology | 10 | 7.3% |
| Business | 25 | 18.2% |
| Education | 9 | 6.6% |
| Literature & Languages | 29 | 21.2% |
| Liberal Arts & History | 16 | 11.7% |
| Visual & Performing Arts | 0 | 0.0% |
| Communications | 29 | 21.2% |
| Arts & Humanities | 0 | 0.0% |
| Total | 137 | 100.0% |
Transportation & Commute in Anderson
Vehicle Availability by Sex in Anderson
The most prevalent vehicle ownership categories in Anderson are males with 5 or more vehicles (45, accounting for 36.0%) and females with 5 or more vehicles (65, making up 36.0%).
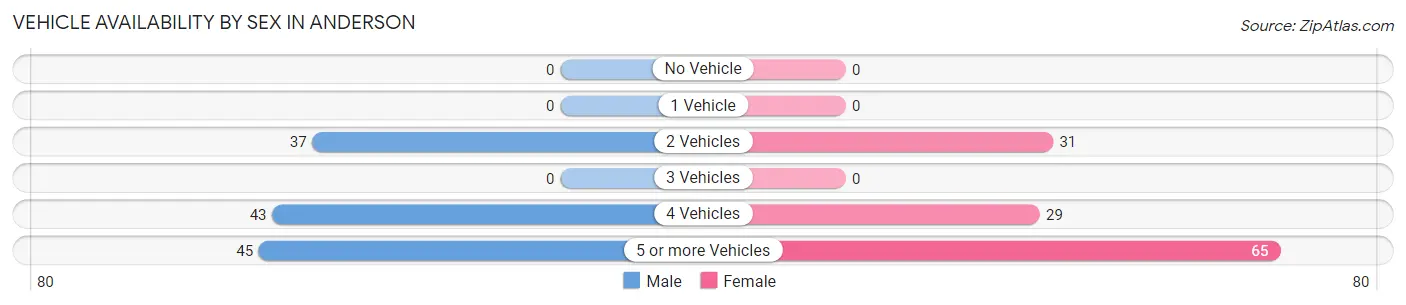
| Vehicles Available | Male | Female |
| No Vehicle | 0 (0.0%) | 0 (0.0%) |
| 1 Vehicle | 0 (0.0%) | 0 (0.0%) |
| 2 Vehicles | 37 (29.6%) | 31 (24.8%) |
| 3 Vehicles | 0 (0.0%) | 0 (0.0%) |
| 4 Vehicles | 43 (34.4%) | 29 (23.2%) |
| 5 or more Vehicles | 45 (36.0%) | 65 (52.0%) |
| Total | 125 (100.0%) | 125 (100.0%) |
Commute Time in Anderson
The most frequently occuring commute durations in Anderson are 15 to 19 minutes (53 commuters, 25.5%), 20 to 24 minutes (53 commuters, 25.5%), and 10 to 14 minutes (50 commuters, 24.0%).
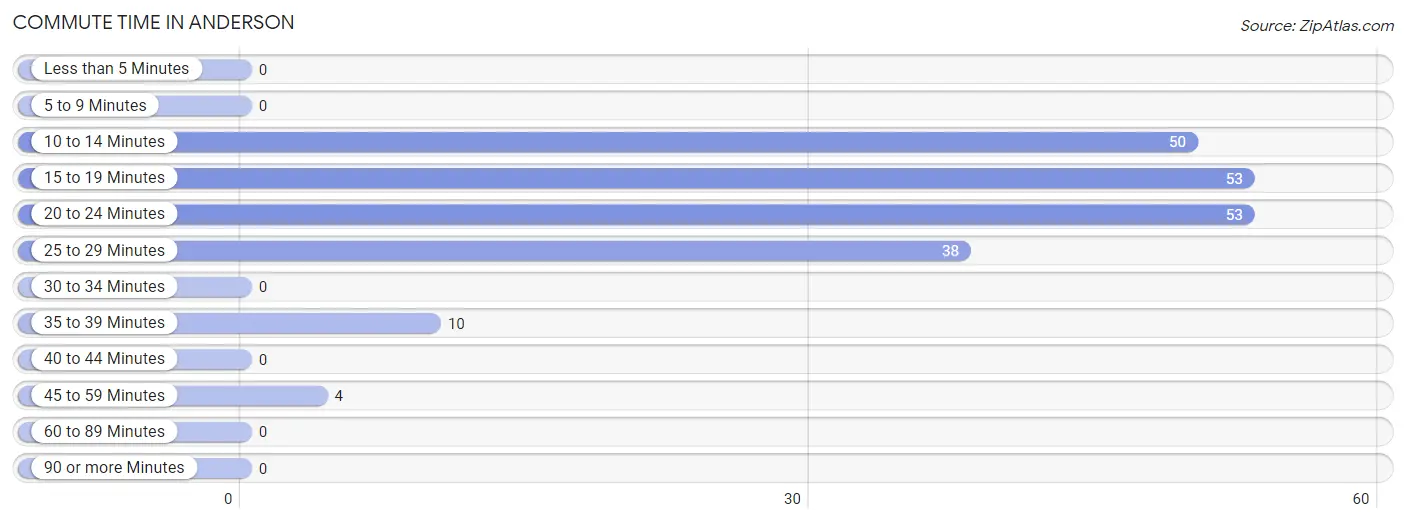
| Commute Time | # Commuters | % Commuters |
| Less than 5 Minutes | 0 | 0.0% |
| 5 to 9 Minutes | 0 | 0.0% |
| 10 to 14 Minutes | 50 | 24.0% |
| 15 to 19 Minutes | 53 | 25.5% |
| 20 to 24 Minutes | 53 | 25.5% |
| 25 to 29 Minutes | 38 | 18.3% |
| 30 to 34 Minutes | 0 | 0.0% |
| 35 to 39 Minutes | 10 | 4.8% |
| 40 to 44 Minutes | 0 | 0.0% |
| 45 to 59 Minutes | 4 | 1.9% |
| 60 to 89 Minutes | 0 | 0.0% |
| 90 or more Minutes | 0 | 0.0% |
Commute Time by Sex in Anderson
The most common commute times in Anderson are 15 to 19 minutes (37 commuters, 33.0%) for males and 10 to 14 minutes (38 commuters, 39.6%) for females.
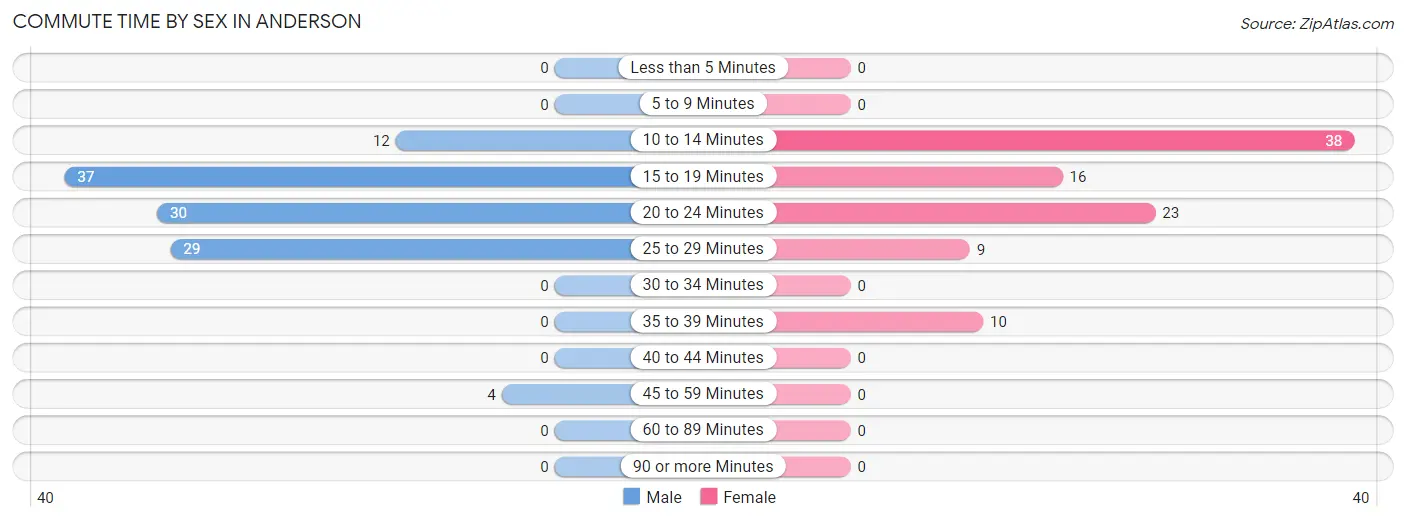
| Commute Time | Male | Female |
| Less than 5 Minutes | 0 (0.0%) | 0 (0.0%) |
| 5 to 9 Minutes | 0 (0.0%) | 0 (0.0%) |
| 10 to 14 Minutes | 12 (10.7%) | 38 (39.6%) |
| 15 to 19 Minutes | 37 (33.0%) | 16 (16.7%) |
| 20 to 24 Minutes | 30 (26.8%) | 23 (24.0%) |
| 25 to 29 Minutes | 29 (25.9%) | 9 (9.4%) |
| 30 to 34 Minutes | 0 (0.0%) | 0 (0.0%) |
| 35 to 39 Minutes | 0 (0.0%) | 10 (10.4%) |
| 40 to 44 Minutes | 0 (0.0%) | 0 (0.0%) |
| 45 to 59 Minutes | 4 (3.6%) | 0 (0.0%) |
| 60 to 89 Minutes | 0 (0.0%) | 0 (0.0%) |
| 90 or more Minutes | 0 (0.0%) | 0 (0.0%) |
Time of Departure to Work by Sex in Anderson
The most frequent times of departure to work in Anderson are 6:30 AM to 6:59 AM (28, 25.0%) for males and 7:00 AM to 7:29 AM (29, 30.2%) for females.
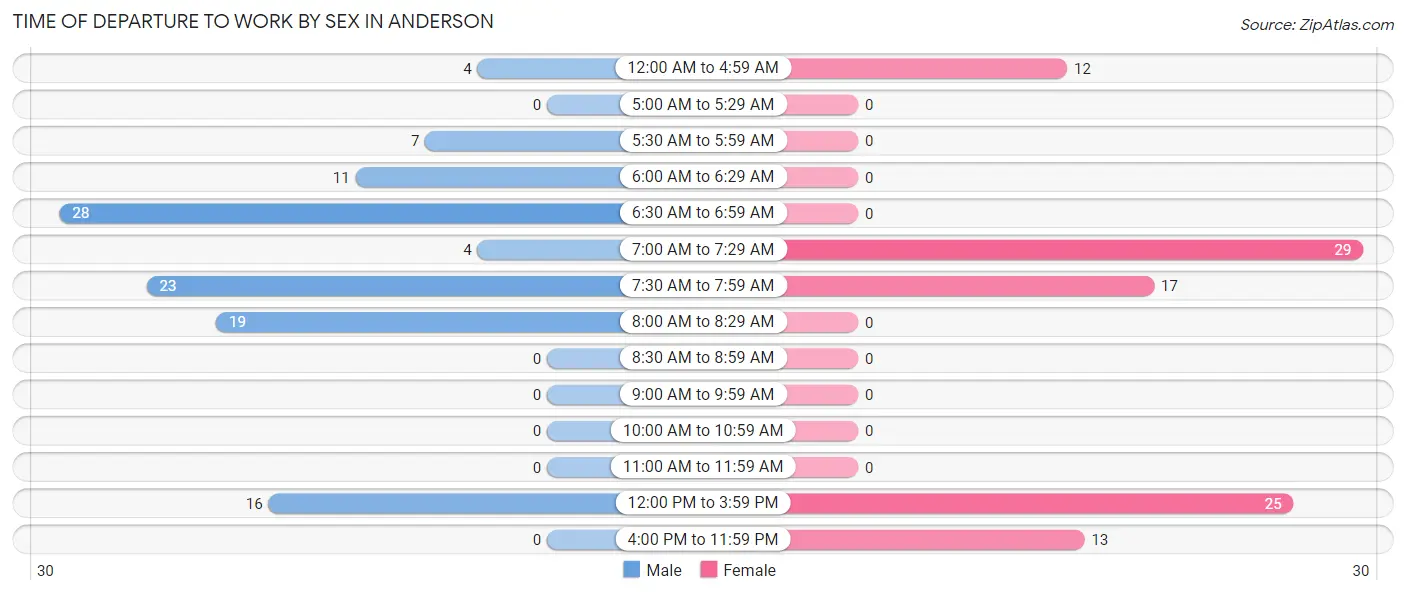
| Time of Departure | Male | Female |
| 12:00 AM to 4:59 AM | 4 (3.6%) | 12 (12.5%) |
| 5:00 AM to 5:29 AM | 0 (0.0%) | 0 (0.0%) |
| 5:30 AM to 5:59 AM | 7 (6.2%) | 0 (0.0%) |
| 6:00 AM to 6:29 AM | 11 (9.8%) | 0 (0.0%) |
| 6:30 AM to 6:59 AM | 28 (25.0%) | 0 (0.0%) |
| 7:00 AM to 7:29 AM | 4 (3.6%) | 29 (30.2%) |
| 7:30 AM to 7:59 AM | 23 (20.5%) | 17 (17.7%) |
| 8:00 AM to 8:29 AM | 19 (17.0%) | 0 (0.0%) |
| 8:30 AM to 8:59 AM | 0 (0.0%) | 0 (0.0%) |
| 9:00 AM to 9:59 AM | 0 (0.0%) | 0 (0.0%) |
| 10:00 AM to 10:59 AM | 0 (0.0%) | 0 (0.0%) |
| 11:00 AM to 11:59 AM | 0 (0.0%) | 0 (0.0%) |
| 12:00 PM to 3:59 PM | 16 (14.3%) | 25 (26.0%) |
| 4:00 PM to 11:59 PM | 0 (0.0%) | 13 (13.5%) |
| Total | 112 (100.0%) | 96 (100.0%) |
Housing Occupancy in Anderson
Occupancy by Ownership in Anderson
Of the total 137 dwellings in Anderson, owner-occupied units account for 121 (88.3%), while renter-occupied units make up 16 (11.7%).
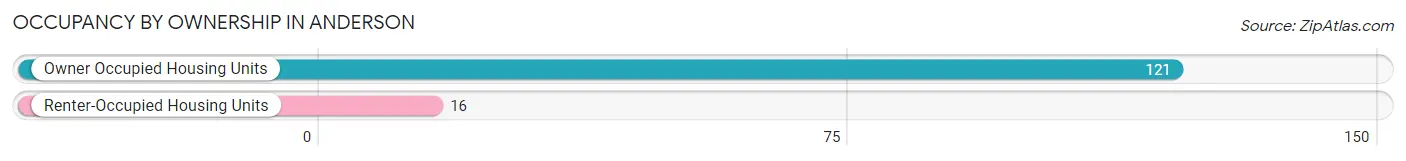
| Occupancy | # Housing Units | % Housing Units |
| Owner Occupied Housing Units | 121 | 88.3% |
| Renter-Occupied Housing Units | 16 | 11.7% |
| Total Occupied Housing Units | 137 | 100.0% |
Occupancy by Household Size in Anderson
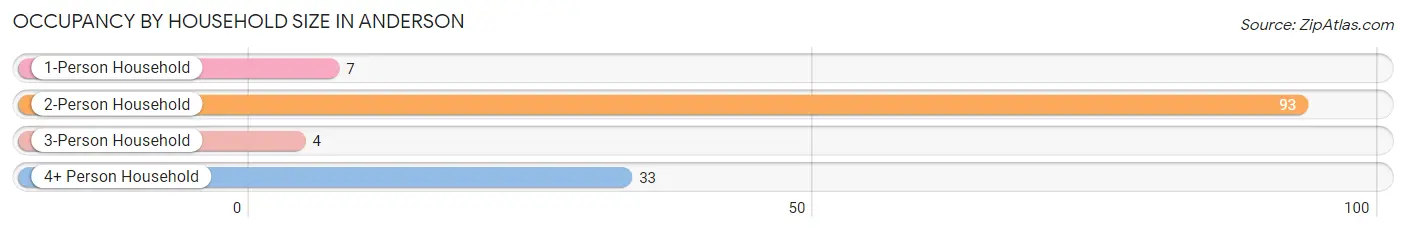
| Household Size | # Housing Units | % Housing Units |
| 1-Person Household | 7 | 5.1% |
| 2-Person Household | 93 | 67.9% |
| 3-Person Household | 4 | 2.9% |
| 4+ Person Household | 33 | 24.1% |
| Total Housing Units | 137 | 100.0% |
Occupancy by Ownership by Household Size in Anderson
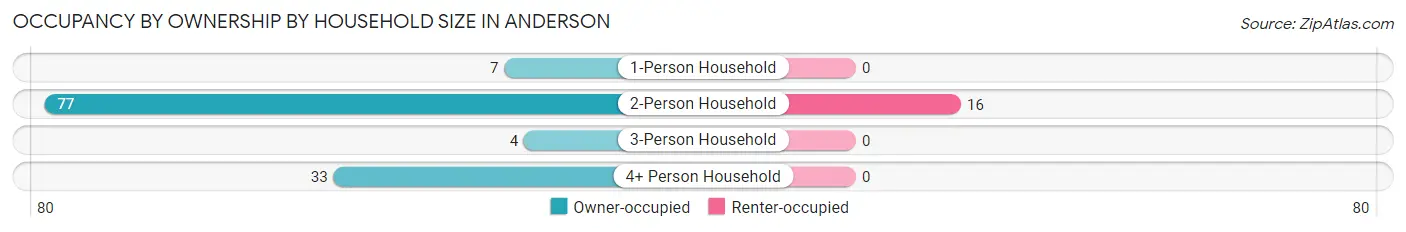
| Household Size | Owner-occupied | Renter-occupied |
| 1-Person Household | 7 (100.0%) | 0 (0.0%) |
| 2-Person Household | 77 (82.8%) | 16 (17.2%) |
| 3-Person Household | 4 (100.0%) | 0 (0.0%) |
| 4+ Person Household | 33 (100.0%) | 0 (0.0%) |
| Total Housing Units | 121 (88.3%) | 16 (11.7%) |
Occupancy by Educational Attainment in Anderson
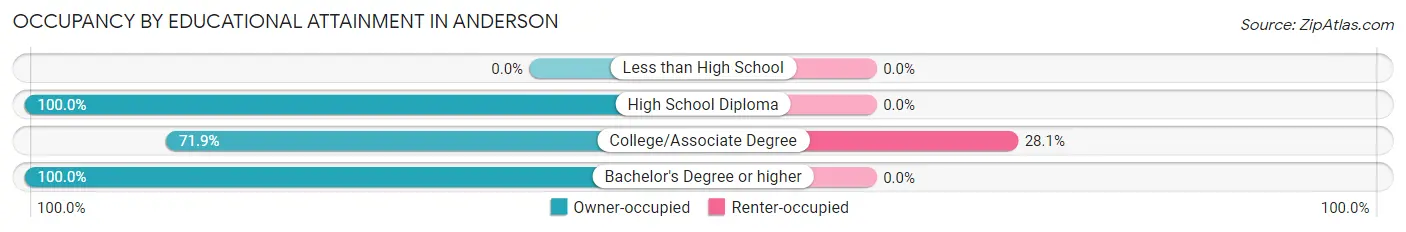
| Household Size | Owner-occupied | Renter-occupied |
| Less than High School | 0 (0.0%) | 0 (0.0%) |
| High School Diploma | 7 (100.0%) | 0 (0.0%) |
| College/Associate Degree | 41 (71.9%) | 16 (28.1%) |
| Bachelor's Degree or higher | 73 (100.0%) | 0 (0.0%) |
Occupancy by Age of Householder in Anderson
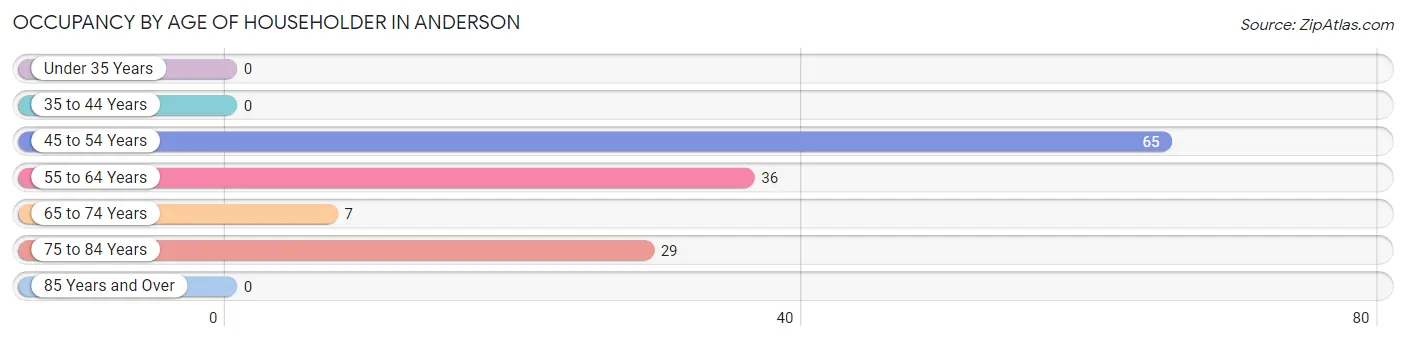
| Age Bracket | # Households | % Households |
| Under 35 Years | 0 | 0.0% |
| 35 to 44 Years | 0 | 0.0% |
| 45 to 54 Years | 65 | 47.4% |
| 55 to 64 Years | 36 | 26.3% |
| 65 to 74 Years | 7 | 5.1% |
| 75 to 84 Years | 29 | 21.2% |
| 85 Years and Over | 0 | 0.0% |
| Total | 137 | 100.0% |
Housing Finances in Anderson
Median Income by Occupancy in Anderson
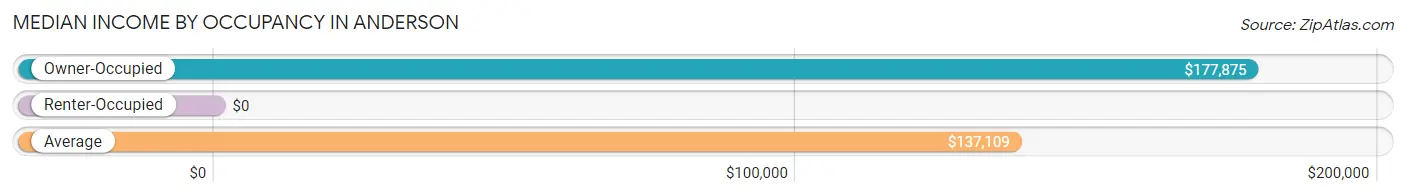
| Occupancy Type | # Households | Median Income |
| Owner-Occupied | 121 (88.3%) | $177,875 |
| Renter-Occupied | 16 (11.7%) | $0 |
| Average | 137 (100.0%) | $137,109 |
Occupancy by Householder Income Bracket in Anderson
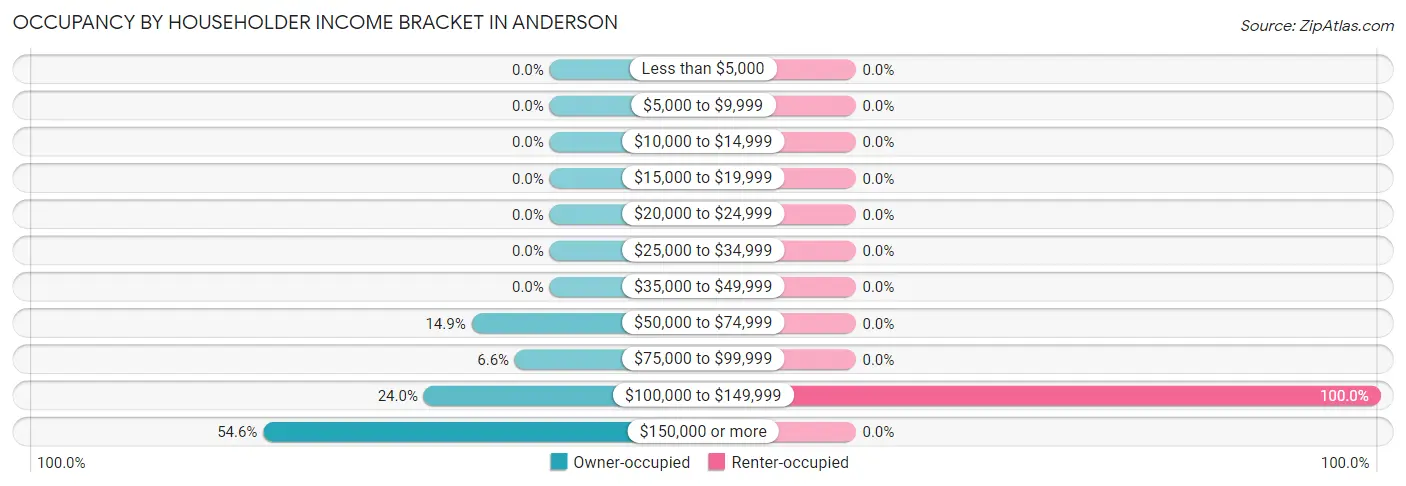
| Income Bracket | Owner-occupied | Renter-occupied |
| Less than $5,000 | 0 (0.0%) | 0 (0.0%) |
| $5,000 to $9,999 | 0 (0.0%) | 0 (0.0%) |
| $10,000 to $14,999 | 0 (0.0%) | 0 (0.0%) |
| $15,000 to $19,999 | 0 (0.0%) | 0 (0.0%) |
| $20,000 to $24,999 | 0 (0.0%) | 0 (0.0%) |
| $25,000 to $34,999 | 0 (0.0%) | 0 (0.0%) |
| $35,000 to $49,999 | 0 (0.0%) | 0 (0.0%) |
| $50,000 to $74,999 | 18 (14.9%) | 0 (0.0%) |
| $75,000 to $99,999 | 8 (6.6%) | 0 (0.0%) |
| $100,000 to $149,999 | 29 (24.0%) | 16 (100.0%) |
| $150,000 or more | 66 (54.5%) | 0 (0.0%) |
| Total | 121 (100.0%) | 16 (100.0%) |
Monthly Housing Cost Tiers in Anderson
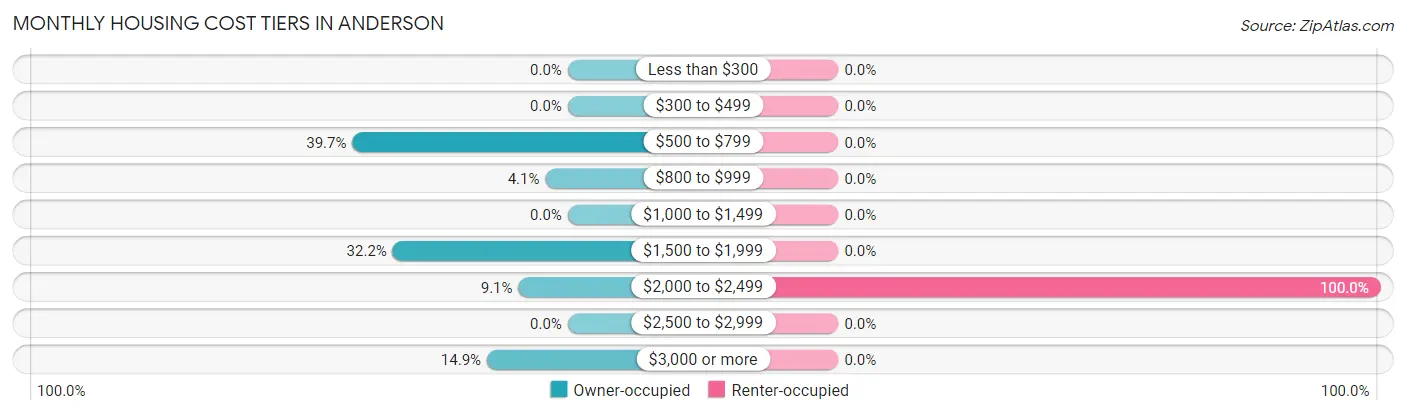
| Monthly Cost | Owner-occupied | Renter-occupied |
| Less than $300 | 0 (0.0%) | 0 (0.0%) |
| $300 to $499 | 0 (0.0%) | 0 (0.0%) |
| $500 to $799 | 48 (39.7%) | 0 (0.0%) |
| $800 to $999 | 5 (4.1%) | 0 (0.0%) |
| $1,000 to $1,499 | 0 (0.0%) | 0 (0.0%) |
| $1,500 to $1,999 | 39 (32.2%) | 0 (0.0%) |
| $2,000 to $2,499 | 11 (9.1%) | 16 (100.0%) |
| $2,500 to $2,999 | 0 (0.0%) | 0 (0.0%) |
| $3,000 or more | 18 (14.9%) | 0 (0.0%) |
| Total | 121 (100.0%) | 16 (100.0%) |
Physical Housing Characteristics in Anderson
Housing Structures in Anderson
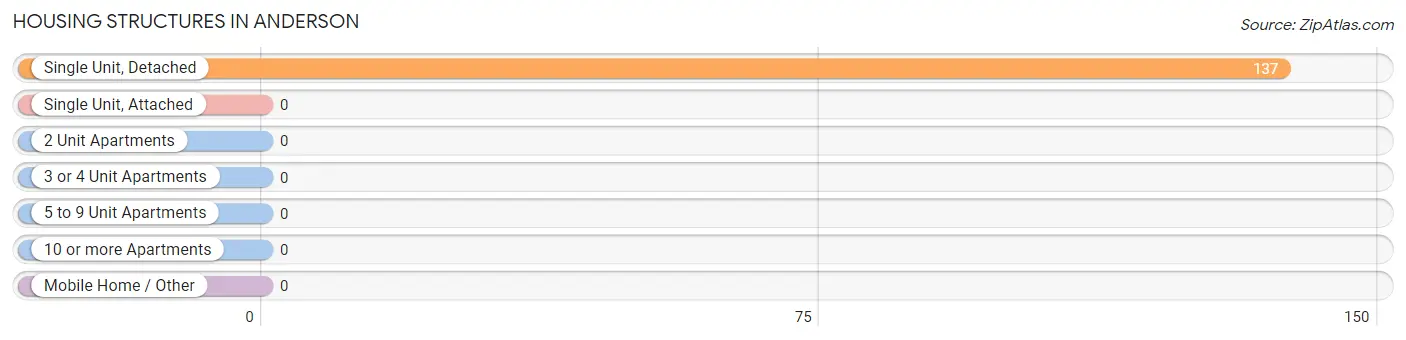
| Structure Type | # Housing Units | % Housing Units |
| Single Unit, Detached | 137 | 100.0% |
| Single Unit, Attached | 0 | 0.0% |
| 2 Unit Apartments | 0 | 0.0% |
| 3 or 4 Unit Apartments | 0 | 0.0% |
| 5 to 9 Unit Apartments | 0 | 0.0% |
| 10 or more Apartments | 0 | 0.0% |
| Mobile Home / Other | 0 | 0.0% |
| Total | 137 | 100.0% |
Housing Structures by Occupancy in Anderson
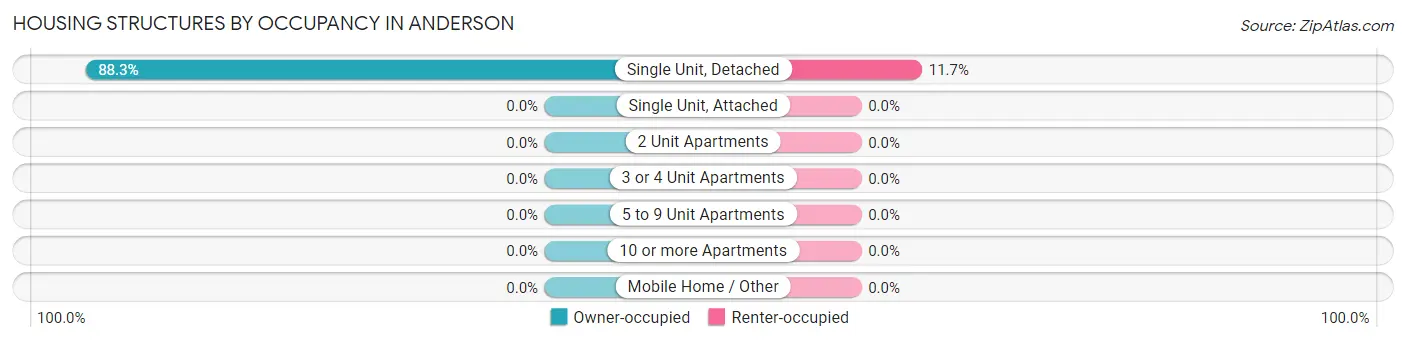
| Structure Type | Owner-occupied | Renter-occupied |
| Single Unit, Detached | 121 (88.3%) | 16 (11.7%) |
| Single Unit, Attached | 0 (0.0%) | 0 (0.0%) |
| 2 Unit Apartments | 0 (0.0%) | 0 (0.0%) |
| 3 or 4 Unit Apartments | 0 (0.0%) | 0 (0.0%) |
| 5 to 9 Unit Apartments | 0 (0.0%) | 0 (0.0%) |
| 10 or more Apartments | 0 (0.0%) | 0 (0.0%) |
| Mobile Home / Other | 0 (0.0%) | 0 (0.0%) |
| Total | 121 (88.3%) | 16 (11.7%) |
Housing Structures by Number of Rooms in Anderson
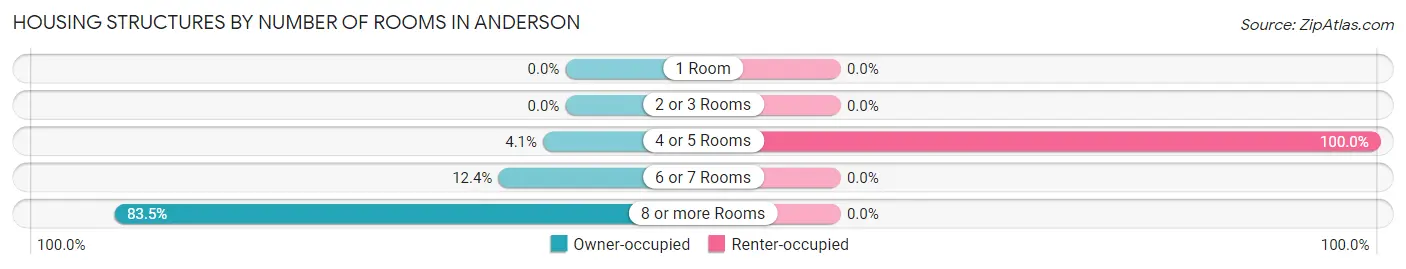
| Number of Rooms | Owner-occupied | Renter-occupied |
| 1 Room | 0 (0.0%) | 0 (0.0%) |
| 2 or 3 Rooms | 0 (0.0%) | 0 (0.0%) |
| 4 or 5 Rooms | 5 (4.1%) | 16 (100.0%) |
| 6 or 7 Rooms | 15 (12.4%) | 0 (0.0%) |
| 8 or more Rooms | 101 (83.5%) | 0 (0.0%) |
| Total | 121 (100.0%) | 16 (100.0%) |
Housing Structure by Heating Type in Anderson

| Heating Type | Owner-occupied | Renter-occupied |
| Utility Gas | 0 (0.0%) | 0 (0.0%) |
| Bottled, Tank, or LP Gas | 36 (29.7%) | 16 (100.0%) |
| Electricity | 75 (62.0%) | 0 (0.0%) |
| Fuel Oil or Kerosene | 0 (0.0%) | 0 (0.0%) |
| Coal or Coke | 0 (0.0%) | 0 (0.0%) |
| All other Fuels | 10 (8.3%) | 0 (0.0%) |
| No Fuel Used | 0 (0.0%) | 0 (0.0%) |
| Total | 121 (100.0%) | 16 (100.0%) |
Household Vehicle Usage in Anderson
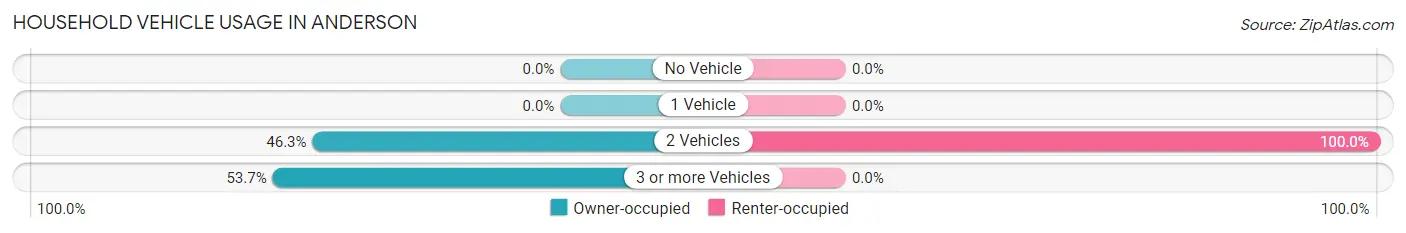
| Vehicles per Household | Owner-occupied | Renter-occupied |
| No Vehicle | 0 (0.0%) | 0 (0.0%) |
| 1 Vehicle | 0 (0.0%) | 0 (0.0%) |
| 2 Vehicles | 56 (46.3%) | 16 (100.0%) |
| 3 or more Vehicles | 65 (53.7%) | 0 (0.0%) |
| Total | 121 (100.0%) | 16 (100.0%) |
Real Estate & Mortgages in Anderson
Real Estate and Mortgage Overview in Anderson
| Characteristic | Without Mortgage | With Mortgage |
| Housing Units | 53 | 68 |
| Median Property Value | $332,800 | $417,900 |
| Median Household Income | - | - |
| Monthly Housing Costs | $591 | $18 |
| Real Estate Taxes | $3,328 | $0 |
Property Value by Mortgage Status in Anderson
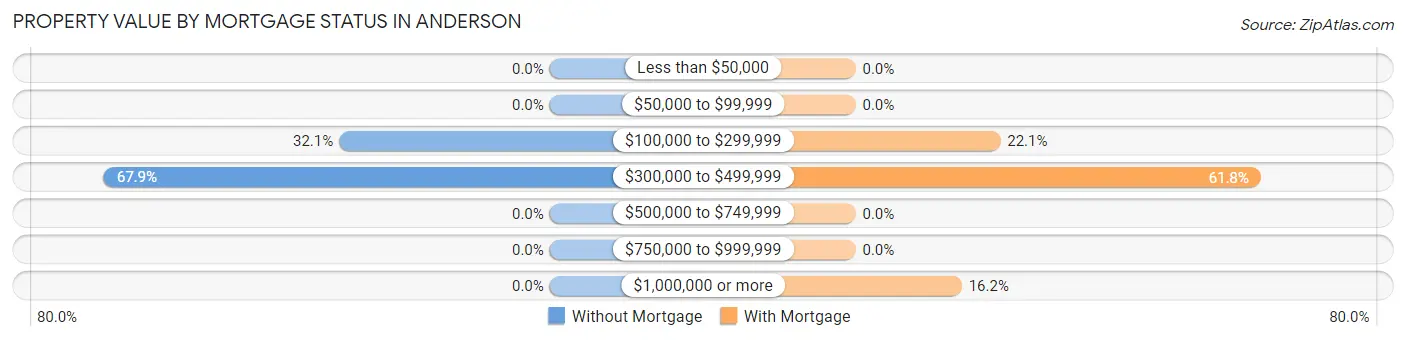
| Property Value | Without Mortgage | With Mortgage |
| Less than $50,000 | 0 (0.0%) | 0 (0.0%) |
| $50,000 to $99,999 | 0 (0.0%) | 0 (0.0%) |
| $100,000 to $299,999 | 17 (32.1%) | 15 (22.1%) |
| $300,000 to $499,999 | 36 (67.9%) | 42 (61.8%) |
| $500,000 to $749,999 | 0 (0.0%) | 0 (0.0%) |
| $750,000 to $999,999 | 0 (0.0%) | 0 (0.0%) |
| $1,000,000 or more | 0 (0.0%) | 11 (16.2%) |
| Total | 53 (100.0%) | 68 (100.0%) |
Household Income by Mortgage Status in Anderson
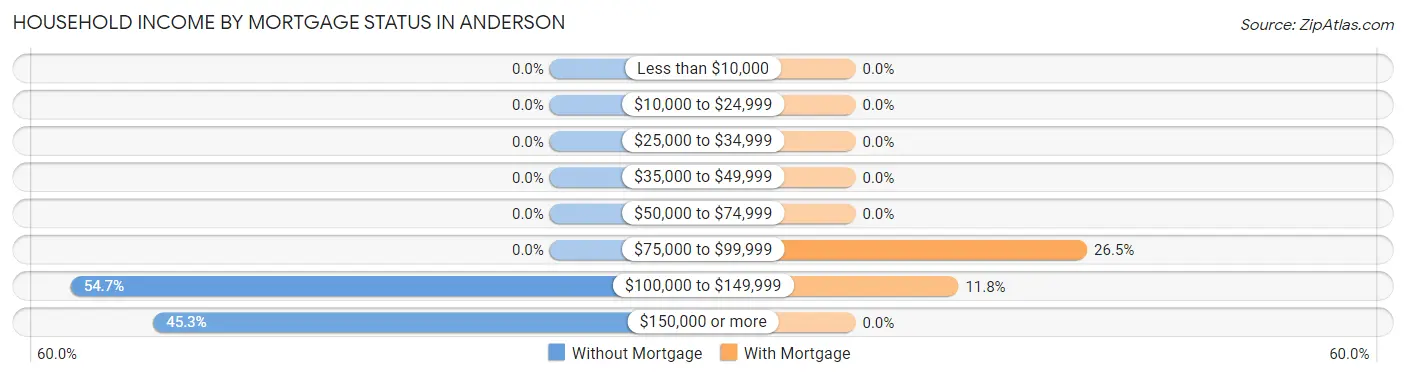
| Household Income | Without Mortgage | With Mortgage |
| Less than $10,000 | 0 (0.0%) | 0 (0.0%) |
| $10,000 to $24,999 | 0 (0.0%) | 0 (0.0%) |
| $25,000 to $34,999 | 0 (0.0%) | 0 (0.0%) |
| $35,000 to $49,999 | 0 (0.0%) | 0 (0.0%) |
| $50,000 to $74,999 | 0 (0.0%) | 0 (0.0%) |
| $75,000 to $99,999 | 0 (0.0%) | 18 (26.5%) |
| $100,000 to $149,999 | 29 (54.7%) | 8 (11.8%) |
| $150,000 or more | 24 (45.3%) | 0 (0.0%) |
| Total | 53 (100.0%) | 68 (100.0%) |
Property Value to Household Income Ratio in Anderson
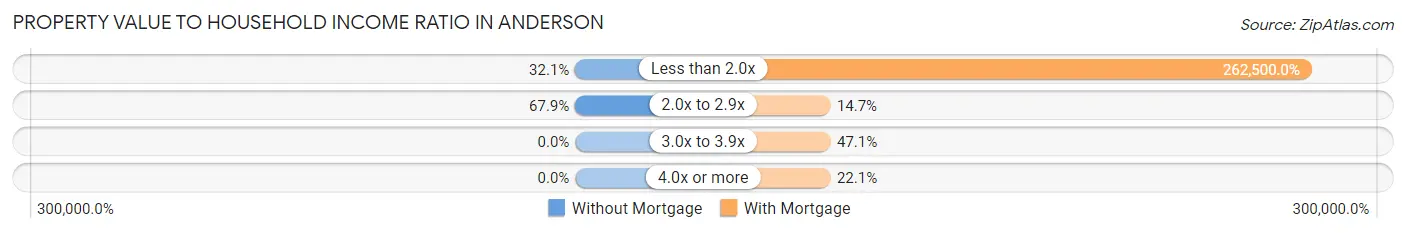
| Value-to-Income Ratio | Without Mortgage | With Mortgage |
| Less than 2.0x | 17 (32.1%) | 178,500 (262,500.0%) |
| 2.0x to 2.9x | 36 (67.9%) | 10 (14.7%) |
| 3.0x to 3.9x | 0 (0.0%) | 32 (47.1%) |
| 4.0x or more | 0 (0.0%) | 15 (22.1%) |
| Total | 53 (100.0%) | 68 (100.0%) |
Real Estate Taxes by Mortgage Status in Anderson
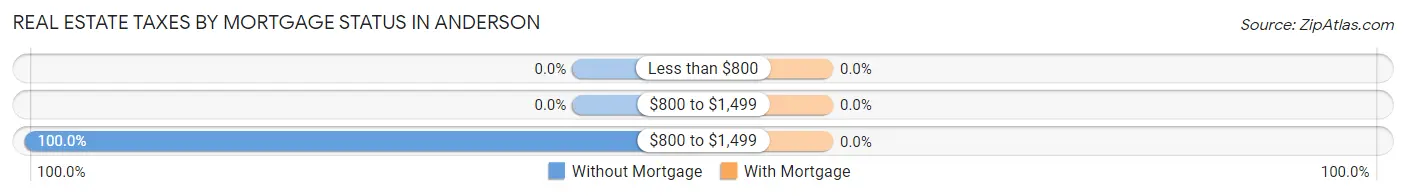
| Property Taxes | Without Mortgage | With Mortgage |
| Less than $800 | 0 (0.0%) | 0 (0.0%) |
| $800 to $1,499 | 0 (0.0%) | 0 (0.0%) |
| $800 to $1,499 | 53 (100.0%) | 0 (0.0%) |
| Total | 53 (100.0%) | 68 (100.0%) |
Health & Disability in Anderson
Health Insurance Coverage by Age in Anderson
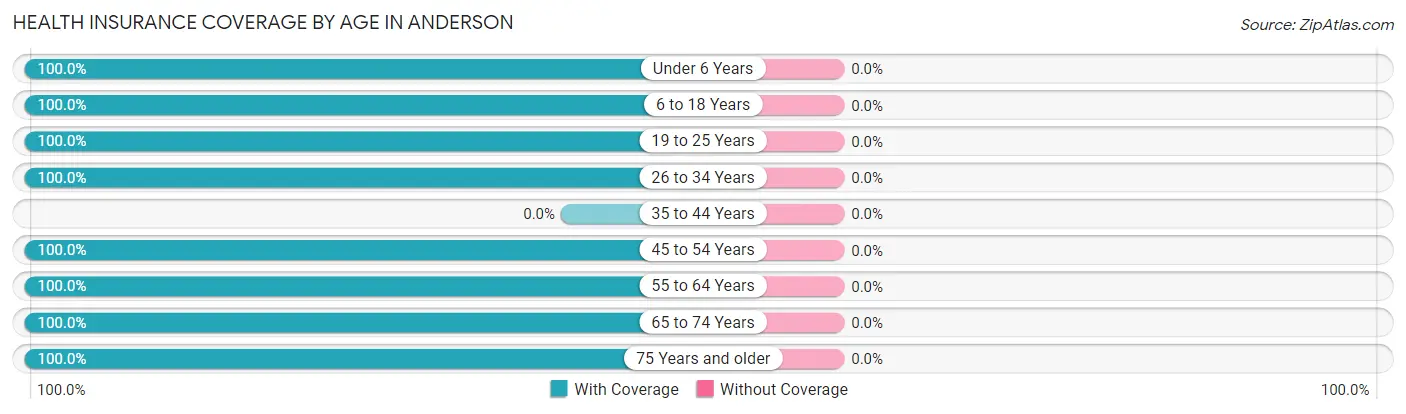
| Age Bracket | With Coverage | Without Coverage |
| Under 6 Years | 17 (100.0%) | 0 (0.0%) |
| 6 to 18 Years | 72 (100.0%) | 0 (0.0%) |
| 19 to 25 Years | 58 (100.0%) | 0 (0.0%) |
| 26 to 34 Years | 9 (100.0%) | 0 (0.0%) |
| 35 to 44 Years | 0 (0.0%) | 0 (0.0%) |
| 45 to 54 Years | 108 (100.0%) | 0 (0.0%) |
| 55 to 64 Years | 86 (100.0%) | 0 (0.0%) |
| 65 to 74 Years | 11 (100.0%) | 0 (0.0%) |
| 75 Years and older | 57 (100.0%) | 0 (0.0%) |
| Total | 418 (100.0%) | 0 (0.0%) |
Health Insurance Coverage by Citizenship Status in Anderson
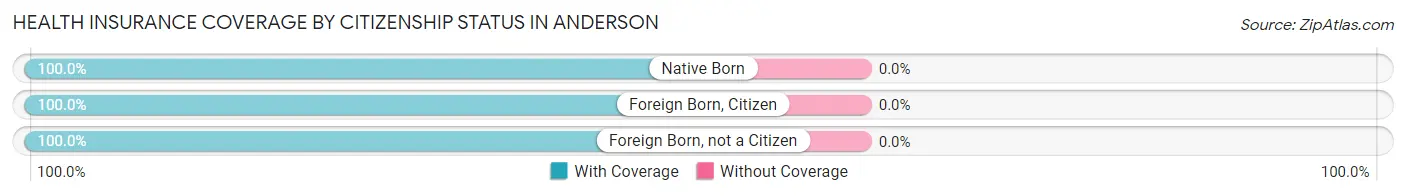
| Citizenship Status | With Coverage | Without Coverage |
| Native Born | 17 (100.0%) | 0 (0.0%) |
| Foreign Born, Citizen | 72 (100.0%) | 0 (0.0%) |
| Foreign Born, not a Citizen | 58 (100.0%) | 0 (0.0%) |
Health Insurance Coverage by Household Income in Anderson
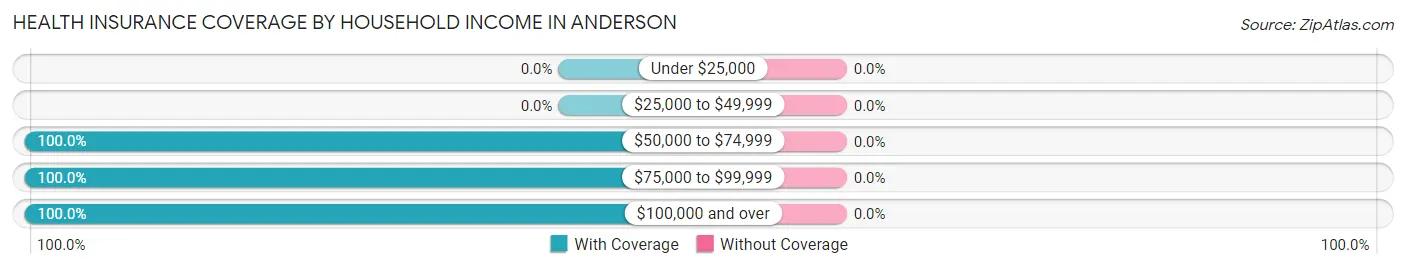
| Household Income | With Coverage | Without Coverage |
| Under $25,000 | 0 (0.0%) | 0 (0.0%) |
| $25,000 to $49,999 | 0 (0.0%) | 0 (0.0%) |
| $50,000 to $74,999 | 31 (100.0%) | 0 (0.0%) |
| $75,000 to $99,999 | 15 (100.0%) | 0 (0.0%) |
| $100,000 and over | 372 (100.0%) | 0 (0.0%) |
Public vs Private Health Insurance Coverage by Age in Anderson
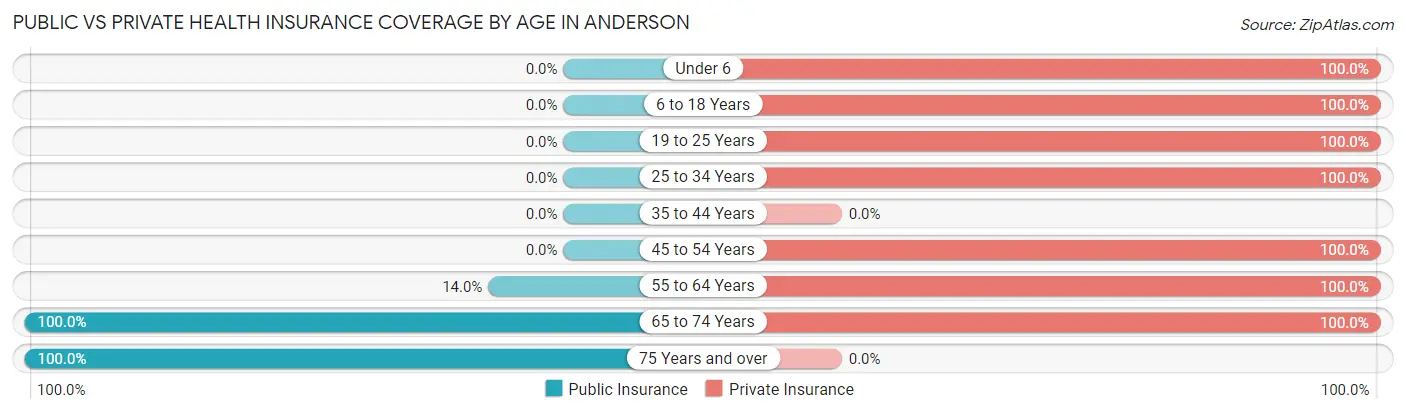
| Age Bracket | Public Insurance | Private Insurance |
| Under 6 | 0 (0.0%) | 17 (100.0%) |
| 6 to 18 Years | 0 (0.0%) | 72 (100.0%) |
| 19 to 25 Years | 0 (0.0%) | 58 (100.0%) |
| 25 to 34 Years | 0 (0.0%) | 9 (100.0%) |
| 35 to 44 Years | 0 (0.0%) | 0 (0.0%) |
| 45 to 54 Years | 0 (0.0%) | 108 (100.0%) |
| 55 to 64 Years | 12 (14.0%) | 86 (100.0%) |
| 65 to 74 Years | 11 (100.0%) | 11 (100.0%) |
| 75 Years and over | 57 (100.0%) | 0 (0.0%) |
| Total | 80 (19.1%) | 361 (86.4%) |
Disability Status by Sex by Age in Anderson
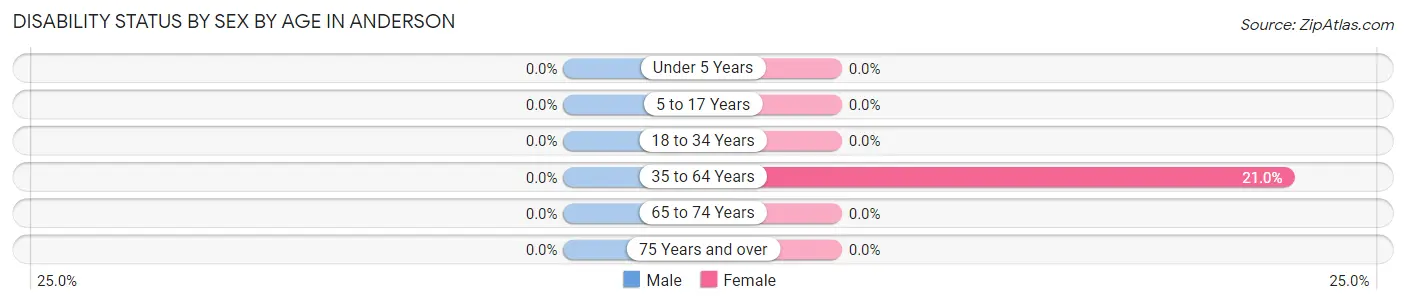
| Age Bracket | Male | Female |
| Under 5 Years | 0 (0.0%) | 0 (0.0%) |
| 5 to 17 Years | 0 (0.0%) | 0 (0.0%) |
| 18 to 34 Years | 0 (0.0%) | 0 (0.0%) |
| 35 to 64 Years | 0 (0.0%) | 21 (21.0%) |
| 65 to 74 Years | 0 (0.0%) | 0 (0.0%) |
| 75 Years and over | 0 (0.0%) | 0 (0.0%) |
Disability Class by Sex by Age in Anderson
Disability Class: Hearing Difficulty
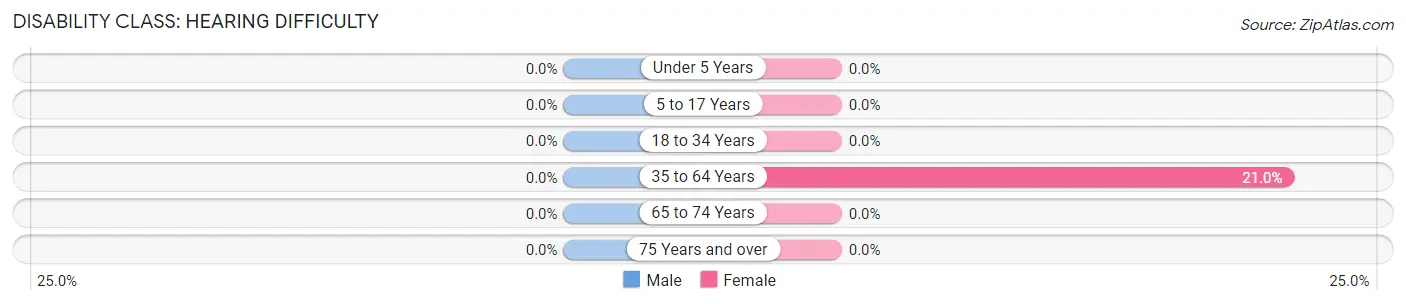
| Age Bracket | Male | Female |
| Under 5 Years | 0 (0.0%) | 0 (0.0%) |
| 5 to 17 Years | 0 (0.0%) | 0 (0.0%) |
| 18 to 34 Years | 0 (0.0%) | 0 (0.0%) |
| 35 to 64 Years | 0 (0.0%) | 21 (21.0%) |
| 65 to 74 Years | 0 (0.0%) | 0 (0.0%) |
| 75 Years and over | 0 (0.0%) | 0 (0.0%) |
Disability Class: Vision Difficulty
| Age Bracket | Male | Female |
| Under 5 Years | 0 (0.0%) | 0 (0.0%) |
| 5 to 17 Years | 0 (0.0%) | 0 (0.0%) |
| 18 to 34 Years | 0 (0.0%) | 0 (0.0%) |
| 35 to 64 Years | 0 (0.0%) | 0 (0.0%) |
| 65 to 74 Years | 0 (0.0%) | 0 (0.0%) |
| 75 Years and over | 0 (0.0%) | 0 (0.0%) |
Disability Class: Cognitive Difficulty
| Age Bracket | Male | Female |
| 5 to 17 Years | 0 (0.0%) | 0 (0.0%) |
| 18 to 34 Years | 0 (0.0%) | 0 (0.0%) |
| 35 to 64 Years | 0 (0.0%) | 0 (0.0%) |
| 65 to 74 Years | 0 (0.0%) | 0 (0.0%) |
| 75 Years and over | 0 (0.0%) | 0 (0.0%) |
Disability Class: Ambulatory Difficulty
| Age Bracket | Male | Female |
| 5 to 17 Years | 0 (0.0%) | 0 (0.0%) |
| 18 to 34 Years | 0 (0.0%) | 0 (0.0%) |
| 35 to 64 Years | 0 (0.0%) | 0 (0.0%) |
| 65 to 74 Years | 0 (0.0%) | 0 (0.0%) |
| 75 Years and over | 0 (0.0%) | 0 (0.0%) |
Disability Class: Self-Care Difficulty
| Age Bracket | Male | Female |
| 5 to 17 Years | 0 (0.0%) | 0 (0.0%) |
| 18 to 34 Years | 0 (0.0%) | 0 (0.0%) |
| 35 to 64 Years | 0 (0.0%) | 0 (0.0%) |
| 65 to 74 Years | 0 (0.0%) | 0 (0.0%) |
| 75 Years and over | 0 (0.0%) | 0 (0.0%) |
Technology Access in Anderson
Computing Device Access in Anderson
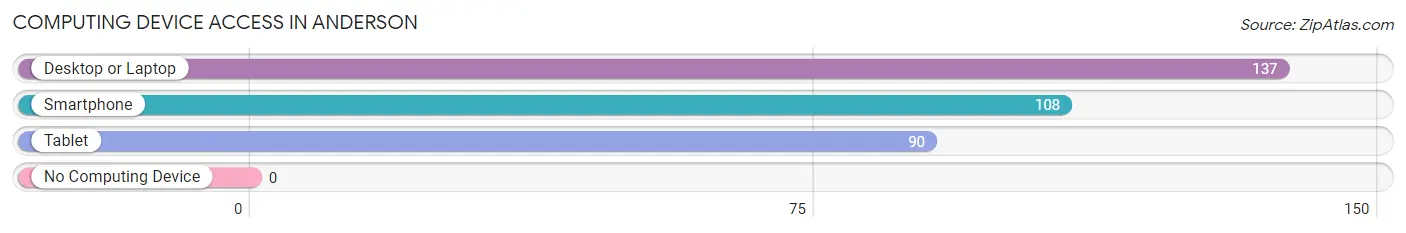
| Device Type | # Households | % Households |
| Desktop or Laptop | 137 | 100.0% |
| Smartphone | 108 | 78.8% |
| Tablet | 90 | 65.7% |
| No Computing Device | 0 | 0.0% |
| Total | 137 | 100.0% |
Internet Access in Anderson
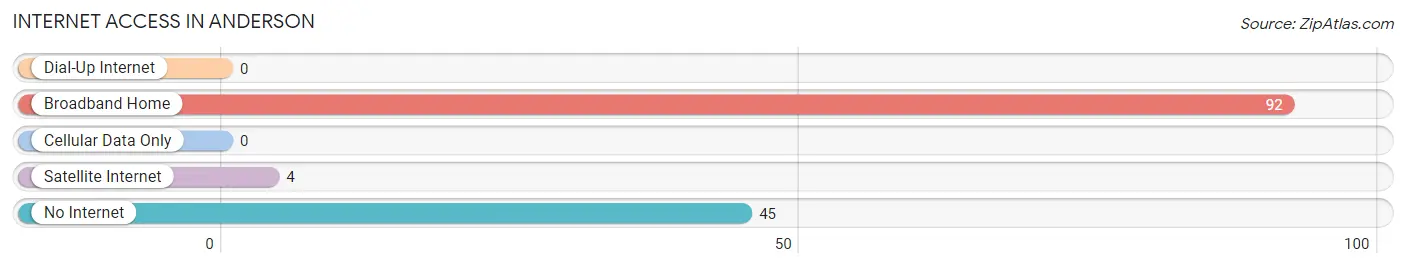
| Internet Type | # Households | % Households |
| Dial-Up Internet | 0 | 0.0% |
| Broadband Home | 92 | 67.1% |
| Cellular Data Only | 0 | 0.0% |
| Satellite Internet | 4 | 2.9% |
| No Internet | 45 | 32.9% |
| Total | 137 | 100.0% |
Anderson Summary
Anderson, South Dakota is a small city located in the southeastern corner of the state. It is the county seat of Hanson County and is part of the Sioux Falls Metropolitan Statistical Area. The city has a population of 1,845 people, according to the 2010 census.
Geography
Anderson is located in the southeastern corner of South Dakota, in the heart of the Great Plains. The city is situated on the banks of the Big Sioux River, which flows through the city and provides a source of recreation for the residents. The city is surrounded by rolling hills and prairies, and is located about 30 miles from the Minnesota border.
The climate in Anderson is typical of the Great Plains, with hot summers and cold winters. The average high temperature in July is 85 degrees Fahrenheit, and the average low temperature in January is 8 degrees Fahrenheit. The city receives an average of 22 inches of precipitation per year, with most of it falling in the spring and summer months.
Economy
The economy of Anderson is largely based on agriculture and manufacturing. The city is home to several large agricultural operations, including a large dairy farm and a large hog farm. The city also has several manufacturing plants, including a plant that produces plastic products and a plant that produces metal products.
The city also has a thriving retail sector, with several stores and restaurants located in the downtown area. The city also has a large number of service-based businesses, including a hospital, a bank, and several law firms.
Demographics
According to the 2010 census, the population of Anderson was 1,845 people. The racial makeup of the city was 95.3% White, 0.7% African American, 0.3% Native American, 0.2% Asian, 0.1% Pacific Islander, and 3.4% from other races. The median household income in Anderson was $41,944, and the median family income was $50,917.
The city has a large number of residents who are of German descent, and the city also has a large number of residents who are of Norwegian descent. The city also has a large number of residents who are of Irish descent.
Conclusion
Anderson, South Dakota is a small city located in the southeastern corner of the state. It is the county seat of Hanson County and is part of the Sioux Falls Metropolitan Statistical Area. The city has a population of 1,845 people, according to the 2010 census. The economy of Anderson is largely based on agriculture and manufacturing, and the city also has a thriving retail sector. The racial makeup of the city is mostly White, with a large number of residents who are of German, Norwegian, and Irish descent.
Common Questions
What is the Total Population of Anderson?
Total Population of Anderson is 418.
What is the Total Male Population of Anderson?
Total Male Population of Anderson is 197.
What is the Total Female Population of Anderson?
Total Female Population of Anderson is 221.
What is the Ratio of Males per 100 Females in Anderson?
There are 89.14 Males per 100 Females in Anderson.
What is the Ratio of Females per 100 Males in Anderson?
There are 112.18 Females per 100 Males in Anderson.
What is the Median Population Age in Anderson?
Median Population Age in Anderson is 51.9 Years.
What is the Average Family Size in Anderson
Average Family Size in Anderson is 3.2 People.
What is the Average Household Size in Anderson
Average Household Size in Anderson is 3.0 People.
What is Per Capita Income in Anderson?
Per Capita income in Anderson is $59,134.
What is the Median Family Income in Anderson?
Median Family Income in Anderson is $153,125.
What is the Median Household income in Anderson?
Median Household Income in Anderson is $137,109.
What is Inequality or Gini Index in Anderson?
Inequality or Gini Index in Anderson is 0.34.
How Large is the Labor Force in Anderson?
There are 260 People in the Labor Forcein in Anderson.
What is the Percentage of People in the Labor Force in Anderson?
73.7% of People are in the Labor Force in Anderson.