Miller, SD
Miller Map
Miller Overview
1,293
TOTAL POPULATION
629
MALE POPULATION
664
FEMALE POPULATION
94.73
MALES / 100 FEMALES
105.56
FEMALES / 100 MALES
49.3
MEDIAN AGE
2.6
AVG FAMILY SIZE
1.9
AVG HOUSEHOLD SIZE
$40,727
PER CAPITA INCOME
$92,644
AVG FAMILY INCOME
$59,063
AVG HOUSEHOLD INCOME
28.0%
WAGE / INCOME GAP [ % ]
72.0¢/ $1
WAGE / INCOME GAP [ $ ]
0.50
INEQUALITY / GINI INDEX
649
LABOR FORCE [ PEOPLE ]
60.5%
PERCENT IN LABOR FORCE
Miller Zip Codes
Miller Area Codes
Race in Miller
The most populous races in Miller are White / Caucasian (1,275 | 98.6%), Hispanic or Latino (19 | 1.5%), and Asian (7 | 0.5%).
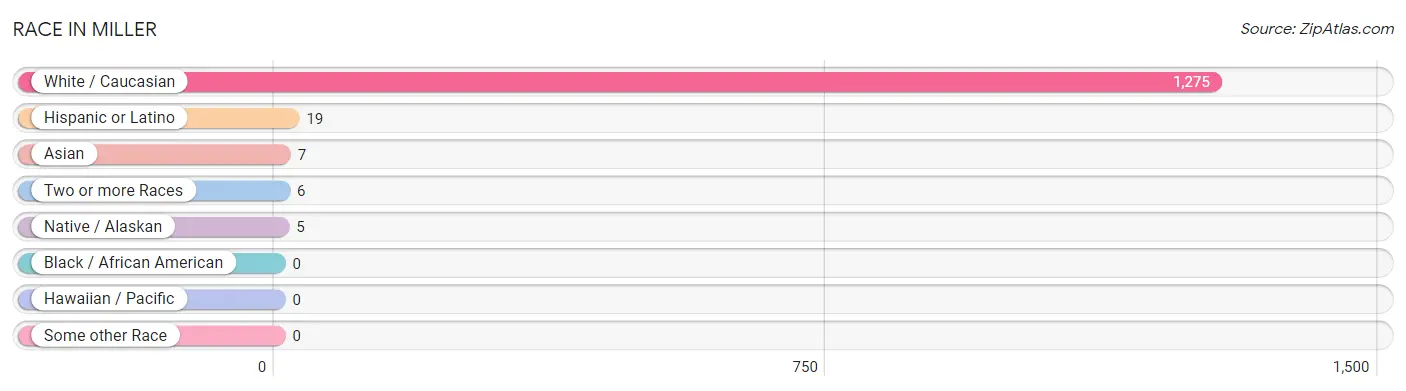
| Race | # Population | % Population |
| Asian | 7 | 0.5% |
| Black / African American | 0 | 0.0% |
| Hawaiian / Pacific | 0 | 0.0% |
| Hispanic or Latino | 19 | 1.5% |
| Native / Alaskan | 5 | 0.4% |
| White / Caucasian | 1,275 | 98.6% |
| Two or more Races | 6 | 0.5% |
| Some other Race | 0 | 0.0% |
| Total | 1,293 | 100.0% |
Ancestry in Miller
The most populous ancestries reported in Miller are German (639 | 49.4%), Irish (129 | 10.0%), English (123 | 9.5%), Norwegian (68 | 5.3%), and Danish (42 | 3.3%), together accounting for 77.4% of all Miller residents.
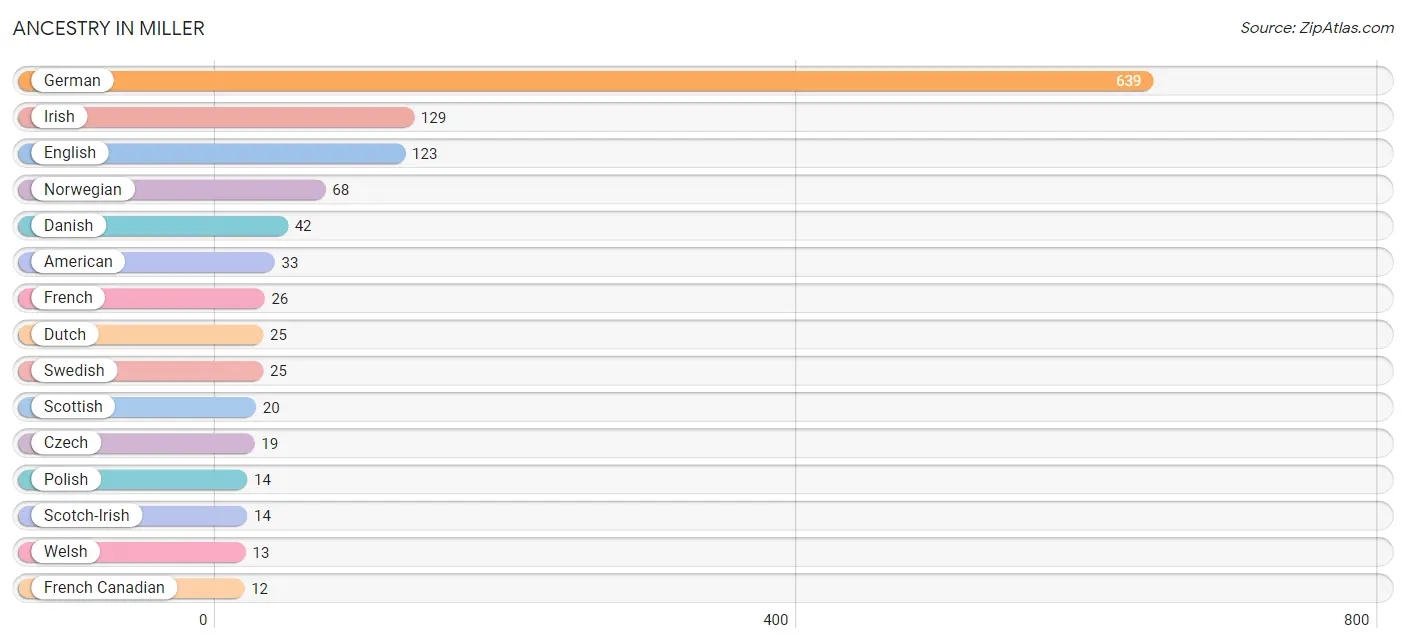
| Ancestry | # Population | % Population |
| American | 33 | 2.5% |
| Czech | 19 | 1.5% |
| Czechoslovakian | 7 | 0.5% |
| Danish | 42 | 3.3% |
| Dutch | 25 | 1.9% |
| English | 123 | 9.5% |
| European | 5 | 0.4% |
| French | 26 | 2.0% |
| French Canadian | 12 | 0.9% |
| German | 639 | 49.4% |
| Indian (Asian) | 7 | 0.5% |
| Irish | 129 | 10.0% |
| Italian | 12 | 0.9% |
| Mexican | 3 | 0.2% |
| Norwegian | 68 | 5.3% |
| Polish | 14 | 1.1% |
| Russian | 11 | 0.9% |
| Scandinavian | 10 | 0.8% |
| Scotch-Irish | 14 | 1.1% |
| Scottish | 20 | 1.5% |
| Swedish | 25 | 1.9% |
| Welsh | 13 | 1.0% | View All 22 Rows |
Immigrants in Miller
The most numerous immigrant groups reported in Miller came from Asia (7 | 0.5%), China (7 | 0.5%), Eastern Asia (7 | 0.5%), England (1 | 0.1%), and Europe (1 | 0.1%), together accounting for 1.8% of all Miller residents.
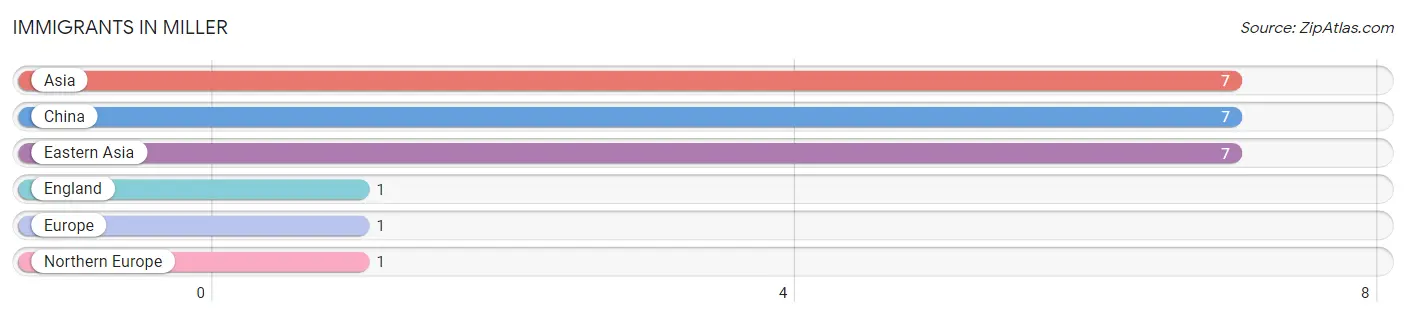
| Immigration Origin | # Population | % Population |
| Asia | 7 | 0.5% |
| China | 7 | 0.5% |
| Eastern Asia | 7 | 0.5% |
| England | 1 | 0.1% |
| Europe | 1 | 0.1% |
| Northern Europe | 1 | 0.1% | View All 6 Rows |
Sex and Age in Miller
Sex and Age in Miller
The most populous age groups in Miller are 60 to 64 Years (64 | 10.2%) for men and 10 to 14 Years (66 | 9.9%) for women.
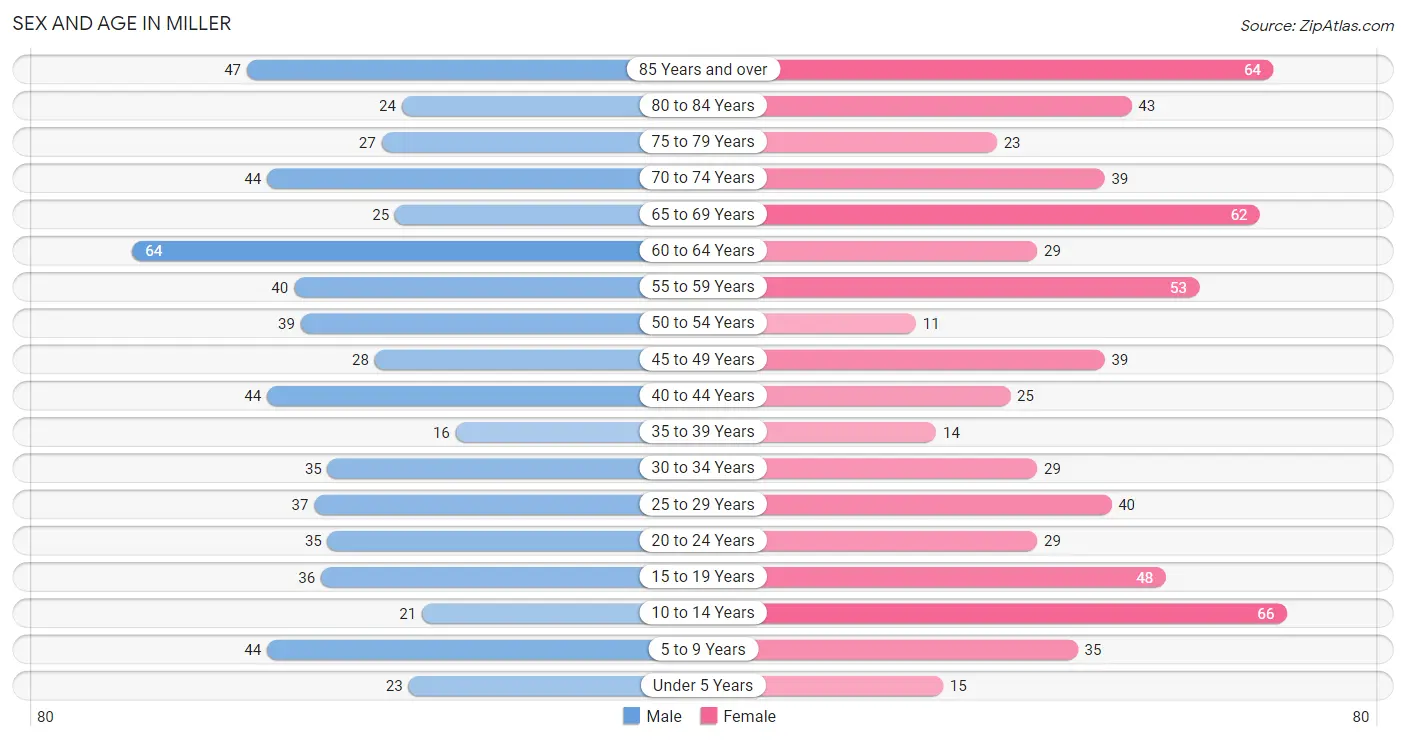
| Age Bracket | Male | Female |
| Under 5 Years | 23 (3.7%) | 15 (2.3%) |
| 5 to 9 Years | 44 (7.0%) | 35 (5.3%) |
| 10 to 14 Years | 21 (3.3%) | 66 (9.9%) |
| 15 to 19 Years | 36 (5.7%) | 48 (7.2%) |
| 20 to 24 Years | 35 (5.6%) | 29 (4.4%) |
| 25 to 29 Years | 37 (5.9%) | 40 (6.0%) |
| 30 to 34 Years | 35 (5.6%) | 29 (4.4%) |
| 35 to 39 Years | 16 (2.5%) | 14 (2.1%) |
| 40 to 44 Years | 44 (7.0%) | 25 (3.8%) |
| 45 to 49 Years | 28 (4.4%) | 39 (5.9%) |
| 50 to 54 Years | 39 (6.2%) | 11 (1.7%) |
| 55 to 59 Years | 40 (6.4%) | 53 (8.0%) |
| 60 to 64 Years | 64 (10.2%) | 29 (4.4%) |
| 65 to 69 Years | 25 (4.0%) | 62 (9.3%) |
| 70 to 74 Years | 44 (7.0%) | 39 (5.9%) |
| 75 to 79 Years | 27 (4.3%) | 23 (3.5%) |
| 80 to 84 Years | 24 (3.8%) | 43 (6.5%) |
| 85 Years and over | 47 (7.5%) | 64 (9.6%) |
| Total | 629 (100.0%) | 664 (100.0%) |
Families and Households in Miller
Median Family Size in Miller
The median family size in Miller is 2.62 persons per family, with single female/mother families (52 | 14.8%) accounting for the largest median family size of 3 persons per family. On the other hand, single male/father families (17 | 4.8%) represent the smallest median family size with 1.94 persons per family.
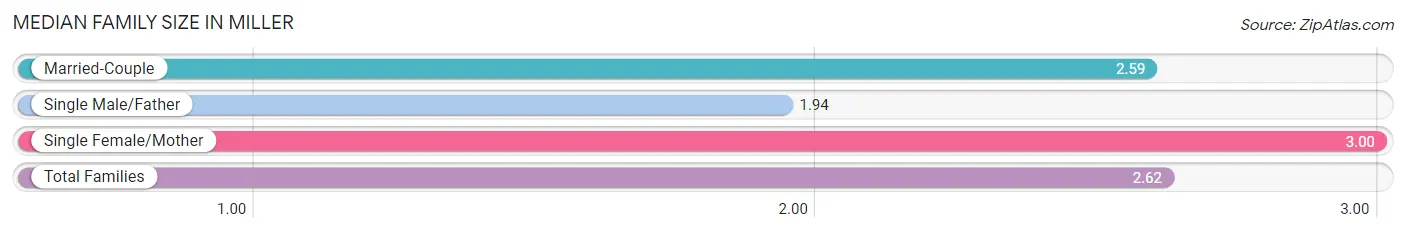
| Family Type | # Families | Family Size |
| Married-Couple | 282 (80.3%) | 2.59 |
| Single Male/Father | 17 (4.8%) | 1.94 |
| Single Female/Mother | 52 (14.8%) | 3.00 |
| Total Families | 351 (100.0%) | 2.62 |
Median Household Size in Miller
The median household size in Miller is 1.94 persons per household, with single female/mother households (52 | 8.3%) accounting for the largest median household size of 3.19 persons per household. non-family households (277 | 44.1%) represent the smallest median household size with 1.05 persons per household.
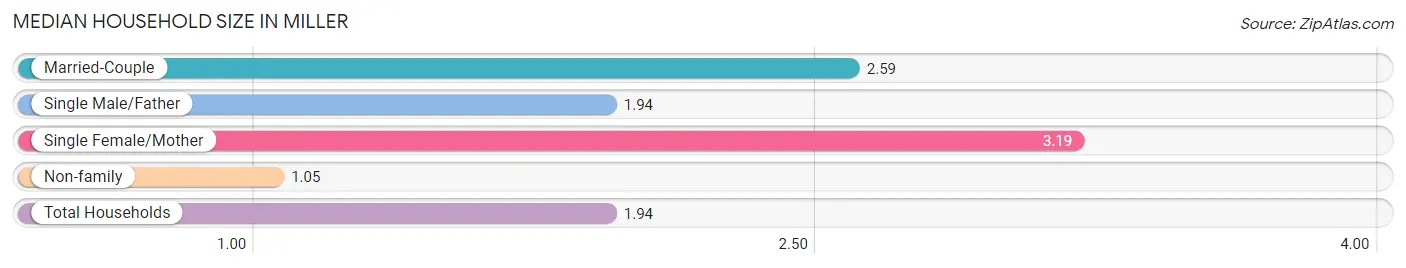
| Household Type | # Households | Household Size |
| Married-Couple | 282 (44.9%) | 2.59 |
| Single Male/Father | 17 (2.7%) | 1.94 |
| Single Female/Mother | 52 (8.3%) | 3.19 |
| Non-family | 277 (44.1%) | 1.05 |
| Total Households | 628 (100.0%) | 1.94 |
Household Size by Marriage Status in Miller
Out of a total of 628 households in Miller, 351 (55.9%) are family households, while 277 (44.1%) are nonfamily households. The most numerous type of family households are 2-person households, comprising 222, and the most common type of nonfamily households are 1-person households, comprising 244.
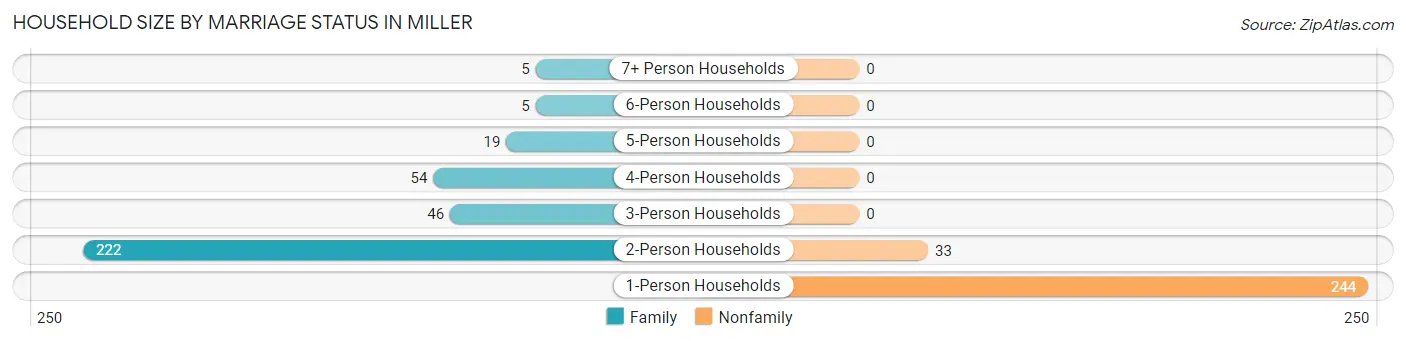
| Household Size | Family Households | Nonfamily Households |
| 1-Person Households | - | 244 (38.9%) |
| 2-Person Households | 222 (35.3%) | 33 (5.2%) |
| 3-Person Households | 46 (7.3%) | 0 (0.0%) |
| 4-Person Households | 54 (8.6%) | 0 (0.0%) |
| 5-Person Households | 19 (3.0%) | 0 (0.0%) |
| 6-Person Households | 5 (0.8%) | 0 (0.0%) |
| 7+ Person Households | 5 (0.8%) | 0 (0.0%) |
| Total | 351 (55.9%) | 277 (44.1%) |
Female Fertility in Miller
Fertility by Age in Miller
Average fertility rate in Miller is 43.0 births per 1,000 women. Women in the age bracket of 20 to 34 years have the highest fertility rate with 71.0 births per 1,000 women. Women in the age bracket of 20 to 34 years acount for 70.0% of all women with births.
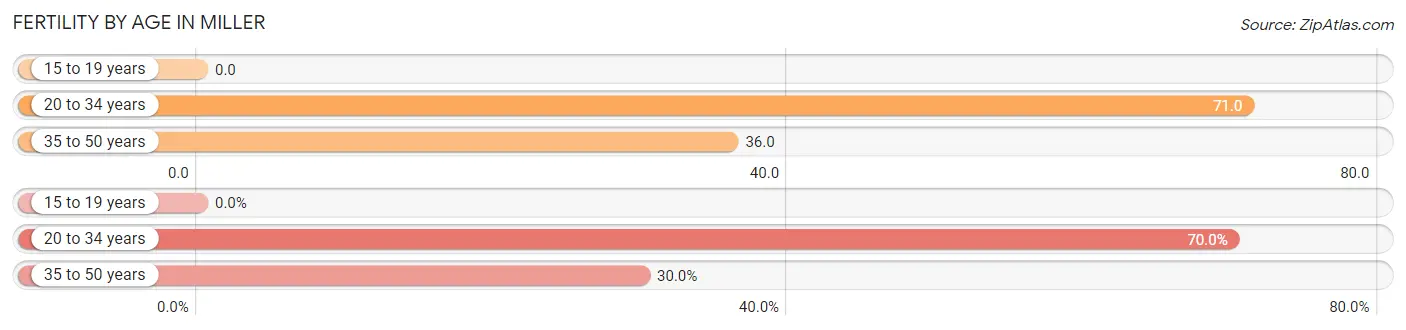
| Age Bracket | Women with Births | Births / 1,000 Women |
| 15 to 19 years | 0 (0.0%) | 0.0 |
| 20 to 34 years | 7 (70.0%) | 71.0 |
| 35 to 50 years | 3 (30.0%) | 36.0 |
| Total | 10 (100.0%) | 43.0 |
Fertility by Age by Marriage Status in Miller
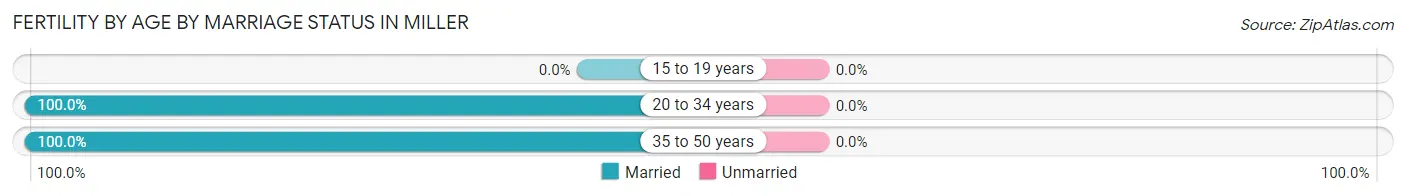
| Age Bracket | Married | Unmarried |
| 15 to 19 years | 0 (0.0%) | 0 (0.0%) |
| 20 to 34 years | 7 (100.0%) | 0 (0.0%) |
| 35 to 50 years | 3 (100.0%) | 0 (0.0%) |
| Total | 10 (100.0%) | 0 (0.0%) |
Fertility by Education in Miller
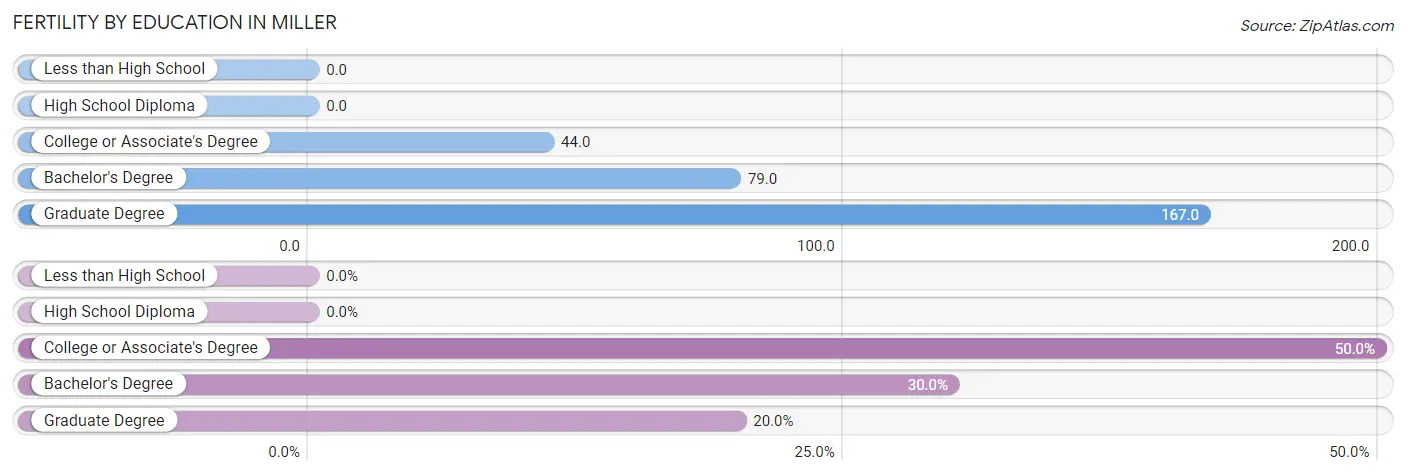
| Educational Attainment | Women with Births | Births / 1,000 Women |
| Less than High School | 0 (0.0%) | 0.0 |
| High School Diploma | 0 (0.0%) | 0.0 |
| College or Associate's Degree | 5 (50.0%) | 44.0 |
| Bachelor's Degree | 3 (30.0%) | 79.0 |
| Graduate Degree | 2 (20.0%) | 167.0 |
| Total | 10 (100.0%) | 43.0 |
Fertility by Education by Marriage Status in Miller
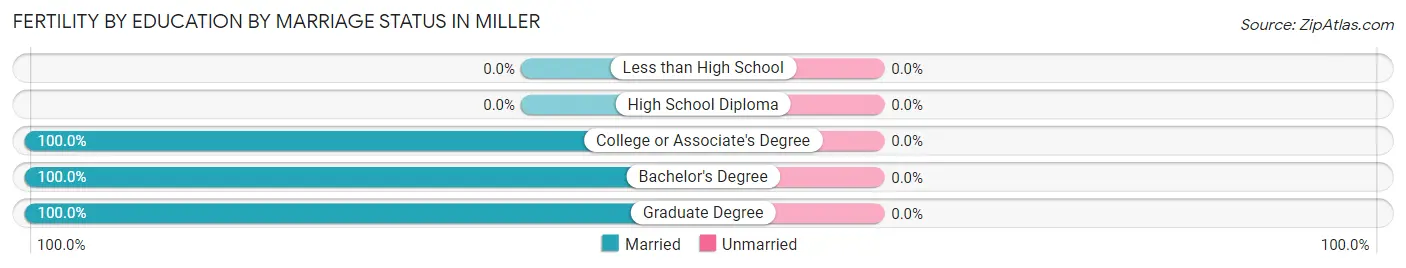
| Educational Attainment | Married | Unmarried |
| Less than High School | 0 (0.0%) | 0 (0.0%) |
| High School Diploma | 0 (0.0%) | 0 (0.0%) |
| College or Associate's Degree | 5 (100.0%) | 0 (0.0%) |
| Bachelor's Degree | 3 (100.0%) | 0 (0.0%) |
| Graduate Degree | 2 (100.0%) | 0 (0.0%) |
| Total | 10 (100.0%) | 0 (0.0%) |
Income in Miller
Income Overview in Miller
Per Capita Income in Miller is $40,727, while median incomes of families and households are $92,644 and $59,063 respectively.
| Characteristic | Number | Measure |
| Per Capita Income | 1,293 | $40,727 |
| Median Family Income | 351 | $92,644 |
| Mean Family Income | 351 | $91,189 |
| Median Household Income | 628 | $59,063 |
| Mean Household Income | 628 | $84,280 |
| Income Deficit | 351 | $0 |
| Wage / Income Gap (%) | 1,293 | 28.01% |
| Wage / Income Gap ($) | 1,293 | 71.99¢ per $1 |
| Gini / Inequality Index | 1,293 | 0.50 |
Earnings by Sex in Miller
Average Earnings in Miller are $38,939, $45,724 for men and $32,917 for women, a difference of 28.0%.
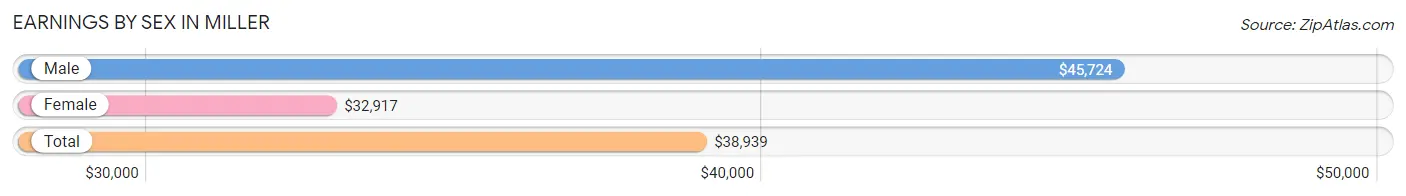
| Sex | Number | Average Earnings |
| Male | 377 (55.3%) | $45,724 |
| Female | 305 (44.7%) | $32,917 |
| Total | 682 (100.0%) | $38,939 |
Earnings by Sex by Income Bracket in Miller
The most common earnings brackets in Miller are $65,000 to $74,999 for men (57 | 15.1%) and $40,000 to $44,999 for women (33 | 10.8%).
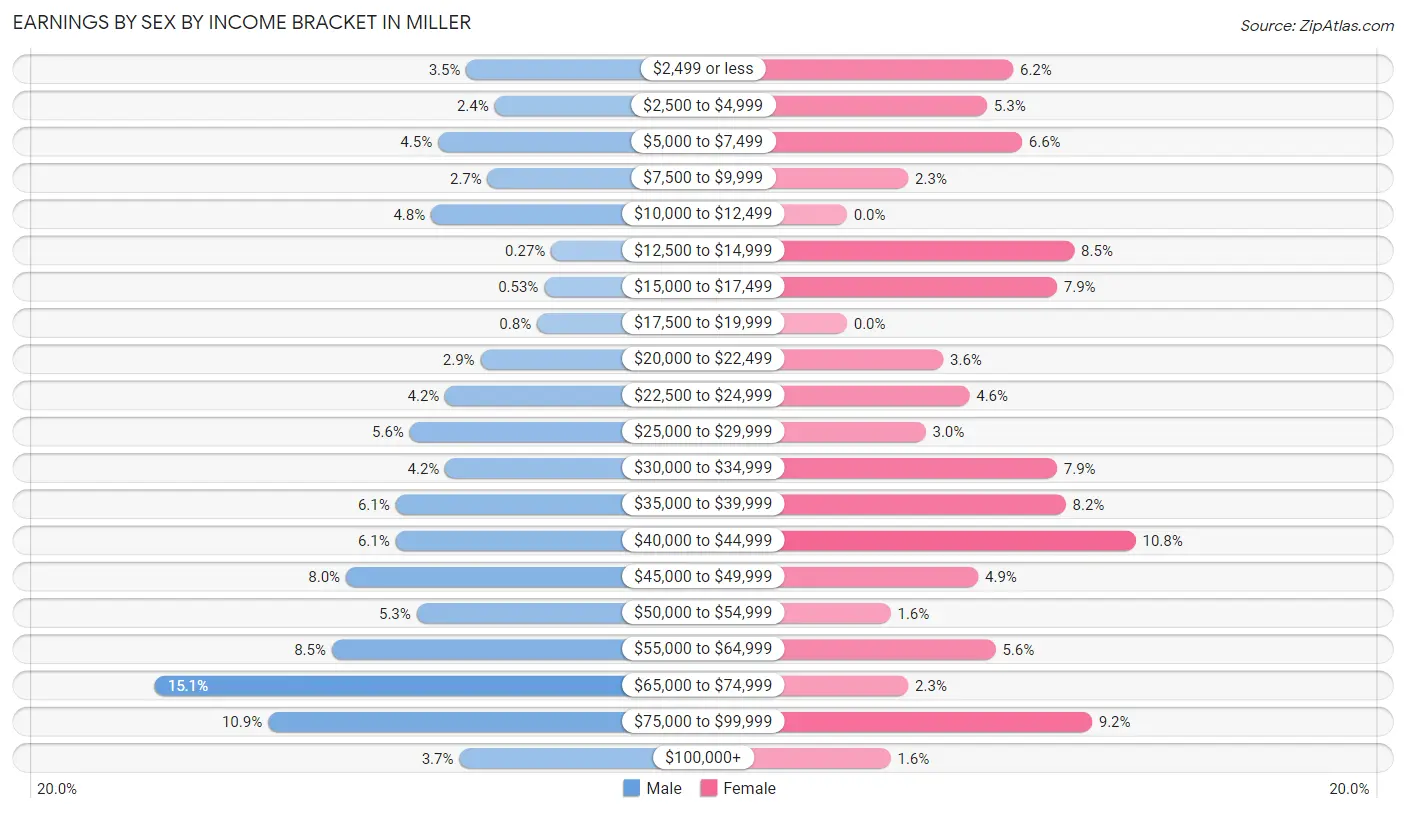
| Income | Male | Female |
| $2,499 or less | 13 (3.5%) | 19 (6.2%) |
| $2,500 to $4,999 | 9 (2.4%) | 16 (5.2%) |
| $5,000 to $7,499 | 17 (4.5%) | 20 (6.6%) |
| $7,500 to $9,999 | 10 (2.6%) | 7 (2.3%) |
| $10,000 to $12,499 | 18 (4.8%) | 0 (0.0%) |
| $12,500 to $14,999 | 1 (0.3%) | 26 (8.5%) |
| $15,000 to $17,499 | 2 (0.5%) | 24 (7.9%) |
| $17,500 to $19,999 | 3 (0.8%) | 0 (0.0%) |
| $20,000 to $22,499 | 11 (2.9%) | 11 (3.6%) |
| $22,500 to $24,999 | 16 (4.2%) | 14 (4.6%) |
| $25,000 to $29,999 | 21 (5.6%) | 9 (2.9%) |
| $30,000 to $34,999 | 16 (4.2%) | 24 (7.9%) |
| $35,000 to $39,999 | 23 (6.1%) | 25 (8.2%) |
| $40,000 to $44,999 | 23 (6.1%) | 33 (10.8%) |
| $45,000 to $49,999 | 30 (8.0%) | 15 (4.9%) |
| $50,000 to $54,999 | 20 (5.3%) | 5 (1.6%) |
| $55,000 to $64,999 | 32 (8.5%) | 17 (5.6%) |
| $65,000 to $74,999 | 57 (15.1%) | 7 (2.3%) |
| $75,000 to $99,999 | 41 (10.9%) | 28 (9.2%) |
| $100,000+ | 14 (3.7%) | 5 (1.6%) |
| Total | 377 (100.0%) | 305 (100.0%) |
Earnings by Sex by Educational Attainment in Miller
Average earnings in Miller are $49,432 for men and $33,869 for women, a difference of 31.5%. Men with an educational attainment of less than high school enjoy the highest average annual earnings of $66,875, while those with high school diploma education earn the least with $41,964. Women with an educational attainment of bachelor's degree earn the most with the average annual earnings of $47,083, while those with high school diploma education have the smallest earnings of $23,929.
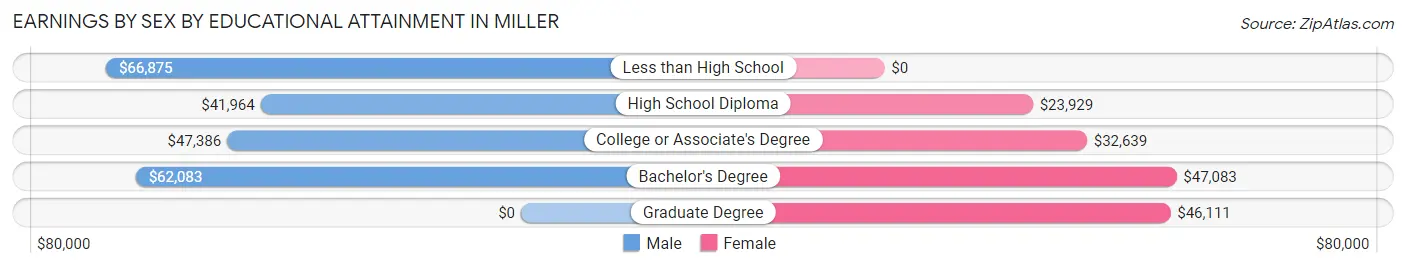
| Educational Attainment | Male Income | Female Income |
| Less than High School | $66,875 | $0 |
| High School Diploma | $41,964 | $23,929 |
| College or Associate's Degree | $47,386 | $32,639 |
| Bachelor's Degree | $62,083 | $47,083 |
| Graduate Degree | - | - |
| Total | $49,432 | $33,869 |
Family Income in Miller
Family Income Brackets in Miller
According to the Miller family income data, there are 90 families falling into the $100,000 to $149,999 income range, which is the most common income bracket and makes up 25.6% of all families.
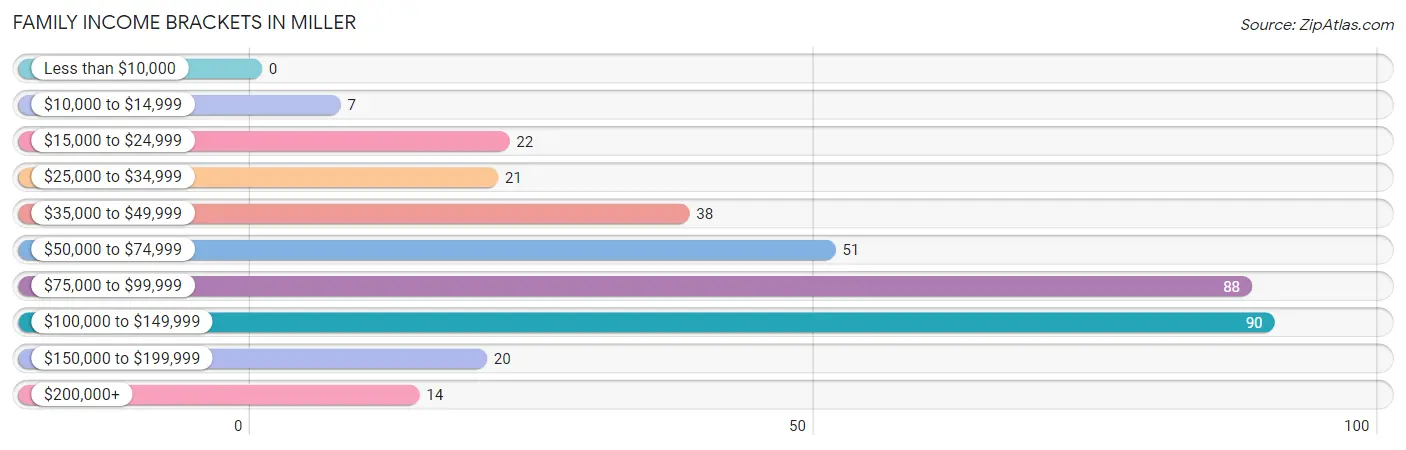
| Income Bracket | # Families | % Families |
| Less than $10,000 | 0 | 0.0% |
| $10,000 to $14,999 | 7 | 2.0% |
| $15,000 to $24,999 | 22 | 6.3% |
| $25,000 to $34,999 | 21 | 6.0% |
| $35,000 to $49,999 | 38 | 10.8% |
| $50,000 to $74,999 | 51 | 14.5% |
| $75,000 to $99,999 | 88 | 25.1% |
| $100,000 to $149,999 | 90 | 25.6% |
| $150,000 to $199,999 | 20 | 5.7% |
| $200,000+ | 14 | 4.0% |
Family Income by Famaliy Size in Miller
4-person families (54 | 15.4%) account for the highest median family income in Miller with $131,071 per family, while 2-person families (222 | 63.2%) have the highest median income of $45,875 per family member.
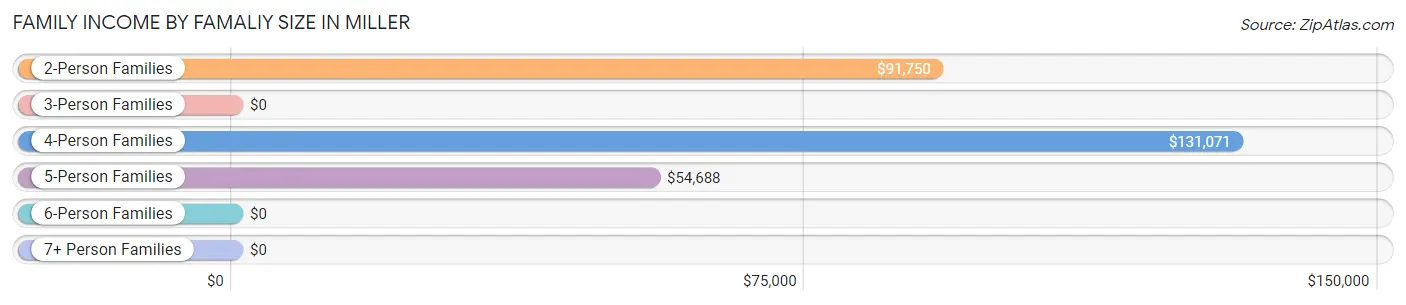
| Income Bracket | # Families | Median Income |
| 2-Person Families | 222 (63.2%) | $91,750 |
| 3-Person Families | 49 (14.0%) | $0 |
| 4-Person Families | 54 (15.4%) | $131,071 |
| 5-Person Families | 16 (4.6%) | $54,688 |
| 6-Person Families | 5 (1.4%) | $0 |
| 7+ Person Families | 5 (1.4%) | $0 |
| Total | 351 (100.0%) | $92,644 |
Family Income by Number of Earners in Miller
The median family income in Miller is $92,644, with families comprising 3+ earners (43) having the highest median family income of $131,250, while families with no earners (64) have the lowest median family income of $51,667, accounting for 12.2% and 18.2% of families, respectively.
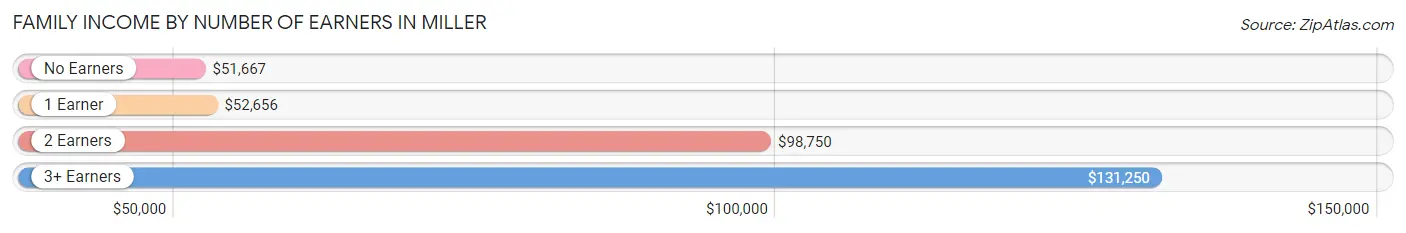
| Number of Earners | # Families | Median Income |
| No Earners | 64 (18.2%) | $51,667 |
| 1 Earner | 95 (27.1%) | $52,656 |
| 2 Earners | 149 (42.4%) | $98,750 |
| 3+ Earners | 43 (12.2%) | $131,250 |
| Total | 351 (100.0%) | $92,644 |
Household Income in Miller
Household Income Brackets in Miller
With 109 households falling in the category, the $100,000 to $149,999 income range is the most frequent in Miller, accounting for 17.4% of all households. In contrast, only 15 households (2.4%) fall into the less than $10,000 income bracket, making it the least populous group.
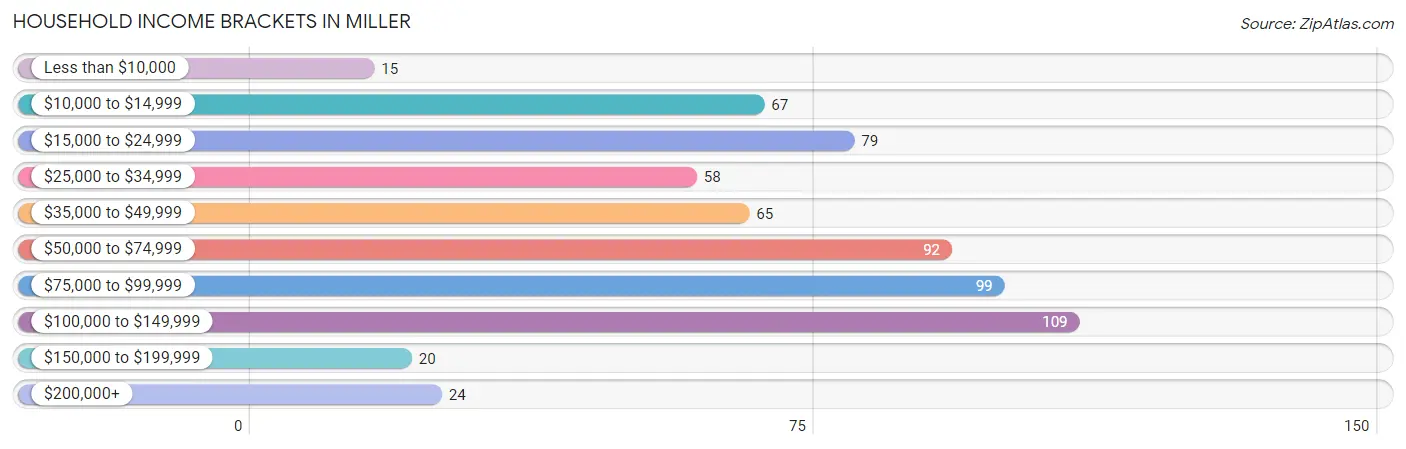
| Income Bracket | # Households | % Households |
| Less than $10,000 | 15 | 2.4% |
| $10,000 to $14,999 | 67 | 10.7% |
| $15,000 to $24,999 | 79 | 12.6% |
| $25,000 to $34,999 | 58 | 9.2% |
| $35,000 to $49,999 | 65 | 10.4% |
| $50,000 to $74,999 | 92 | 14.6% |
| $75,000 to $99,999 | 99 | 15.8% |
| $100,000 to $149,999 | 109 | 17.4% |
| $150,000 to $199,999 | 20 | 3.2% |
| $200,000+ | 24 | 3.8% |
Household Income by Householder Age in Miller
The median household income in Miller is $59,063, with the highest median household income of $87,708 found in the 25 to 44 years age bracket for the primary householder. A total of 139 households (22.1%) fall into this category. Meanwhile, the 15 to 24 years age bracket for the primary householder has the lowest median household income of $28,750, with 43 households (6.9%) in this group.
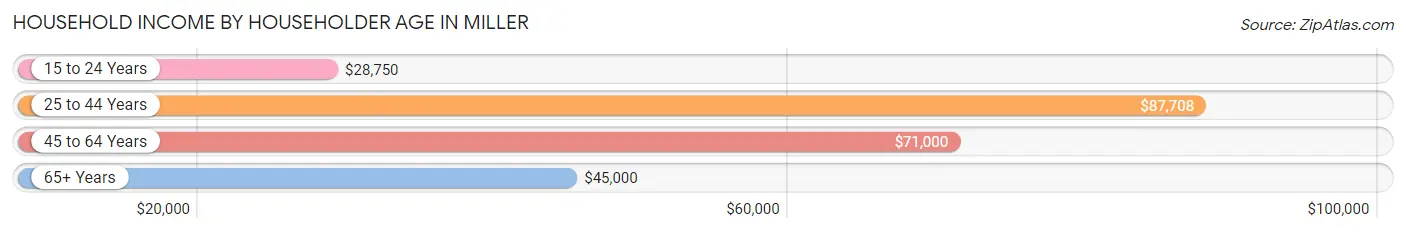
| Income Bracket | # Households | Median Income |
| 15 to 24 Years | 43 (6.9%) | $28,750 |
| 25 to 44 Years | 139 (22.1%) | $87,708 |
| 45 to 64 Years | 202 (32.2%) | $71,000 |
| 65+ Years | 244 (38.9%) | $45,000 |
| Total | 628 (100.0%) | $59,063 |
Poverty in Miller
Income Below Poverty by Sex and Age in Miller
With 7.1% poverty level for males and 8.7% for females among the residents of Miller, 75 year old and over males and 45 to 54 year old females are the most vulnerable to poverty, with 19 males (21.3%) and 16 females (32.0%) in their respective age groups living below the poverty level.
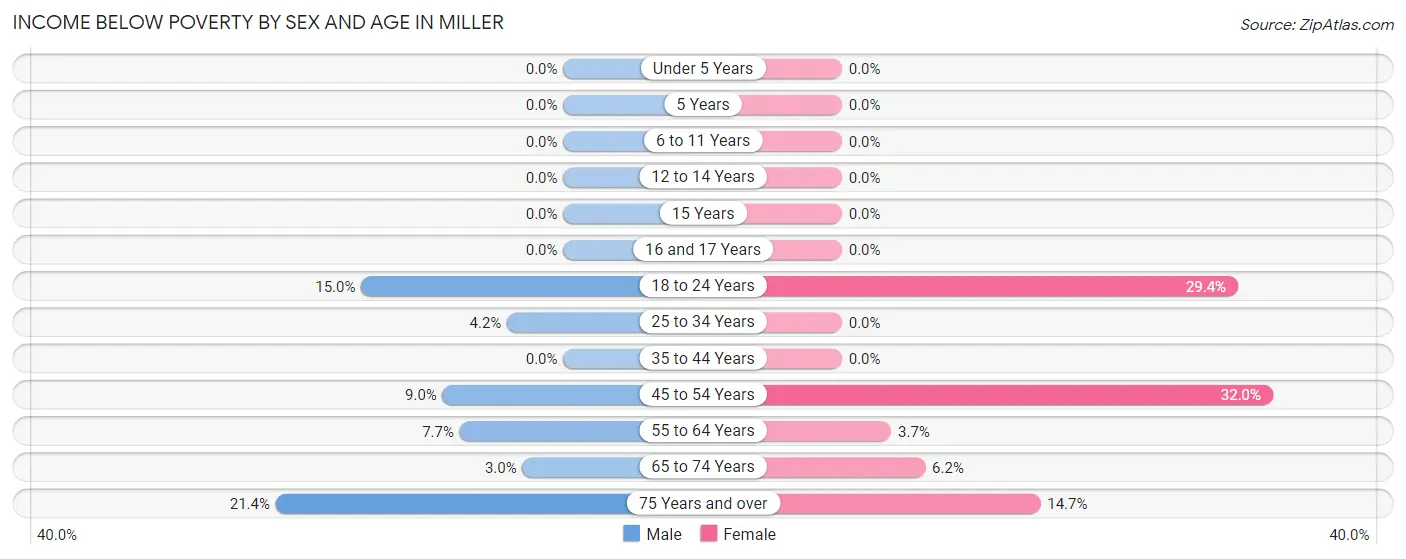
| Age Bracket | Male | Female |
| Under 5 Years | 0 (0.0%) | 0 (0.0%) |
| 5 Years | 0 (0.0%) | 0 (0.0%) |
| 6 to 11 Years | 0 (0.0%) | 0 (0.0%) |
| 12 to 14 Years | 0 (0.0%) | 0 (0.0%) |
| 15 Years | 0 (0.0%) | 0 (0.0%) |
| 16 and 17 Years | 0 (0.0%) | 0 (0.0%) |
| 18 to 24 Years | 6 (15.0%) | 15 (29.4%) |
| 25 to 34 Years | 3 (4.2%) | 0 (0.0%) |
| 35 to 44 Years | 0 (0.0%) | 0 (0.0%) |
| 45 to 54 Years | 6 (9.0%) | 16 (32.0%) |
| 55 to 64 Years | 8 (7.7%) | 3 (3.7%) |
| 65 to 74 Years | 2 (3.0%) | 6 (6.2%) |
| 75 Years and over | 19 (21.3%) | 14 (14.7%) |
| Total | 44 (7.1%) | 54 (8.7%) |
Income Above Poverty by Sex and Age in Miller
According to the poverty statistics in Miller, males aged under 5 years and females aged under 5 years are the age groups that are most secure financially, with 100.0% of males and 100.0% of females in these age groups living above the poverty line.
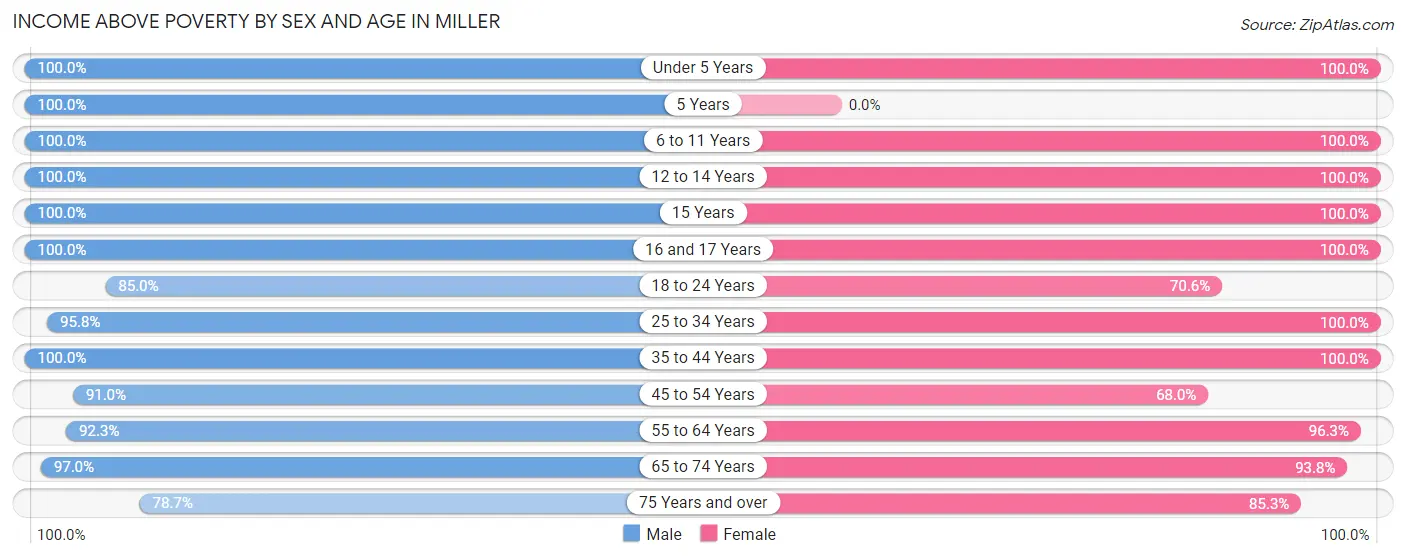
| Age Bracket | Male | Female |
| Under 5 Years | 23 (100.0%) | 15 (100.0%) |
| 5 Years | 5 (100.0%) | 0 (0.0%) |
| 6 to 11 Years | 41 (100.0%) | 81 (100.0%) |
| 12 to 14 Years | 19 (100.0%) | 14 (100.0%) |
| 15 Years | 7 (100.0%) | 9 (100.0%) |
| 16 and 17 Years | 24 (100.0%) | 17 (100.0%) |
| 18 to 24 Years | 34 (85.0%) | 36 (70.6%) |
| 25 to 34 Years | 69 (95.8%) | 69 (100.0%) |
| 35 to 44 Years | 60 (100.0%) | 39 (100.0%) |
| 45 to 54 Years | 61 (91.0%) | 34 (68.0%) |
| 55 to 64 Years | 96 (92.3%) | 79 (96.3%) |
| 65 to 74 Years | 64 (97.0%) | 91 (93.8%) |
| 75 Years and over | 70 (78.6%) | 81 (85.3%) |
| Total | 573 (92.9%) | 565 (91.3%) |
Income Below Poverty Among Married-Couple Families in Miller
The poverty statistics for married-couple families in Miller show that 2.8% or 8 of the total 282 families live below the poverty line. Families with no children have the highest poverty rate of 4.1%, comprising of 8 families. On the other hand, families with 1 or 2 children have the lowest poverty rate of 0.0%, which includes 0 families.
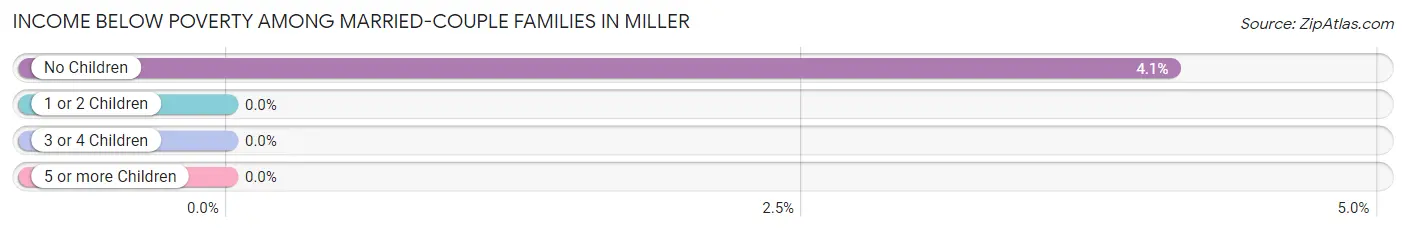
| Children | Above Poverty | Below Poverty |
| No Children | 187 (95.9%) | 8 (4.1%) |
| 1 or 2 Children | 62 (100.0%) | 0 (0.0%) |
| 3 or 4 Children | 20 (100.0%) | 0 (0.0%) |
| 5 or more Children | 5 (100.0%) | 0 (0.0%) |
| Total | 274 (97.2%) | 8 (2.8%) |
Income Below Poverty Among Single-Parent Households in Miller
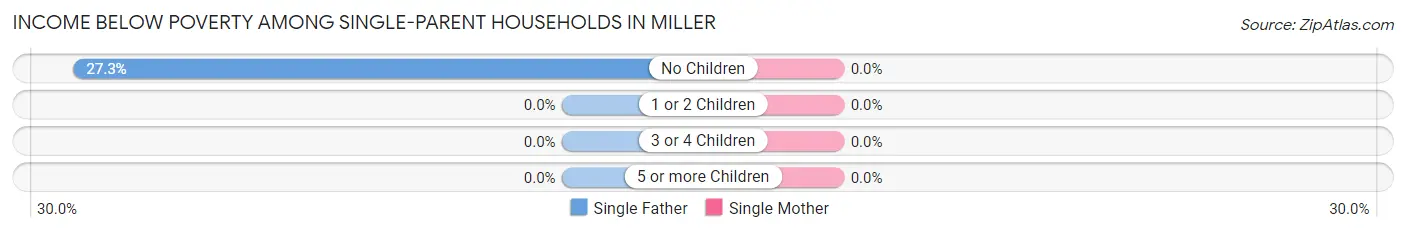
| Children | Single Father | Single Mother |
| No Children | 3 (27.3%) | 0 (0.0%) |
| 1 or 2 Children | 0 (0.0%) | 0 (0.0%) |
| 3 or 4 Children | 0 (0.0%) | 0 (0.0%) |
| 5 or more Children | 0 (0.0%) | 0 (0.0%) |
| Total | 3 (17.6%) | 0 (0.0%) |
Income Below Poverty Among Married-Couple vs Single-Parent Households in Miller
The poverty data for Miller shows that 8 of the married-couple family households (2.8%) and 3 of the single-parent households (4.3%) are living below the poverty level. Within the married-couple family households, those with no children have the highest poverty rate, with 8 households (4.1%) falling below the poverty line. Among the single-parent households, those with no children have the highest poverty rate, with 3 household (8.8%) living below poverty.
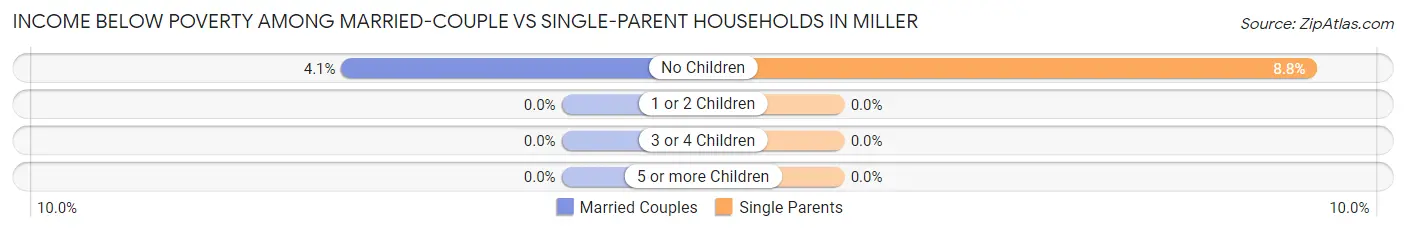
| Children | Married-Couple Families | Single-Parent Households |
| No Children | 8 (4.1%) | 3 (8.8%) |
| 1 or 2 Children | 0 (0.0%) | 0 (0.0%) |
| 3 or 4 Children | 0 (0.0%) | 0 (0.0%) |
| 5 or more Children | 0 (0.0%) | 0 (0.0%) |
| Total | 8 (2.8%) | 3 (4.3%) |
Employment Characteristics in Miller
Employment by Class of Employer in Miller
Among the 642 employed individuals in Miller, private company employees (401 | 62.5%), local government employees (91 | 14.2%), and not-for-profit organizations (65 | 10.1%) make up the most common classes of employment.
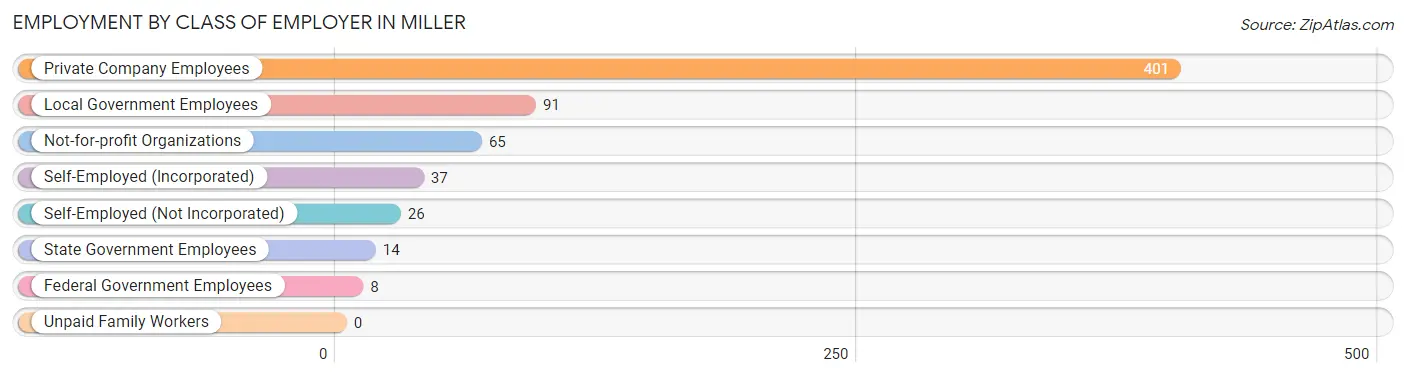
| Employer Class | # Employees | % Employees |
| Private Company Employees | 401 | 62.5% |
| Self-Employed (Incorporated) | 37 | 5.8% |
| Self-Employed (Not Incorporated) | 26 | 4.1% |
| Not-for-profit Organizations | 65 | 10.1% |
| Local Government Employees | 91 | 14.2% |
| State Government Employees | 14 | 2.2% |
| Federal Government Employees | 8 | 1.3% |
| Unpaid Family Workers | 0 | 0.0% |
| Total | 642 | 100.0% |
Employment Status by Age in Miller
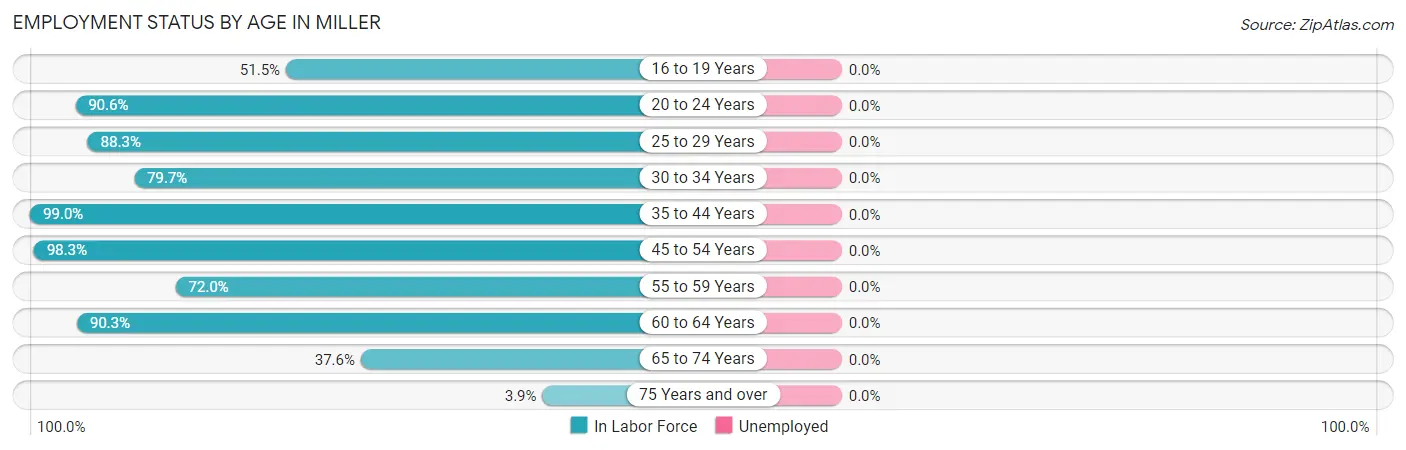
| Age Bracket | In Labor Force | Unemployed |
| 16 to 19 Years | 35 (51.5%) | 0 (0.0%) |
| 20 to 24 Years | 58 (90.6%) | 0 (0.0%) |
| 25 to 29 Years | 68 (88.3%) | 0 (0.0%) |
| 30 to 34 Years | 51 (79.7%) | 0 (0.0%) |
| 35 to 44 Years | 98 (99.0%) | 0 (0.0%) |
| 45 to 54 Years | 115 (98.3%) | 0 (0.0%) |
| 55 to 59 Years | 67 (72.0%) | 0 (0.0%) |
| 60 to 64 Years | 84 (90.3%) | 0 (0.0%) |
| 65 to 74 Years | 64 (37.6%) | 0 (0.0%) |
| 75 Years and over | 9 (3.9%) | 0 (0.0%) |
| Total | 649 (60.5%) | 0 (0.0%) |
Employment Status by Educational Attainment in Miller
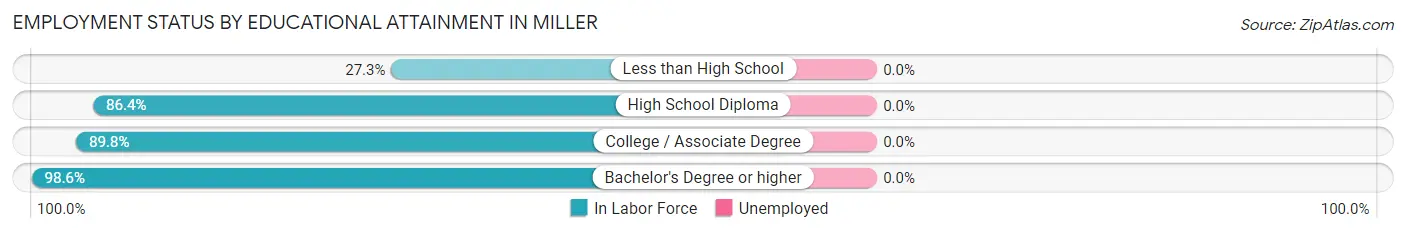
| Educational Attainment | In Labor Force | Unemployed |
| Less than High School | 6 (27.3%) | 0 (0.0%) |
| High School Diploma | 102 (86.4%) | 0 (0.0%) |
| College / Associate Degree | 229 (89.8%) | 0 (0.0%) |
| Bachelor's Degree or higher | 146 (98.6%) | 0 (0.0%) |
| Total | 483 (89.0%) | 0 (0.0%) |
Employment Occupations by Sex in Miller
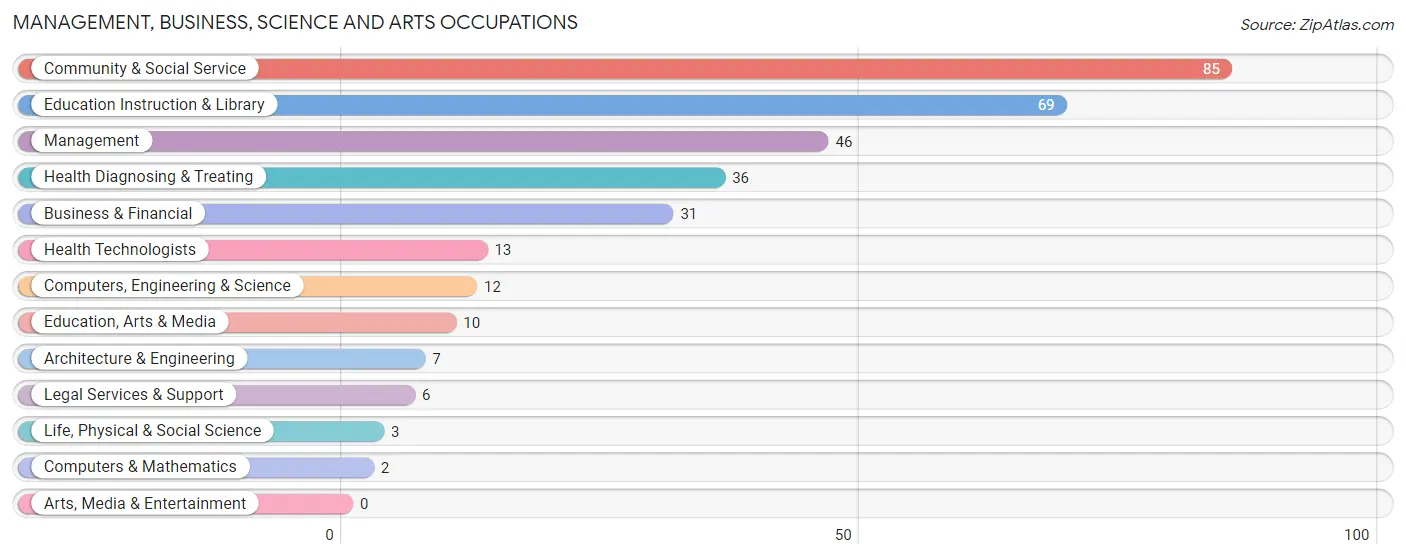
Management, Business, Science and Arts Occupations
The most common Management, Business, Science and Arts occupations in Miller are Community & Social Service (85 | 13.1%), Education Instruction & Library (69 | 10.7%), Management (46 | 7.1%), Health Diagnosing & Treating (36 | 5.6%), and Business & Financial (31 | 4.8%).
Management, Business, Science and Arts Occupations by Sex
Within the Management, Business, Science and Arts occupations in Miller, the most male-oriented occupations are Computers & Mathematics (100.0%), Architecture & Engineering (100.0%), and Management (95.7%), while the most female-oriented occupations are Life, Physical & Social Science (100.0%), Health Diagnosing & Treating (94.4%), and Health Technologists (84.6%).
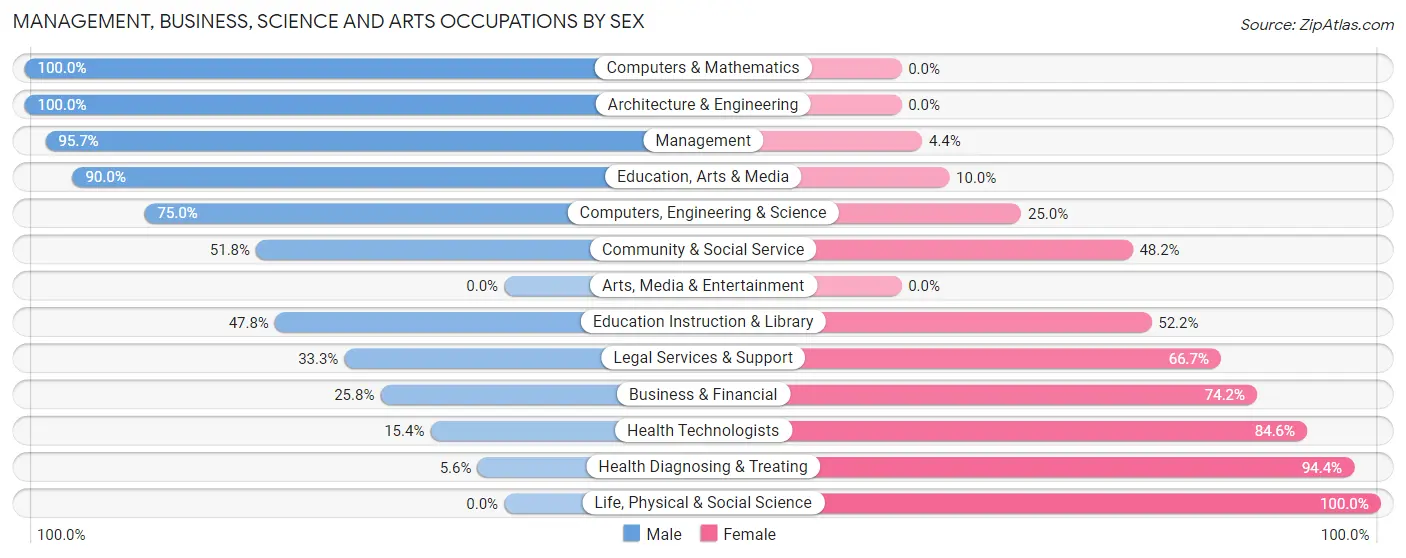
| Occupation | Male | Female |
| Management | 44 (95.7%) | 2 (4.3%) |
| Business & Financial | 8 (25.8%) | 23 (74.2%) |
| Computers, Engineering & Science | 9 (75.0%) | 3 (25.0%) |
| Computers & Mathematics | 2 (100.0%) | 0 (0.0%) |
| Architecture & Engineering | 7 (100.0%) | 0 (0.0%) |
| Life, Physical & Social Science | 0 (0.0%) | 3 (100.0%) |
| Community & Social Service | 44 (51.8%) | 41 (48.2%) |
| Education, Arts & Media | 9 (90.0%) | 1 (10.0%) |
| Legal Services & Support | 2 (33.3%) | 4 (66.7%) |
| Education Instruction & Library | 33 (47.8%) | 36 (52.2%) |
| Arts, Media & Entertainment | 0 (0.0%) | 0 (0.0%) |
| Health Diagnosing & Treating | 2 (5.6%) | 34 (94.4%) |
| Health Technologists | 2 (15.4%) | 11 (84.6%) |
| Total (Category) | 107 (50.9%) | 103 (49.0%) |
| Total (Overall) | 355 (54.9%) | 292 (45.1%) |
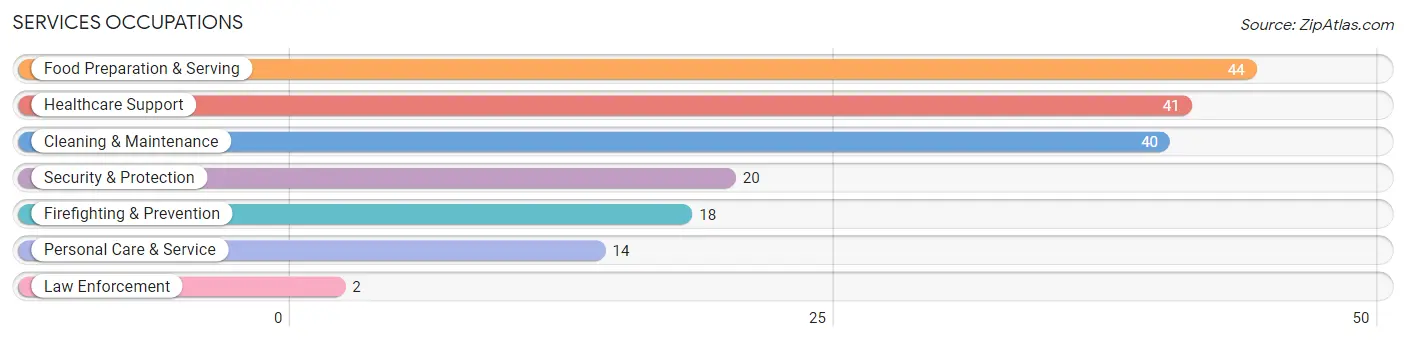
Services Occupations
The most common Services occupations in Miller are Food Preparation & Serving (44 | 6.8%), Healthcare Support (41 | 6.3%), Cleaning & Maintenance (40 | 6.2%), Security & Protection (20 | 3.1%), and Firefighting & Prevention (18 | 2.8%).
Services Occupations by Sex
Within the Services occupations in Miller, the most male-oriented occupations are Law Enforcement (100.0%), Security & Protection (65.0%), and Firefighting & Prevention (61.1%), while the most female-oriented occupations are Food Preparation & Serving (70.5%), Healthcare Support (65.8%), and Personal Care & Service (57.1%).
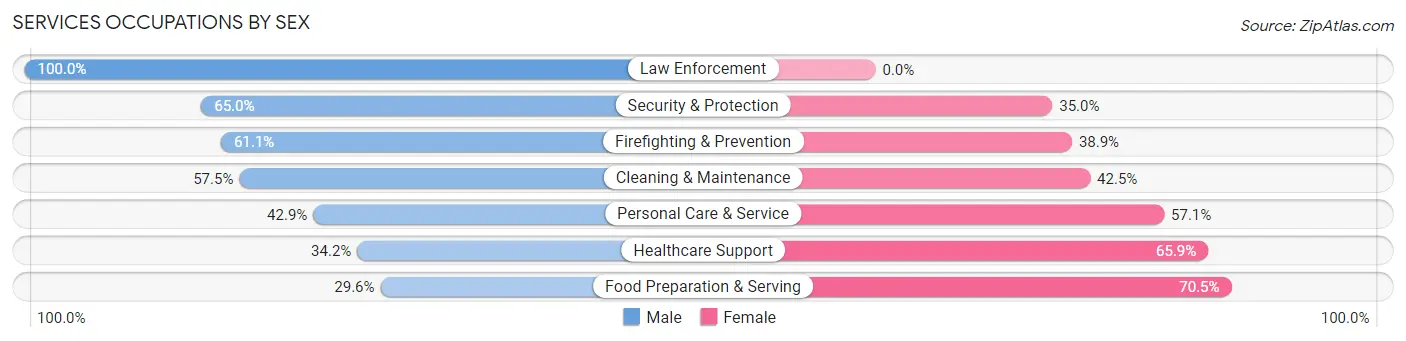
| Occupation | Male | Female |
| Healthcare Support | 14 (34.2%) | 27 (65.8%) |
| Security & Protection | 13 (65.0%) | 7 (35.0%) |
| Firefighting & Prevention | 11 (61.1%) | 7 (38.9%) |
| Law Enforcement | 2 (100.0%) | 0 (0.0%) |
| Food Preparation & Serving | 13 (29.5%) | 31 (70.5%) |
| Cleaning & Maintenance | 23 (57.5%) | 17 (42.5%) |
| Personal Care & Service | 6 (42.9%) | 8 (57.1%) |
| Total (Category) | 69 (43.4%) | 90 (56.6%) |
| Total (Overall) | 355 (54.9%) | 292 (45.1%) |
Sales and Office Occupations
The most common Sales and Office occupations in Miller are Office & Administration (77 | 11.9%), and Sales & Related (61 | 9.4%).
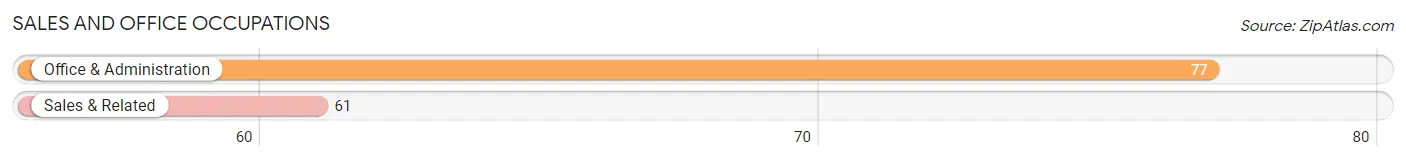
Sales and Office Occupations by Sex
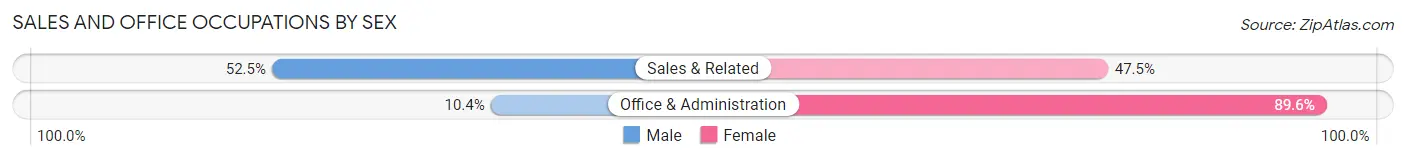
| Occupation | Male | Female |
| Sales & Related | 32 (52.5%) | 29 (47.5%) |
| Office & Administration | 8 (10.4%) | 69 (89.6%) |
| Total (Category) | 40 (29.0%) | 98 (71.0%) |
| Total (Overall) | 355 (54.9%) | 292 (45.1%) |
Natural Resources, Construction and Maintenance Occupations
The most common Natural Resources, Construction and Maintenance occupations in Miller are Installation, Maintenance & Repair (33 | 5.1%), Farming, Fishing & Forestry (27 | 4.2%), and Construction & Extraction (24 | 3.7%).
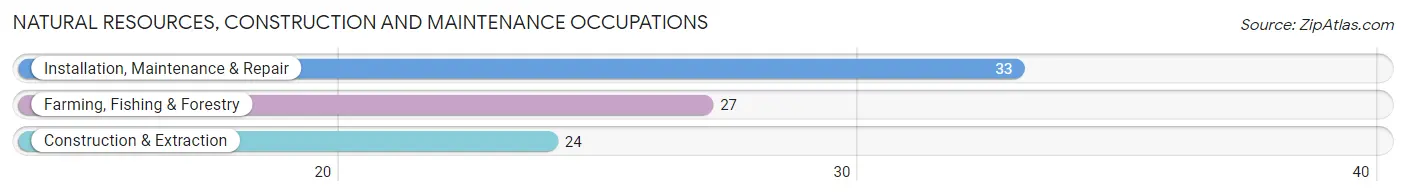
Natural Resources, Construction and Maintenance Occupations by Sex
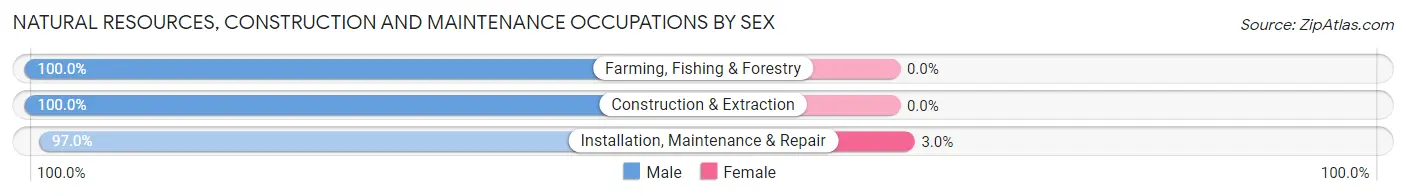
| Occupation | Male | Female |
| Farming, Fishing & Forestry | 27 (100.0%) | 0 (0.0%) |
| Construction & Extraction | 24 (100.0%) | 0 (0.0%) |
| Installation, Maintenance & Repair | 32 (97.0%) | 1 (3.0%) |
| Total (Category) | 83 (98.8%) | 1 (1.2%) |
| Total (Overall) | 355 (54.9%) | 292 (45.1%) |
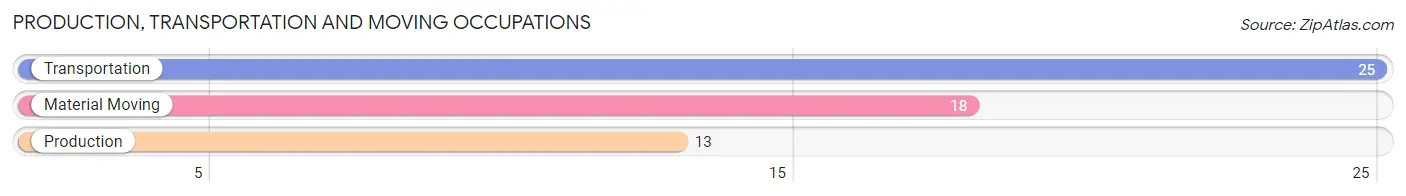
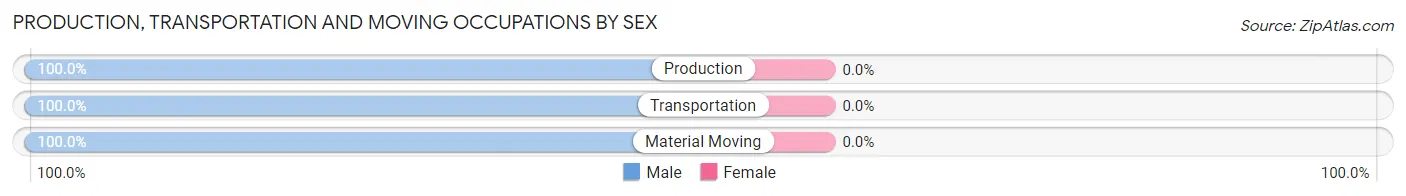
Production, Transportation and Moving Occupations
The most common Production, Transportation and Moving occupations in Miller are Transportation (25 | 3.9%), Material Moving (18 | 2.8%), and Production (13 | 2.0%).
Production, Transportation and Moving Occupations by Sex
| Occupation | Male | Female |
| Production | 13 (100.0%) | 0 (0.0%) |
| Transportation | 25 (100.0%) | 0 (0.0%) |
| Material Moving | 18 (100.0%) | 0 (0.0%) |
| Total (Category) | 56 (100.0%) | 0 (0.0%) |
| Total (Overall) | 355 (54.9%) | 292 (45.1%) |
Employment Industries by Sex in Miller
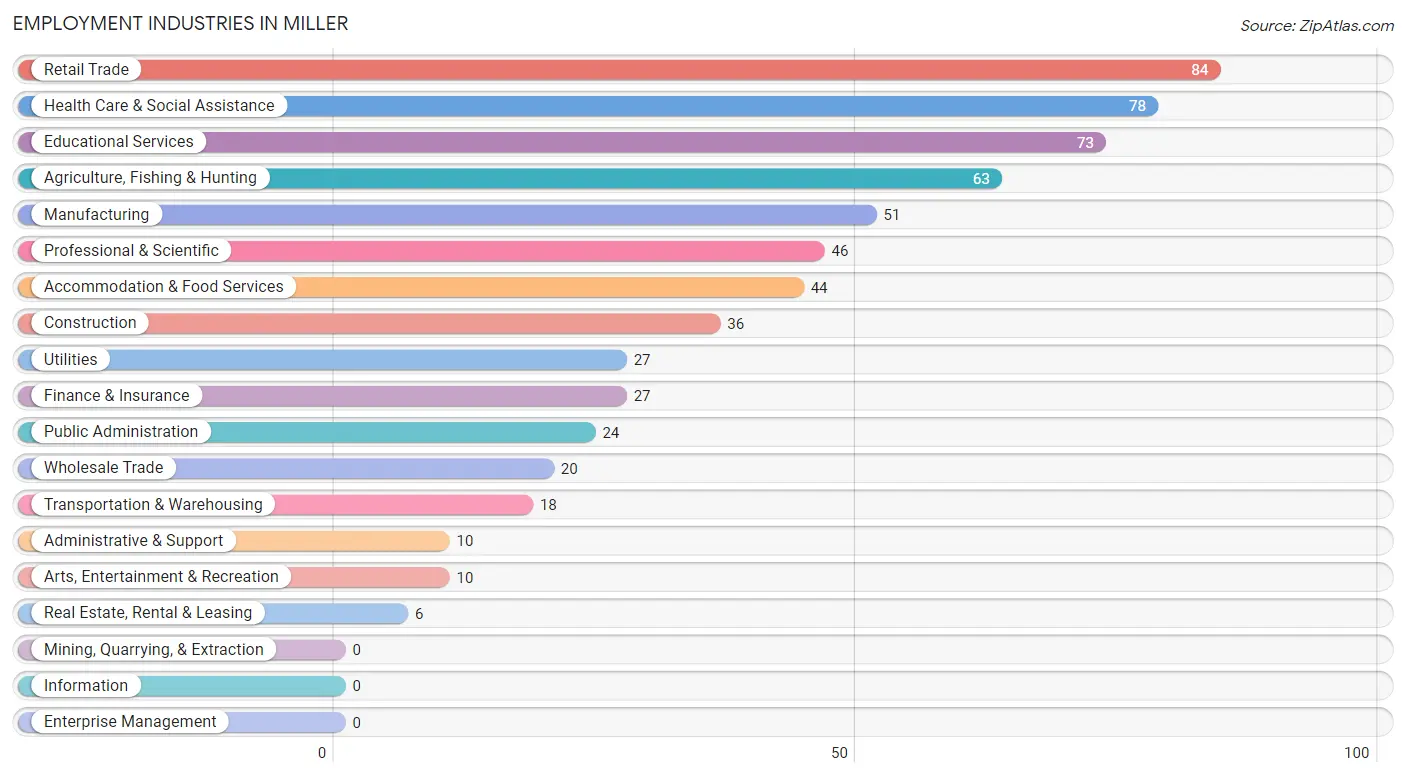
Employment Industries in Miller
The major employment industries in Miller include Retail Trade (84 | 13.0%), Health Care & Social Assistance (78 | 12.1%), Educational Services (73 | 11.3%), Agriculture, Fishing & Hunting (63 | 9.7%), and Manufacturing (51 | 7.9%).
Employment Industries by Sex in Miller
The Miller industries that see more men than women are Manufacturing (100.0%), Agriculture, Fishing & Hunting (93.6%), and Wholesale Trade (90.0%), whereas the industries that tend to have a higher number of women are Real Estate, Rental & Leasing (100.0%), Finance & Insurance (81.5%), and Health Care & Social Assistance (76.9%).
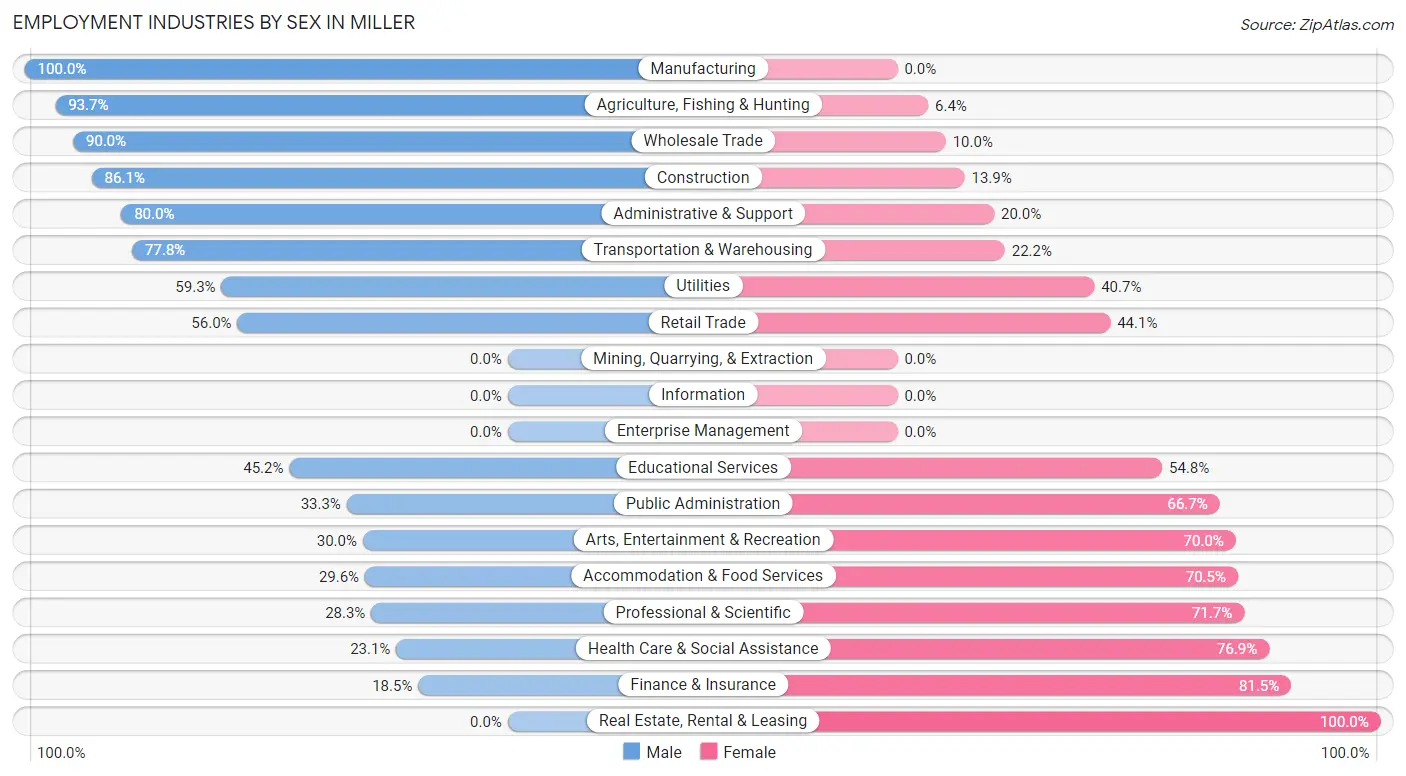
| Industry | Male | Female |
| Agriculture, Fishing & Hunting | 59 (93.6%) | 4 (6.4%) |
| Mining, Quarrying, & Extraction | 0 (0.0%) | 0 (0.0%) |
| Construction | 31 (86.1%) | 5 (13.9%) |
| Manufacturing | 51 (100.0%) | 0 (0.0%) |
| Wholesale Trade | 18 (90.0%) | 2 (10.0%) |
| Retail Trade | 47 (55.9%) | 37 (44.1%) |
| Transportation & Warehousing | 14 (77.8%) | 4 (22.2%) |
| Utilities | 16 (59.3%) | 11 (40.7%) |
| Information | 0 (0.0%) | 0 (0.0%) |
| Finance & Insurance | 5 (18.5%) | 22 (81.5%) |
| Real Estate, Rental & Leasing | 0 (0.0%) | 6 (100.0%) |
| Professional & Scientific | 13 (28.3%) | 33 (71.7%) |
| Enterprise Management | 0 (0.0%) | 0 (0.0%) |
| Administrative & Support | 8 (80.0%) | 2 (20.0%) |
| Educational Services | 33 (45.2%) | 40 (54.8%) |
| Health Care & Social Assistance | 18 (23.1%) | 60 (76.9%) |
| Arts, Entertainment & Recreation | 3 (30.0%) | 7 (70.0%) |
| Accommodation & Food Services | 13 (29.5%) | 31 (70.5%) |
| Public Administration | 8 (33.3%) | 16 (66.7%) |
| Total | 355 (54.9%) | 292 (45.1%) |
Education in Miller
School Enrollment in Miller
The most common levels of schooling among the 294 students in Miller are middle school (77 | 26.2%), elementary school (66 | 22.5%), and high school (62 | 21.1%).
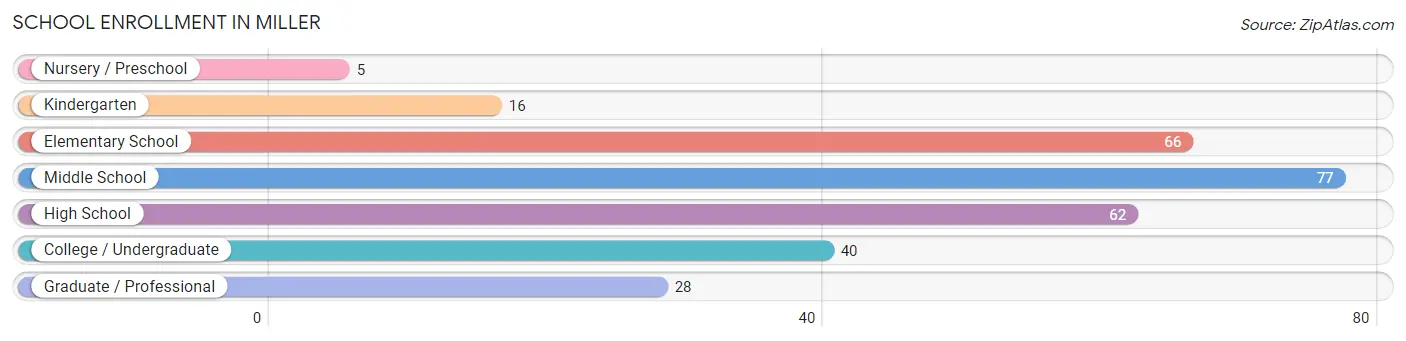
| School Level | # Students | % Students |
| Nursery / Preschool | 5 | 1.7% |
| Kindergarten | 16 | 5.4% |
| Elementary School | 66 | 22.5% |
| Middle School | 77 | 26.2% |
| High School | 62 | 21.1% |
| College / Undergraduate | 40 | 13.6% |
| Graduate / Professional | 28 | 9.5% |
| Total | 294 | 100.0% |
School Enrollment by Age by Funding Source in Miller
Out of a total of 294 students who are enrolled in schools in Miller, 9 (3.1%) attend a private institution, while the remaining 285 (96.9%) are enrolled in public schools. The age group of 35 years and over has the highest likelihood of being enrolled in private schools, with 5 (31.2% in the age bracket) enrolled. Conversely, the age group of 5 to 9 year old has the lowest likelihood of being enrolled in a private school, with 79 (100.0% in the age bracket) attending a public institution.
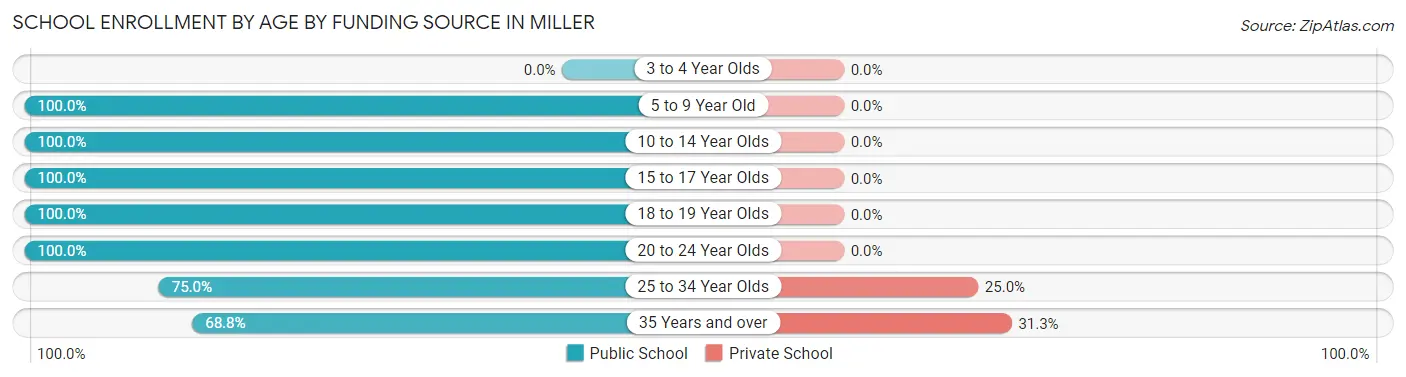
| Age Bracket | Public School | Private School |
| 3 to 4 Year Olds | 0 (0.0%) | 0 (0.0%) |
| 5 to 9 Year Old | 79 (100.0%) | 0 (0.0%) |
| 10 to 14 Year Olds | 87 (100.0%) | 0 (0.0%) |
| 15 to 17 Year Olds | 57 (100.0%) | 0 (0.0%) |
| 18 to 19 Year Olds | 15 (100.0%) | 0 (0.0%) |
| 20 to 24 Year Olds | 24 (100.0%) | 0 (0.0%) |
| 25 to 34 Year Olds | 12 (75.0%) | 4 (25.0%) |
| 35 Years and over | 11 (68.8%) | 5 (31.2%) |
| Total | 285 (96.9%) | 9 (3.1%) |
Educational Attainment by Field of Study in Miller
Education (81 | 34.5%), business (28 | 11.9%), computers & mathematics (24 | 10.2%), bio, nature & agricultural (23 | 9.8%), and liberal arts & history (18 | 7.7%) are the most common fields of study among 235 individuals in Miller who have obtained a bachelor's degree or higher.
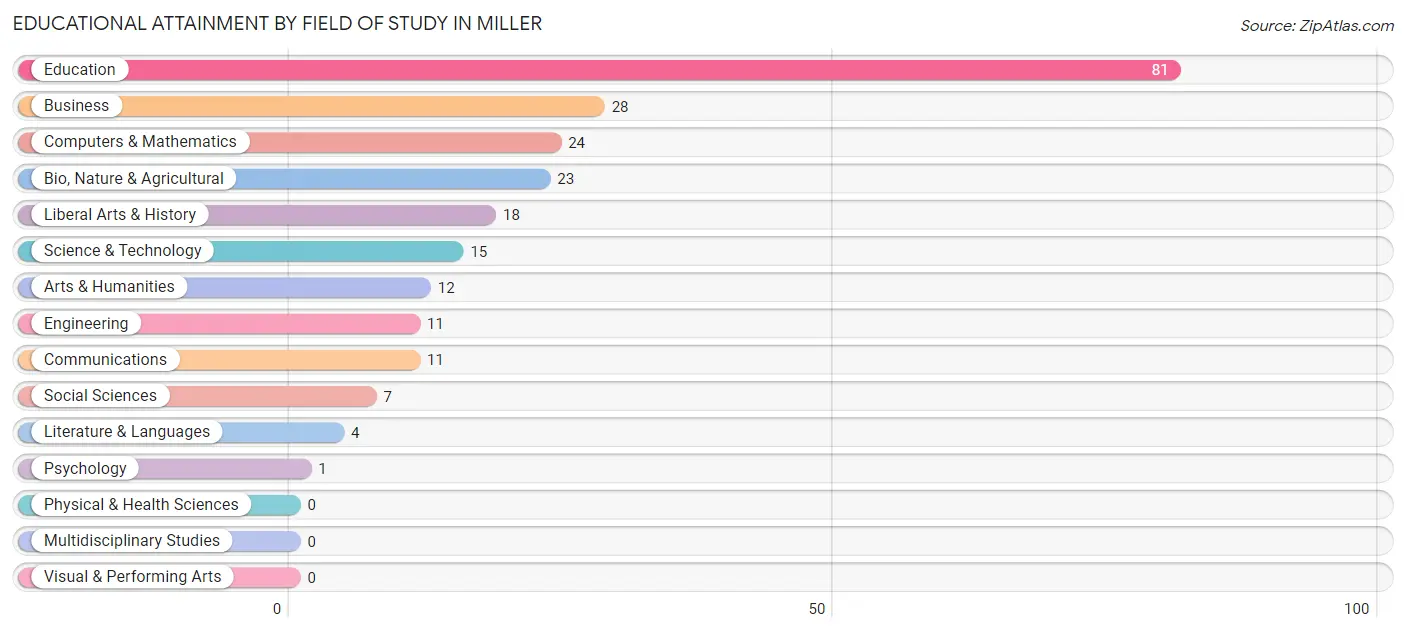
| Field of Study | # Graduates | % Graduates |
| Computers & Mathematics | 24 | 10.2% |
| Bio, Nature & Agricultural | 23 | 9.8% |
| Physical & Health Sciences | 0 | 0.0% |
| Psychology | 1 | 0.4% |
| Social Sciences | 7 | 3.0% |
| Engineering | 11 | 4.7% |
| Multidisciplinary Studies | 0 | 0.0% |
| Science & Technology | 15 | 6.4% |
| Business | 28 | 11.9% |
| Education | 81 | 34.5% |
| Literature & Languages | 4 | 1.7% |
| Liberal Arts & History | 18 | 7.7% |
| Visual & Performing Arts | 0 | 0.0% |
| Communications | 11 | 4.7% |
| Arts & Humanities | 12 | 5.1% |
| Total | 235 | 100.0% |
Transportation & Commute in Miller
Vehicle Availability by Sex in Miller
The most prevalent vehicle ownership categories in Miller are males with 2 vehicles (142, accounting for 40.0%) and females with 2 vehicles (99, making up 50.0%).
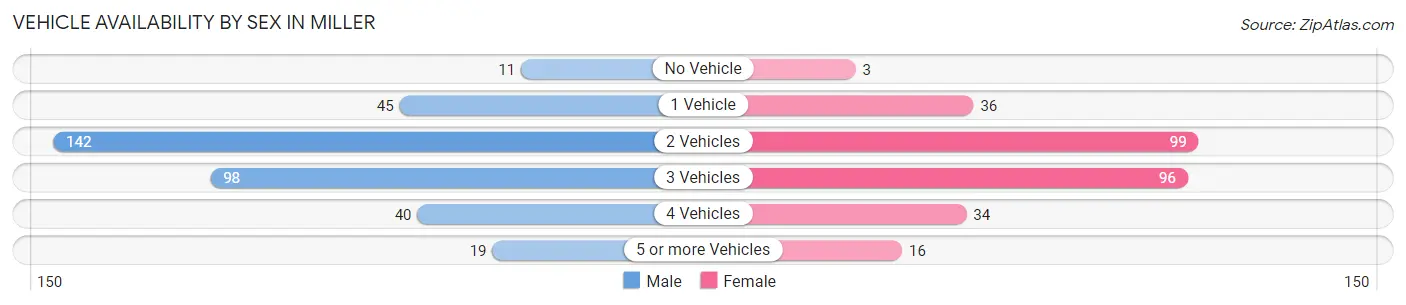
| Vehicles Available | Male | Female |
| No Vehicle | 11 (3.1%) | 3 (1.1%) |
| 1 Vehicle | 45 (12.7%) | 36 (12.7%) |
| 2 Vehicles | 142 (40.0%) | 99 (34.9%) |
| 3 Vehicles | 98 (27.6%) | 96 (33.8%) |
| 4 Vehicles | 40 (11.3%) | 34 (12.0%) |
| 5 or more Vehicles | 19 (5.3%) | 16 (5.6%) |
| Total | 355 (100.0%) | 284 (100.0%) |
Commute Time in Miller
The most frequently occuring commute durations in Miller are 5 to 9 minutes (239 commuters, 38.9%), less than 5 minutes (180 commuters, 29.3%), and 10 to 14 minutes (60 commuters, 9.8%).
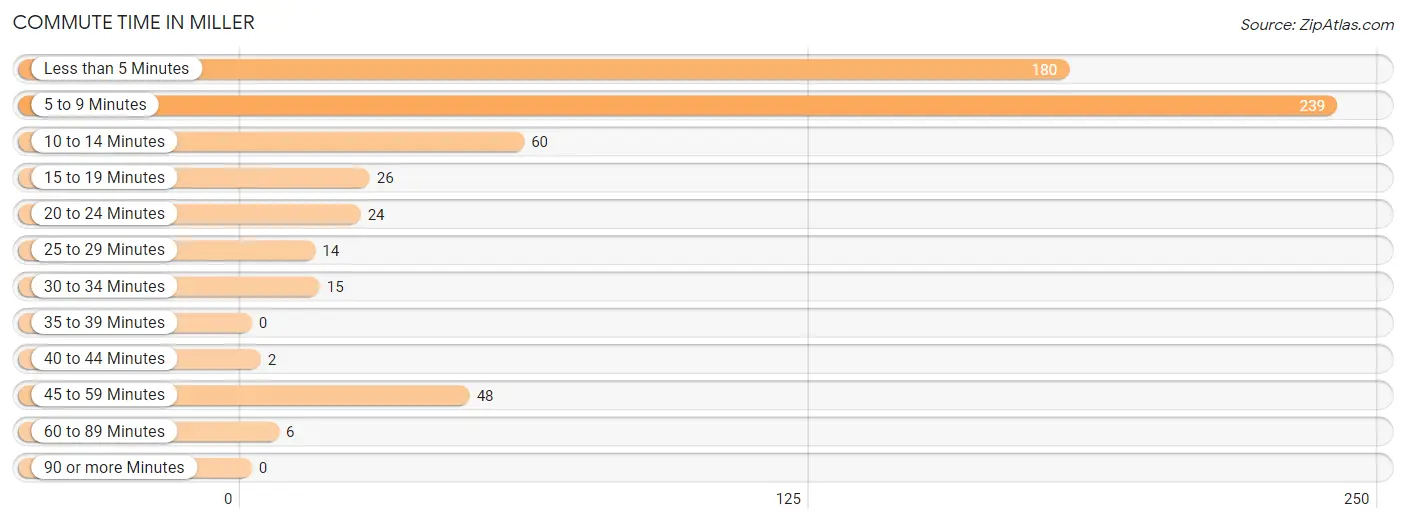
| Commute Time | # Commuters | % Commuters |
| Less than 5 Minutes | 180 | 29.3% |
| 5 to 9 Minutes | 239 | 38.9% |
| 10 to 14 Minutes | 60 | 9.8% |
| 15 to 19 Minutes | 26 | 4.2% |
| 20 to 24 Minutes | 24 | 3.9% |
| 25 to 29 Minutes | 14 | 2.3% |
| 30 to 34 Minutes | 15 | 2.4% |
| 35 to 39 Minutes | 0 | 0.0% |
| 40 to 44 Minutes | 2 | 0.3% |
| 45 to 59 Minutes | 48 | 7.8% |
| 60 to 89 Minutes | 6 | 1.0% |
| 90 or more Minutes | 0 | 0.0% |
Commute Time by Sex in Miller
The most common commute times in Miller are 5 to 9 minutes (168 commuters, 49.8%) for males and less than 5 minutes (125 commuters, 45.1%) for females.
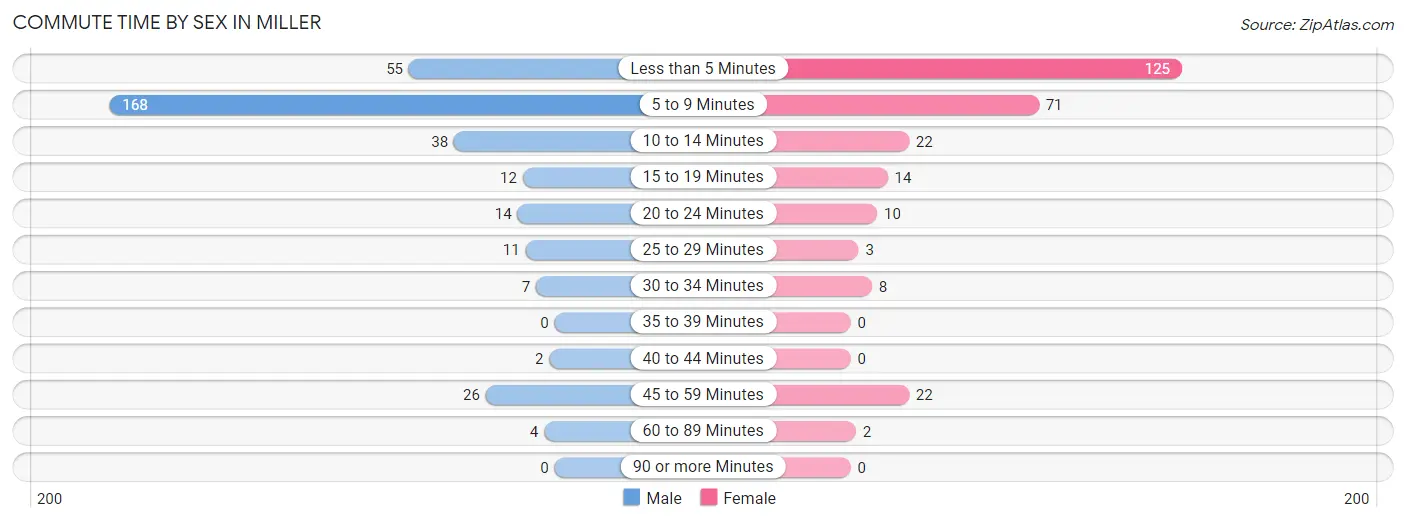
| Commute Time | Male | Female |
| Less than 5 Minutes | 55 (16.3%) | 125 (45.1%) |
| 5 to 9 Minutes | 168 (49.8%) | 71 (25.6%) |
| 10 to 14 Minutes | 38 (11.3%) | 22 (7.9%) |
| 15 to 19 Minutes | 12 (3.6%) | 14 (5.1%) |
| 20 to 24 Minutes | 14 (4.2%) | 10 (3.6%) |
| 25 to 29 Minutes | 11 (3.3%) | 3 (1.1%) |
| 30 to 34 Minutes | 7 (2.1%) | 8 (2.9%) |
| 35 to 39 Minutes | 0 (0.0%) | 0 (0.0%) |
| 40 to 44 Minutes | 2 (0.6%) | 0 (0.0%) |
| 45 to 59 Minutes | 26 (7.7%) | 22 (7.9%) |
| 60 to 89 Minutes | 4 (1.2%) | 2 (0.7%) |
| 90 or more Minutes | 0 (0.0%) | 0 (0.0%) |
Time of Departure to Work by Sex in Miller
The most frequent times of departure to work in Miller are 7:30 AM to 7:59 AM (100, 29.7%) for males and 7:30 AM to 7:59 AM (123, 44.4%) for females.
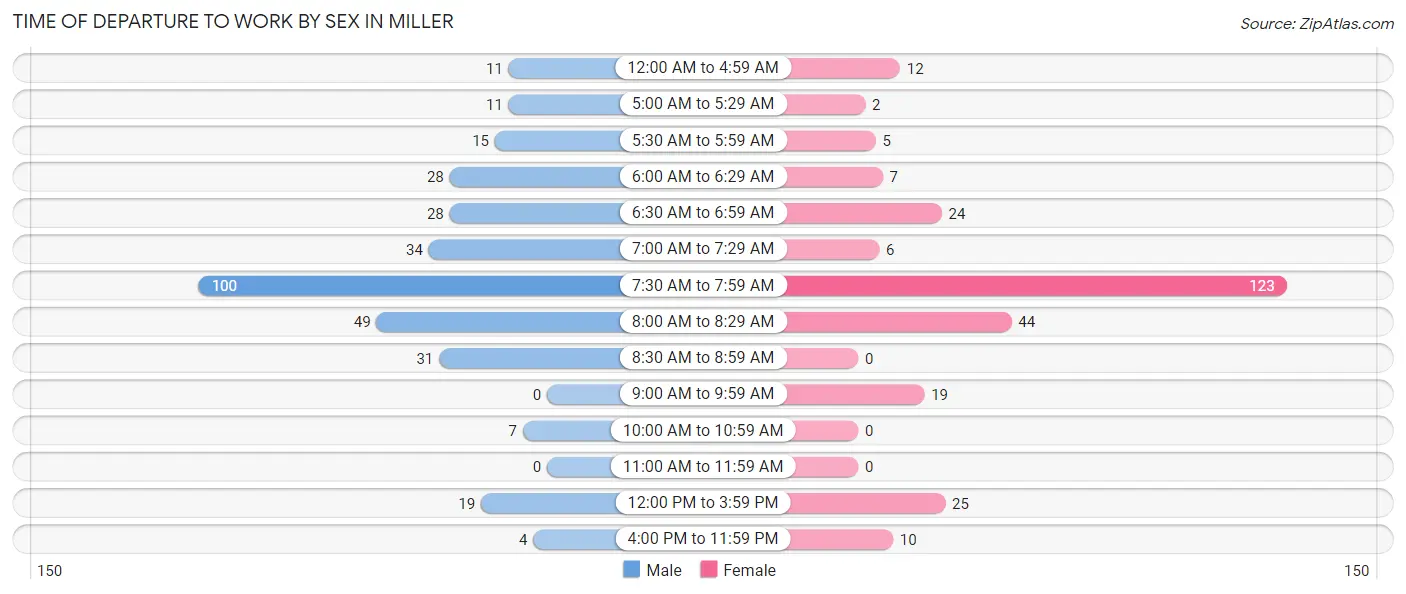
| Time of Departure | Male | Female |
| 12:00 AM to 4:59 AM | 11 (3.3%) | 12 (4.3%) |
| 5:00 AM to 5:29 AM | 11 (3.3%) | 2 (0.7%) |
| 5:30 AM to 5:59 AM | 15 (4.4%) | 5 (1.8%) |
| 6:00 AM to 6:29 AM | 28 (8.3%) | 7 (2.5%) |
| 6:30 AM to 6:59 AM | 28 (8.3%) | 24 (8.7%) |
| 7:00 AM to 7:29 AM | 34 (10.1%) | 6 (2.2%) |
| 7:30 AM to 7:59 AM | 100 (29.7%) | 123 (44.4%) |
| 8:00 AM to 8:29 AM | 49 (14.5%) | 44 (15.9%) |
| 8:30 AM to 8:59 AM | 31 (9.2%) | 0 (0.0%) |
| 9:00 AM to 9:59 AM | 0 (0.0%) | 19 (6.9%) |
| 10:00 AM to 10:59 AM | 7 (2.1%) | 0 (0.0%) |
| 11:00 AM to 11:59 AM | 0 (0.0%) | 0 (0.0%) |
| 12:00 PM to 3:59 PM | 19 (5.6%) | 25 (9.0%) |
| 4:00 PM to 11:59 PM | 4 (1.2%) | 10 (3.6%) |
| Total | 337 (100.0%) | 277 (100.0%) |
Housing Occupancy in Miller
Occupancy by Ownership in Miller
Of the total 628 dwellings in Miller, owner-occupied units account for 429 (68.3%), while renter-occupied units make up 199 (31.7%).
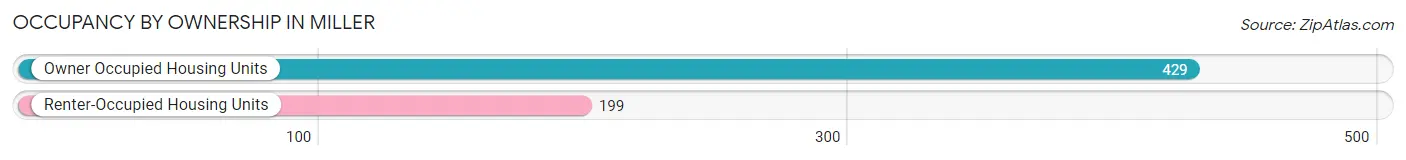
| Occupancy | # Housing Units | % Housing Units |
| Owner Occupied Housing Units | 429 | 68.3% |
| Renter-Occupied Housing Units | 199 | 31.7% |
| Total Occupied Housing Units | 628 | 100.0% |
Occupancy by Household Size in Miller
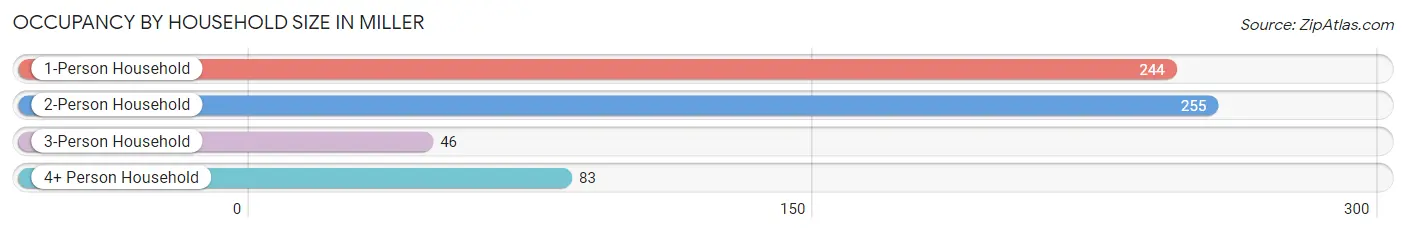
| Household Size | # Housing Units | % Housing Units |
| 1-Person Household | 244 | 38.9% |
| 2-Person Household | 255 | 40.6% |
| 3-Person Household | 46 | 7.3% |
| 4+ Person Household | 83 | 13.2% |
| Total Housing Units | 628 | 100.0% |
Occupancy by Ownership by Household Size in Miller
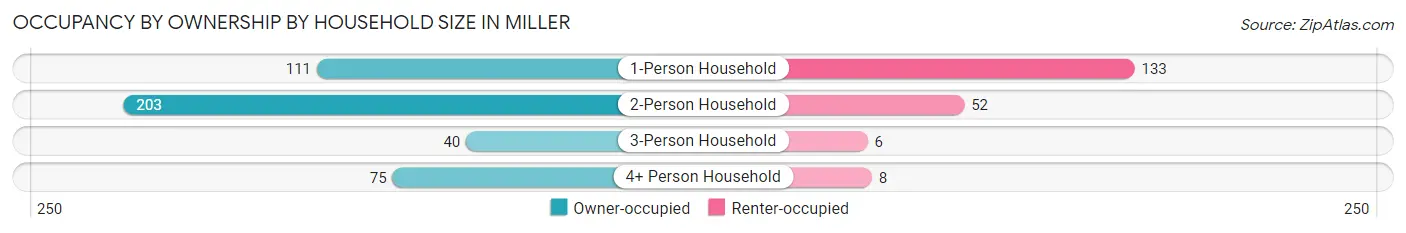
| Household Size | Owner-occupied | Renter-occupied |
| 1-Person Household | 111 (45.5%) | 133 (54.5%) |
| 2-Person Household | 203 (79.6%) | 52 (20.4%) |
| 3-Person Household | 40 (87.0%) | 6 (13.0%) |
| 4+ Person Household | 75 (90.4%) | 8 (9.6%) |
| Total Housing Units | 429 (68.3%) | 199 (31.7%) |
Occupancy by Educational Attainment in Miller
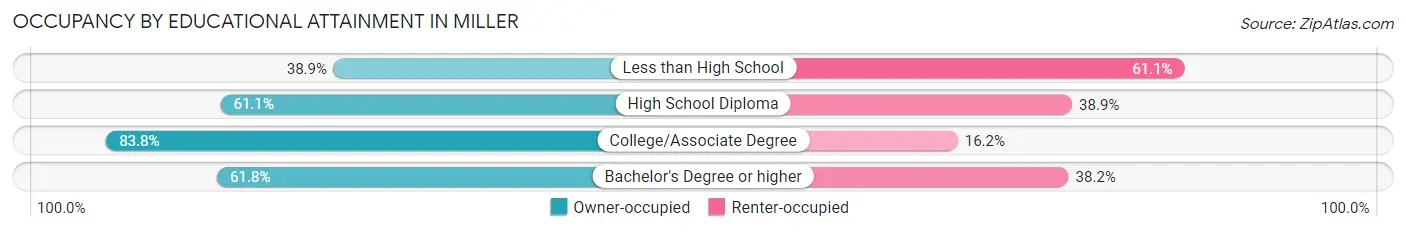
| Household Size | Owner-occupied | Renter-occupied |
| Less than High School | 21 (38.9%) | 33 (61.1%) |
| High School Diploma | 107 (61.1%) | 68 (38.9%) |
| College/Associate Degree | 207 (83.8%) | 40 (16.2%) |
| Bachelor's Degree or higher | 94 (61.8%) | 58 (38.2%) |
Occupancy by Age of Householder in Miller
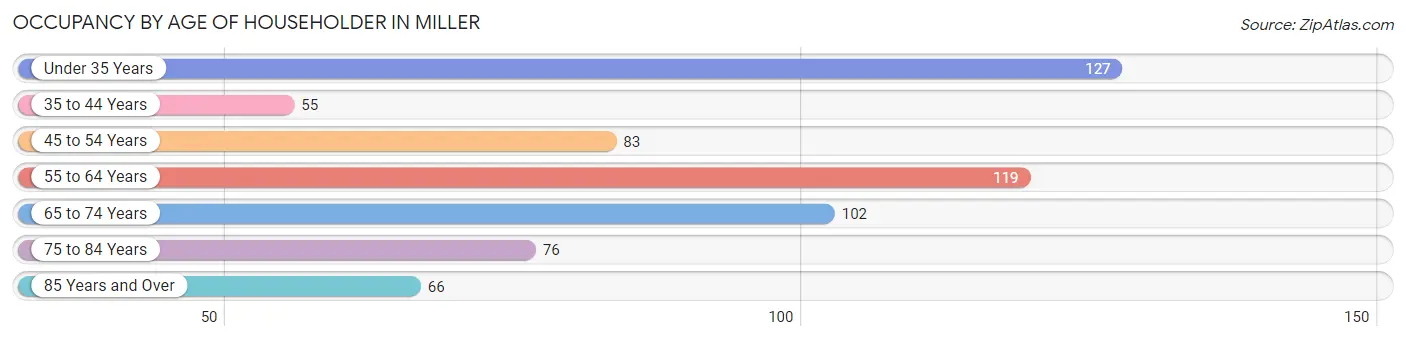
| Age Bracket | # Households | % Households |
| Under 35 Years | 127 | 20.2% |
| 35 to 44 Years | 55 | 8.8% |
| 45 to 54 Years | 83 | 13.2% |
| 55 to 64 Years | 119 | 19.0% |
| 65 to 74 Years | 102 | 16.2% |
| 75 to 84 Years | 76 | 12.1% |
| 85 Years and Over | 66 | 10.5% |
| Total | 628 | 100.0% |
Housing Finances in Miller
Median Income by Occupancy in Miller
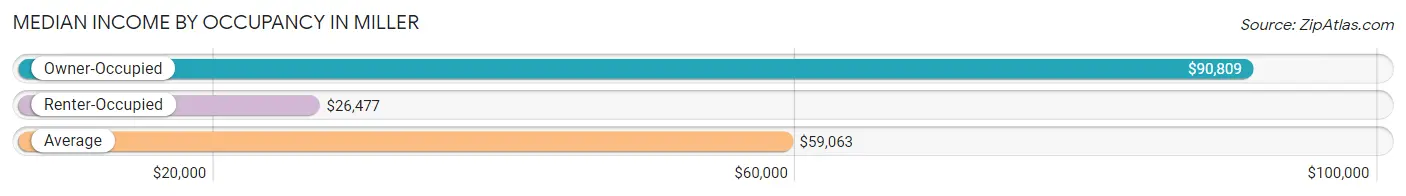
| Occupancy Type | # Households | Median Income |
| Owner-Occupied | 429 (68.3%) | $90,809 |
| Renter-Occupied | 199 (31.7%) | $26,477 |
| Average | 628 (100.0%) | $59,063 |
Occupancy by Householder Income Bracket in Miller
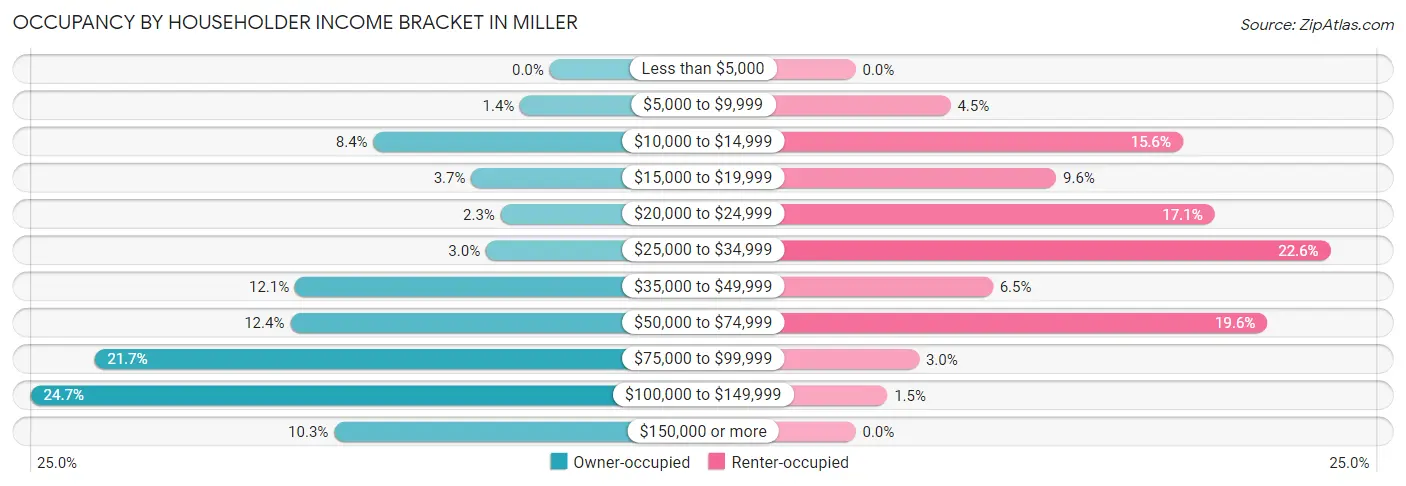
| Income Bracket | Owner-occupied | Renter-occupied |
| Less than $5,000 | 0 (0.0%) | 0 (0.0%) |
| $5,000 to $9,999 | 6 (1.4%) | 9 (4.5%) |
| $10,000 to $14,999 | 36 (8.4%) | 31 (15.6%) |
| $15,000 to $19,999 | 16 (3.7%) | 19 (9.6%) |
| $20,000 to $24,999 | 10 (2.3%) | 34 (17.1%) |
| $25,000 to $34,999 | 13 (3.0%) | 45 (22.6%) |
| $35,000 to $49,999 | 52 (12.1%) | 13 (6.5%) |
| $50,000 to $74,999 | 53 (12.3%) | 39 (19.6%) |
| $75,000 to $99,999 | 93 (21.7%) | 6 (3.0%) |
| $100,000 to $149,999 | 106 (24.7%) | 3 (1.5%) |
| $150,000 or more | 44 (10.3%) | 0 (0.0%) |
| Total | 429 (100.0%) | 199 (100.0%) |
Monthly Housing Cost Tiers in Miller
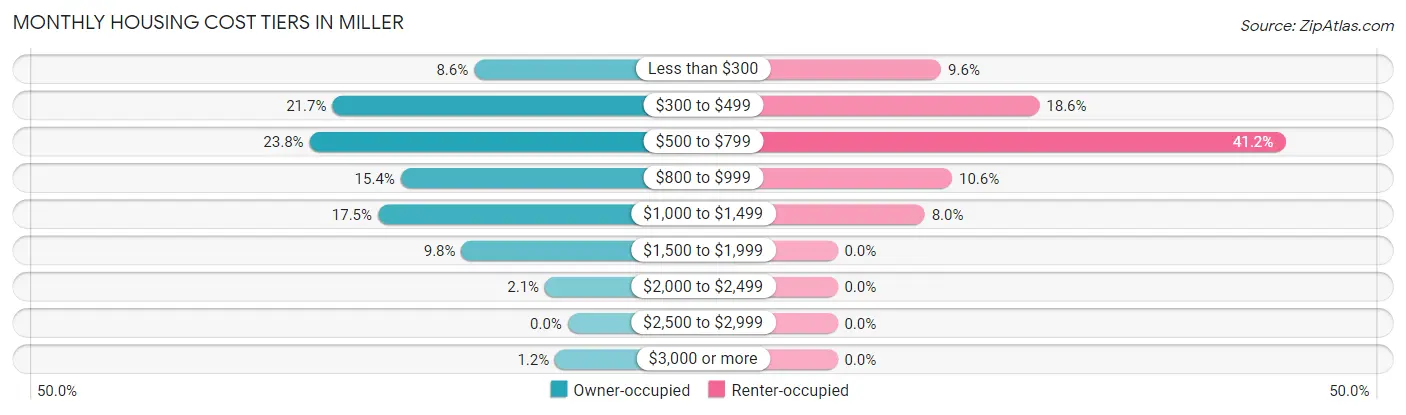
| Monthly Cost | Owner-occupied | Renter-occupied |
| Less than $300 | 37 (8.6%) | 19 (9.6%) |
| $300 to $499 | 93 (21.7%) | 37 (18.6%) |
| $500 to $799 | 102 (23.8%) | 82 (41.2%) |
| $800 to $999 | 66 (15.4%) | 21 (10.5%) |
| $1,000 to $1,499 | 75 (17.5%) | 16 (8.0%) |
| $1,500 to $1,999 | 42 (9.8%) | 0 (0.0%) |
| $2,000 to $2,499 | 9 (2.1%) | 0 (0.0%) |
| $2,500 to $2,999 | 0 (0.0%) | 0 (0.0%) |
| $3,000 or more | 5 (1.2%) | 0 (0.0%) |
| Total | 429 (100.0%) | 199 (100.0%) |
Physical Housing Characteristics in Miller
Housing Structures in Miller
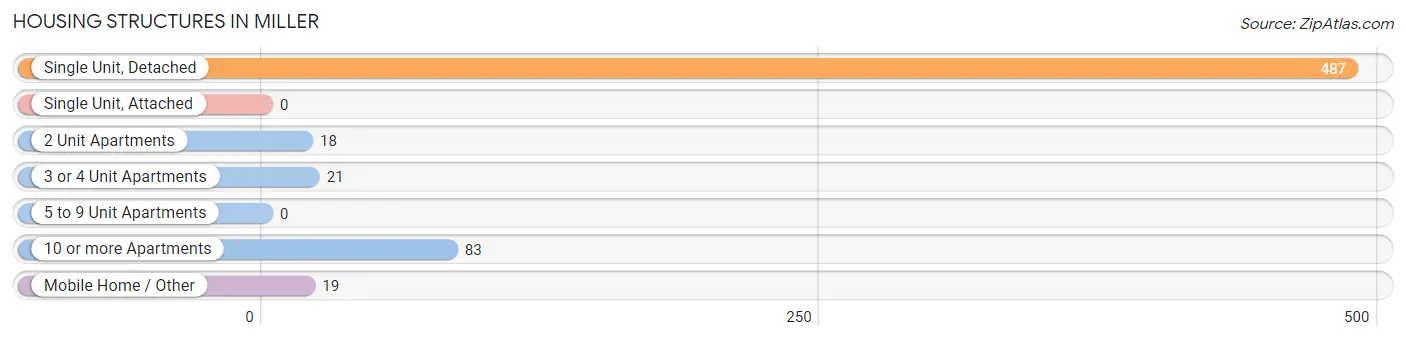
| Structure Type | # Housing Units | % Housing Units |
| Single Unit, Detached | 487 | 77.5% |
| Single Unit, Attached | 0 | 0.0% |
| 2 Unit Apartments | 18 | 2.9% |
| 3 or 4 Unit Apartments | 21 | 3.3% |
| 5 to 9 Unit Apartments | 0 | 0.0% |
| 10 or more Apartments | 83 | 13.2% |
| Mobile Home / Other | 19 | 3.0% |
| Total | 628 | 100.0% |
Housing Structures by Occupancy in Miller
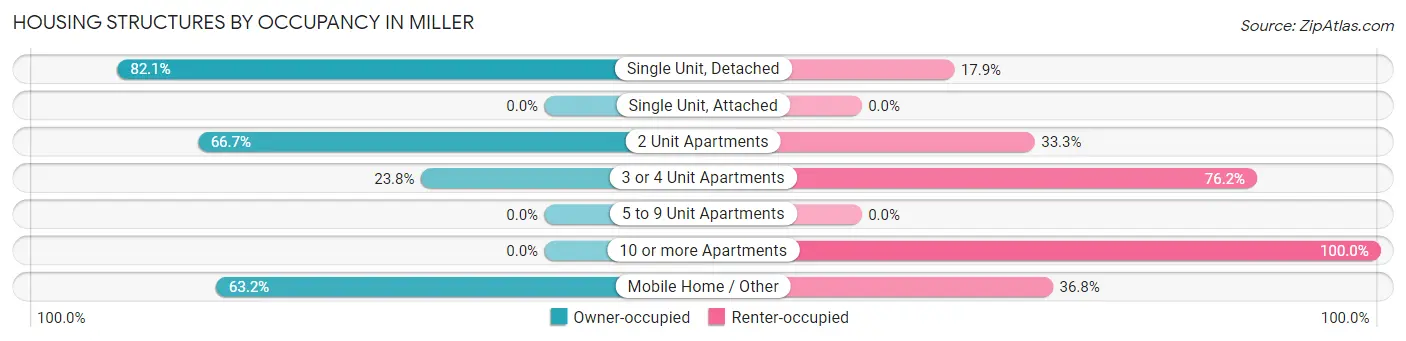
| Structure Type | Owner-occupied | Renter-occupied |
| Single Unit, Detached | 400 (82.1%) | 87 (17.9%) |
| Single Unit, Attached | 0 (0.0%) | 0 (0.0%) |
| 2 Unit Apartments | 12 (66.7%) | 6 (33.3%) |
| 3 or 4 Unit Apartments | 5 (23.8%) | 16 (76.2%) |
| 5 to 9 Unit Apartments | 0 (0.0%) | 0 (0.0%) |
| 10 or more Apartments | 0 (0.0%) | 83 (100.0%) |
| Mobile Home / Other | 12 (63.2%) | 7 (36.8%) |
| Total | 429 (68.3%) | 199 (31.7%) |
Housing Structures by Number of Rooms in Miller
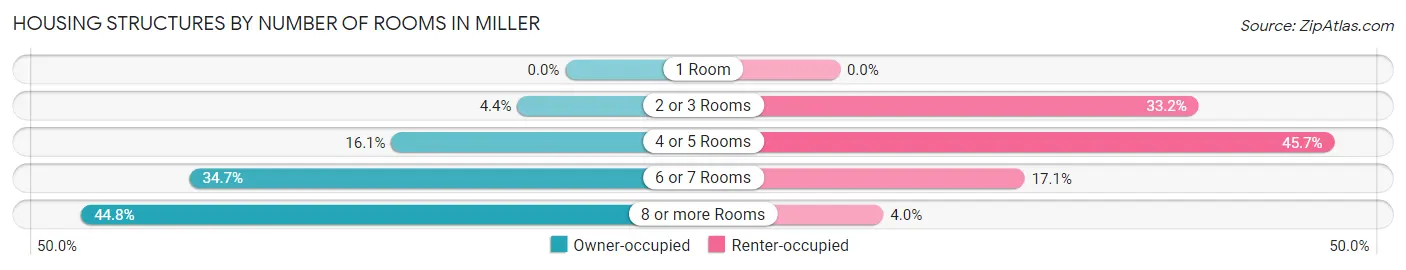
| Number of Rooms | Owner-occupied | Renter-occupied |
| 1 Room | 0 (0.0%) | 0 (0.0%) |
| 2 or 3 Rooms | 19 (4.4%) | 66 (33.2%) |
| 4 or 5 Rooms | 69 (16.1%) | 91 (45.7%) |
| 6 or 7 Rooms | 149 (34.7%) | 34 (17.1%) |
| 8 or more Rooms | 192 (44.8%) | 8 (4.0%) |
| Total | 429 (100.0%) | 199 (100.0%) |
Housing Structure by Heating Type in Miller
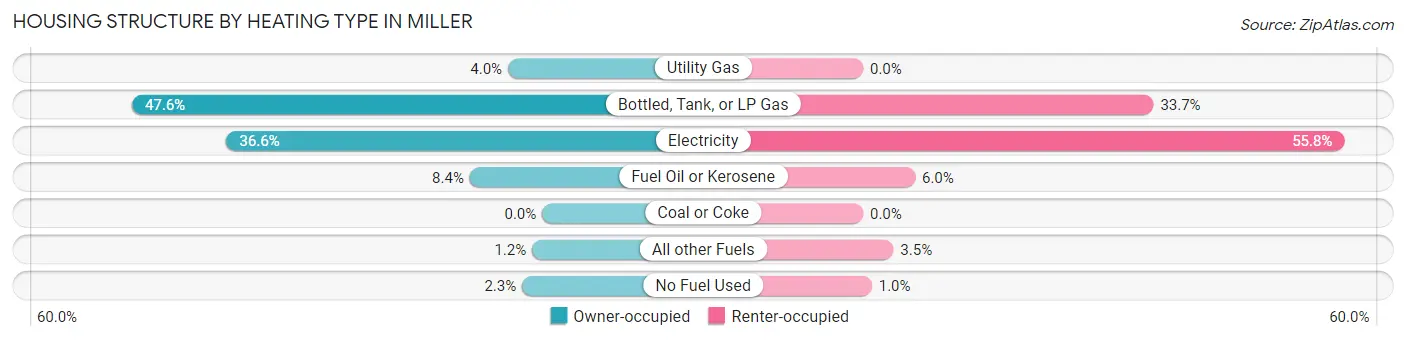
| Heating Type | Owner-occupied | Renter-occupied |
| Utility Gas | 17 (4.0%) | 0 (0.0%) |
| Bottled, Tank, or LP Gas | 204 (47.5%) | 67 (33.7%) |
| Electricity | 157 (36.6%) | 111 (55.8%) |
| Fuel Oil or Kerosene | 36 (8.4%) | 12 (6.0%) |
| Coal or Coke | 0 (0.0%) | 0 (0.0%) |
| All other Fuels | 5 (1.2%) | 7 (3.5%) |
| No Fuel Used | 10 (2.3%) | 2 (1.0%) |
| Total | 429 (100.0%) | 199 (100.0%) |
Household Vehicle Usage in Miller
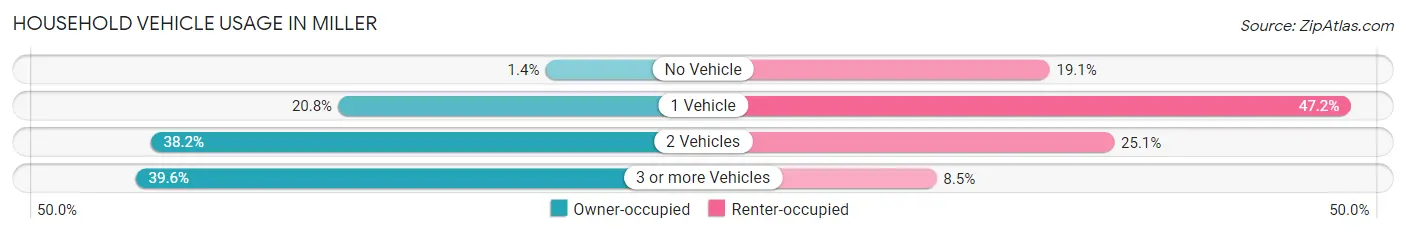
| Vehicles per Household | Owner-occupied | Renter-occupied |
| No Vehicle | 6 (1.4%) | 38 (19.1%) |
| 1 Vehicle | 89 (20.7%) | 94 (47.2%) |
| 2 Vehicles | 164 (38.2%) | 50 (25.1%) |
| 3 or more Vehicles | 170 (39.6%) | 17 (8.5%) |
| Total | 429 (100.0%) | 199 (100.0%) |
Real Estate & Mortgages in Miller
Real Estate and Mortgage Overview in Miller
| Characteristic | Without Mortgage | With Mortgage |
| Housing Units | 241 | 188 |
| Median Property Value | $137,500 | $116,300 |
| Median Household Income | $82,917 | $8 |
| Monthly Housing Costs | $487 | $5 |
| Real Estate Taxes | $1,278 | $14 |
Property Value by Mortgage Status in Miller
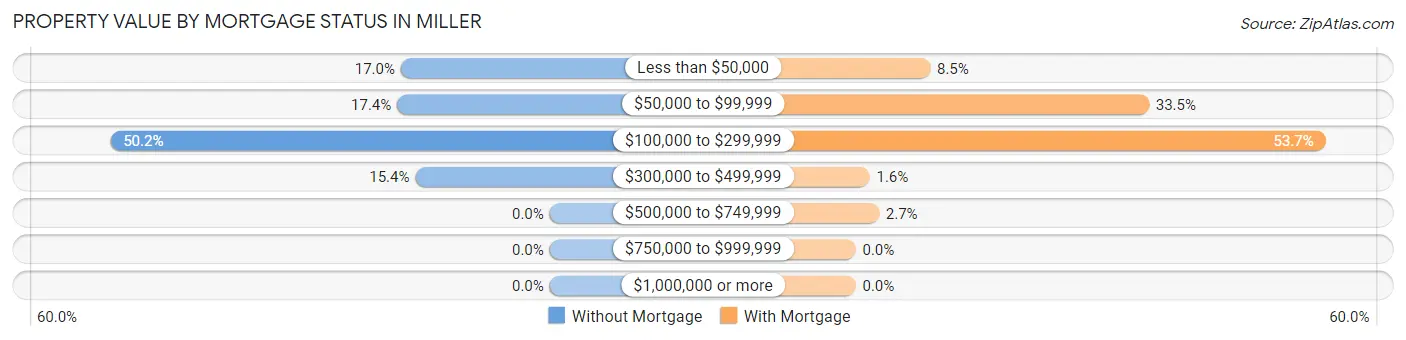
| Property Value | Without Mortgage | With Mortgage |
| Less than $50,000 | 41 (17.0%) | 16 (8.5%) |
| $50,000 to $99,999 | 42 (17.4%) | 63 (33.5%) |
| $100,000 to $299,999 | 121 (50.2%) | 101 (53.7%) |
| $300,000 to $499,999 | 37 (15.3%) | 3 (1.6%) |
| $500,000 to $749,999 | 0 (0.0%) | 5 (2.7%) |
| $750,000 to $999,999 | 0 (0.0%) | 0 (0.0%) |
| $1,000,000 or more | 0 (0.0%) | 0 (0.0%) |
| Total | 241 (100.0%) | 188 (100.0%) |
Household Income by Mortgage Status in Miller
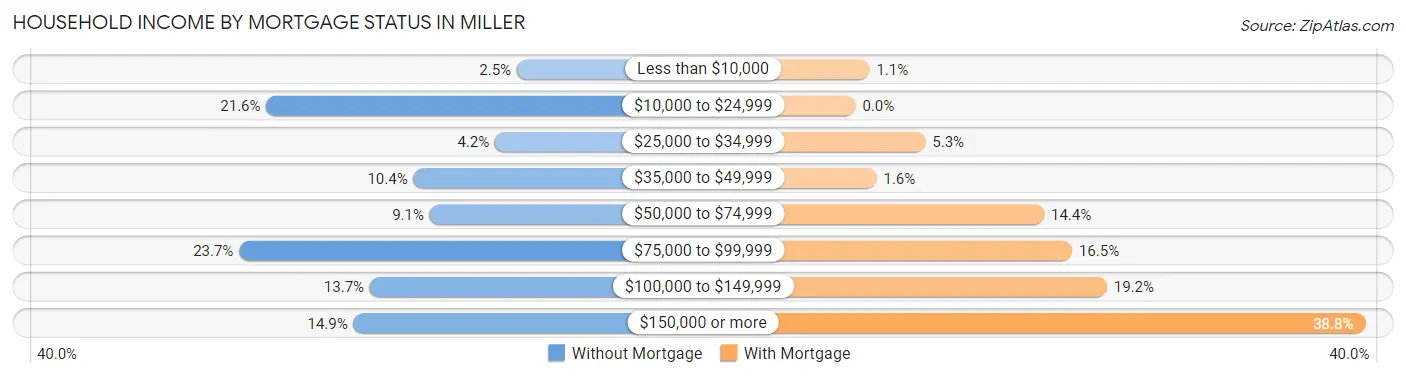
| Household Income | Without Mortgage | With Mortgage |
| Less than $10,000 | 6 (2.5%) | 2 (1.1%) |
| $10,000 to $24,999 | 52 (21.6%) | 0 (0.0%) |
| $25,000 to $34,999 | 10 (4.2%) | 10 (5.3%) |
| $35,000 to $49,999 | 25 (10.4%) | 3 (1.6%) |
| $50,000 to $74,999 | 22 (9.1%) | 27 (14.4%) |
| $75,000 to $99,999 | 57 (23.6%) | 31 (16.5%) |
| $100,000 to $149,999 | 33 (13.7%) | 36 (19.2%) |
| $150,000 or more | 36 (14.9%) | 73 (38.8%) |
| Total | 241 (100.0%) | 188 (100.0%) |
Property Value to Household Income Ratio in Miller
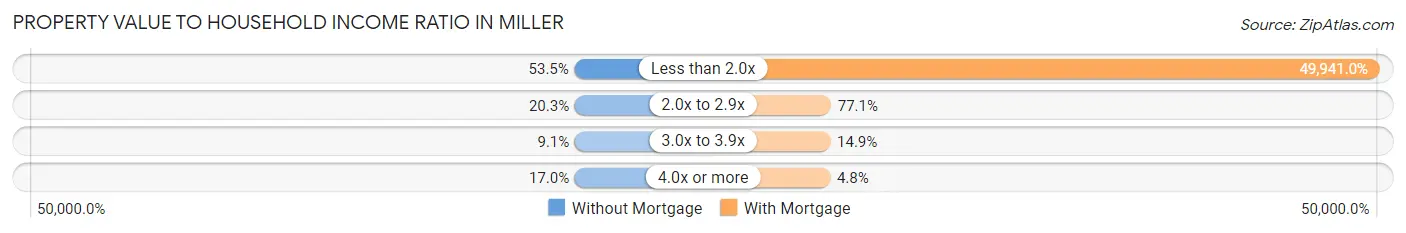
| Value-to-Income Ratio | Without Mortgage | With Mortgage |
| Less than 2.0x | 129 (53.5%) | 93,889 (49,941.0%) |
| 2.0x to 2.9x | 49 (20.3%) | 145 (77.1%) |
| 3.0x to 3.9x | 22 (9.1%) | 28 (14.9%) |
| 4.0x or more | 41 (17.0%) | 9 (4.8%) |
| Total | 241 (100.0%) | 188 (100.0%) |
Real Estate Taxes by Mortgage Status in Miller
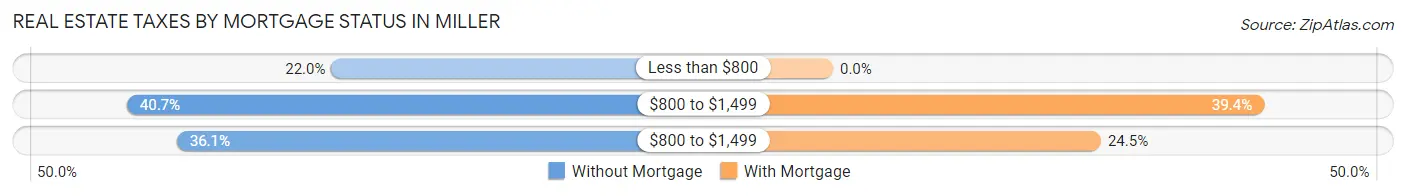
| Property Taxes | Without Mortgage | With Mortgage |
| Less than $800 | 53 (22.0%) | 0 (0.0%) |
| $800 to $1,499 | 98 (40.7%) | 74 (39.4%) |
| $800 to $1,499 | 87 (36.1%) | 46 (24.5%) |
| Total | 241 (100.0%) | 188 (100.0%) |
Health & Disability in Miller
Health Insurance Coverage by Age in Miller
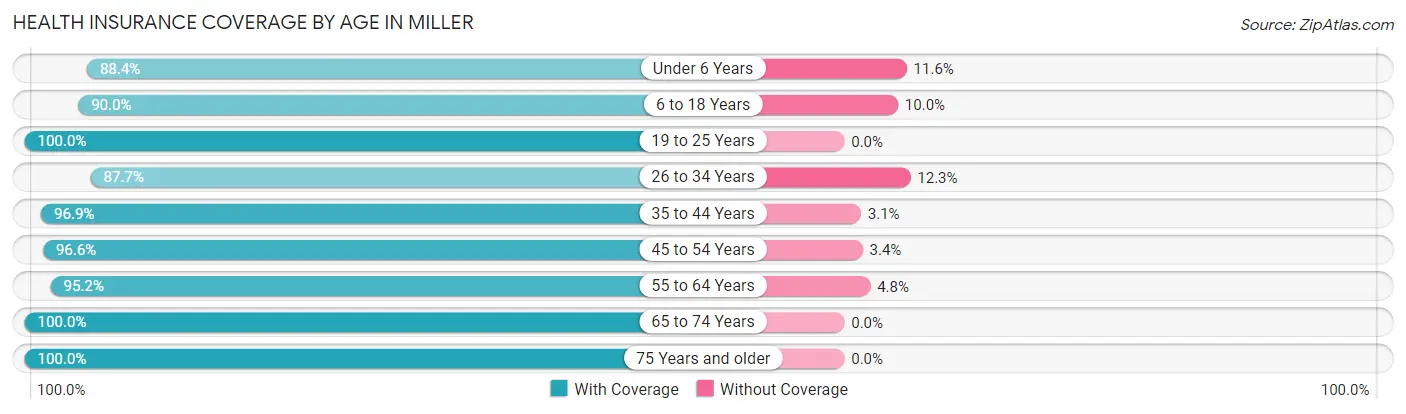
| Age Bracket | With Coverage | Without Coverage |
| Under 6 Years | 38 (88.4%) | 5 (11.6%) |
| 6 to 18 Years | 216 (90.0%) | 24 (10.0%) |
| 19 to 25 Years | 72 (100.0%) | 0 (0.0%) |
| 26 to 34 Years | 121 (87.7%) | 17 (12.3%) |
| 35 to 44 Years | 94 (96.9%) | 3 (3.1%) |
| 45 to 54 Years | 113 (96.6%) | 4 (3.4%) |
| 55 to 64 Years | 177 (95.2%) | 9 (4.8%) |
| 65 to 74 Years | 163 (100.0%) | 0 (0.0%) |
| 75 Years and older | 184 (100.0%) | 0 (0.0%) |
| Total | 1,178 (95.0%) | 62 (5.0%) |
Health Insurance Coverage by Citizenship Status in Miller
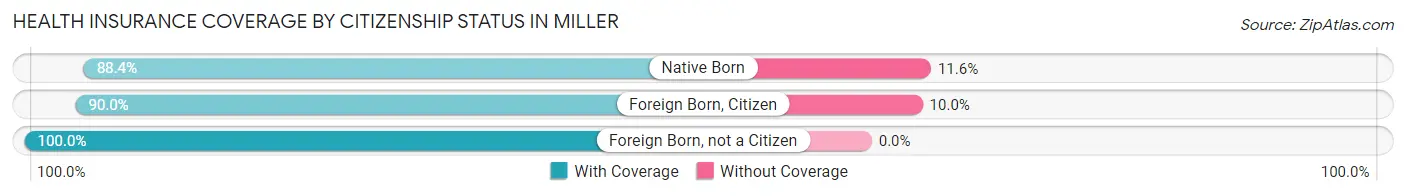
| Citizenship Status | With Coverage | Without Coverage |
| Native Born | 38 (88.4%) | 5 (11.6%) |
| Foreign Born, Citizen | 216 (90.0%) | 24 (10.0%) |
| Foreign Born, not a Citizen | 72 (100.0%) | 0 (0.0%) |
Health Insurance Coverage by Household Income in Miller
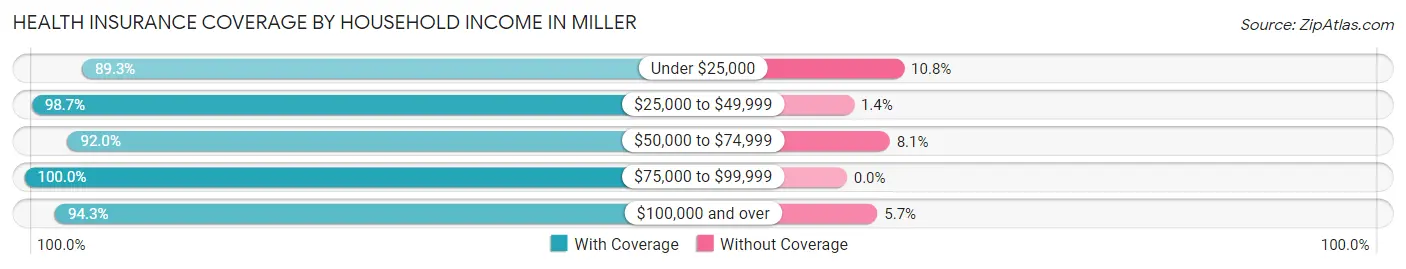
| Household Income | With Coverage | Without Coverage |
| Under $25,000 | 166 (89.2%) | 20 (10.7%) |
| $25,000 to $49,999 | 220 (98.7%) | 3 (1.3%) |
| $50,000 to $74,999 | 160 (91.9%) | 14 (8.1%) |
| $75,000 to $99,999 | 200 (100.0%) | 0 (0.0%) |
| $100,000 and over | 411 (94.3%) | 25 (5.7%) |
Public vs Private Health Insurance Coverage by Age in Miller
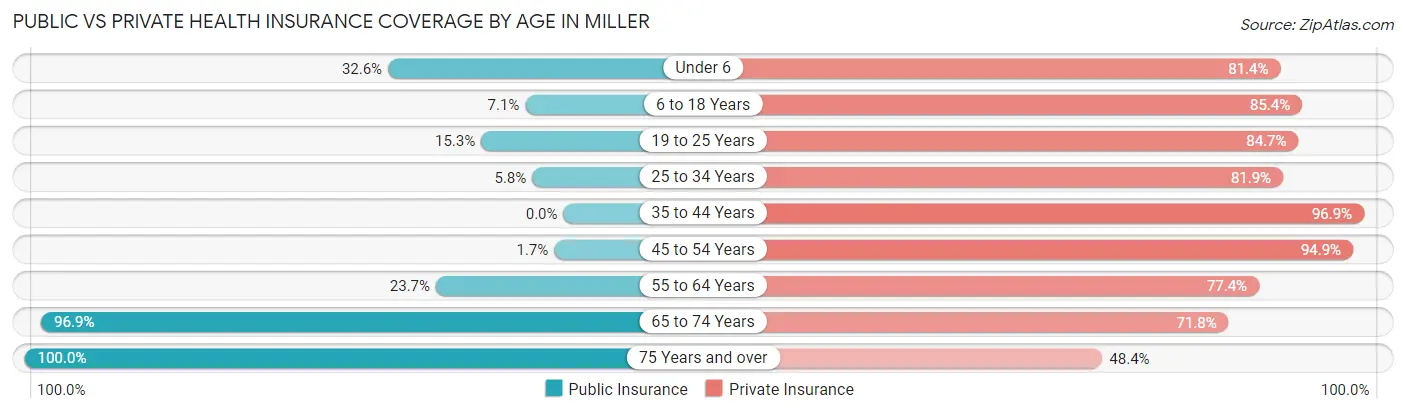
| Age Bracket | Public Insurance | Private Insurance |
| Under 6 | 14 (32.6%) | 35 (81.4%) |
| 6 to 18 Years | 17 (7.1%) | 205 (85.4%) |
| 19 to 25 Years | 11 (15.3%) | 61 (84.7%) |
| 25 to 34 Years | 8 (5.8%) | 113 (81.9%) |
| 35 to 44 Years | 0 (0.0%) | 94 (96.9%) |
| 45 to 54 Years | 2 (1.7%) | 111 (94.9%) |
| 55 to 64 Years | 44 (23.7%) | 144 (77.4%) |
| 65 to 74 Years | 158 (96.9%) | 117 (71.8%) |
| 75 Years and over | 184 (100.0%) | 89 (48.4%) |
| Total | 438 (35.3%) | 969 (78.1%) |
Disability Status by Sex by Age in Miller
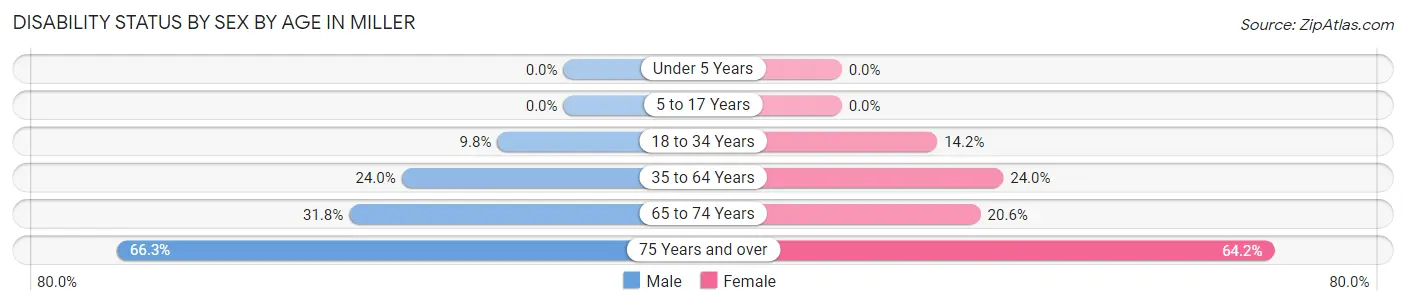
| Age Bracket | Male | Female |
| Under 5 Years | 0 (0.0%) | 0 (0.0%) |
| 5 to 17 Years | 0 (0.0%) | 0 (0.0%) |
| 18 to 34 Years | 11 (9.8%) | 17 (14.2%) |
| 35 to 64 Years | 55 (24.0%) | 41 (24.0%) |
| 65 to 74 Years | 21 (31.8%) | 20 (20.6%) |
| 75 Years and over | 59 (66.3%) | 61 (64.2%) |
Disability Class by Sex by Age in Miller
Disability Class: Hearing Difficulty
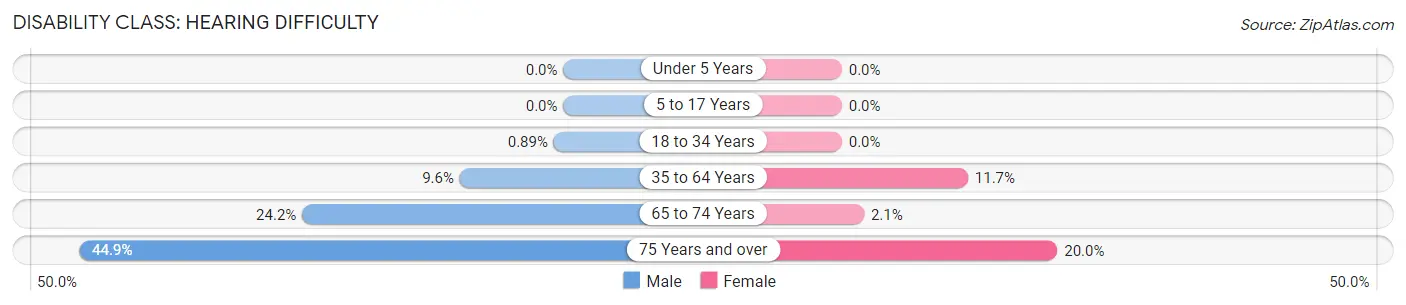
| Age Bracket | Male | Female |
| Under 5 Years | 0 (0.0%) | 0 (0.0%) |
| 5 to 17 Years | 0 (0.0%) | 0 (0.0%) |
| 18 to 34 Years | 1 (0.9%) | 0 (0.0%) |
| 35 to 64 Years | 22 (9.6%) | 20 (11.7%) |
| 65 to 74 Years | 16 (24.2%) | 2 (2.1%) |
| 75 Years and over | 40 (44.9%) | 19 (20.0%) |
Disability Class: Vision Difficulty
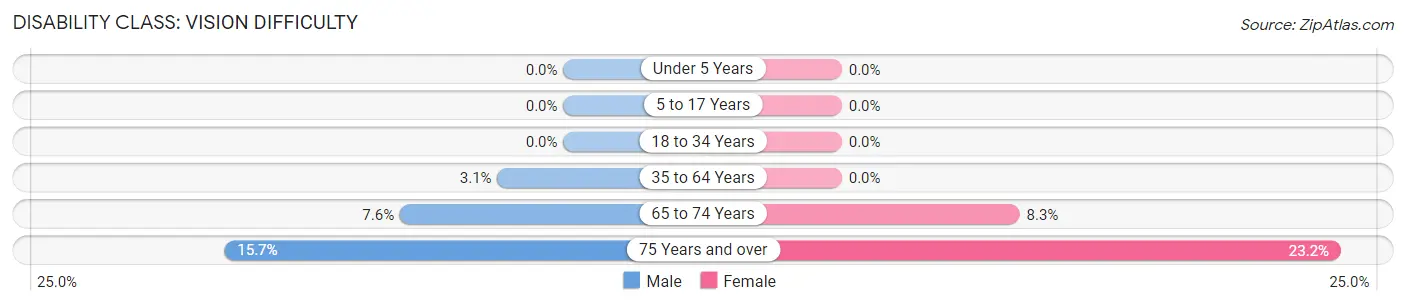
| Age Bracket | Male | Female |
| Under 5 Years | 0 (0.0%) | 0 (0.0%) |
| 5 to 17 Years | 0 (0.0%) | 0 (0.0%) |
| 18 to 34 Years | 0 (0.0%) | 0 (0.0%) |
| 35 to 64 Years | 7 (3.1%) | 0 (0.0%) |
| 65 to 74 Years | 5 (7.6%) | 8 (8.3%) |
| 75 Years and over | 14 (15.7%) | 22 (23.2%) |
Disability Class: Cognitive Difficulty
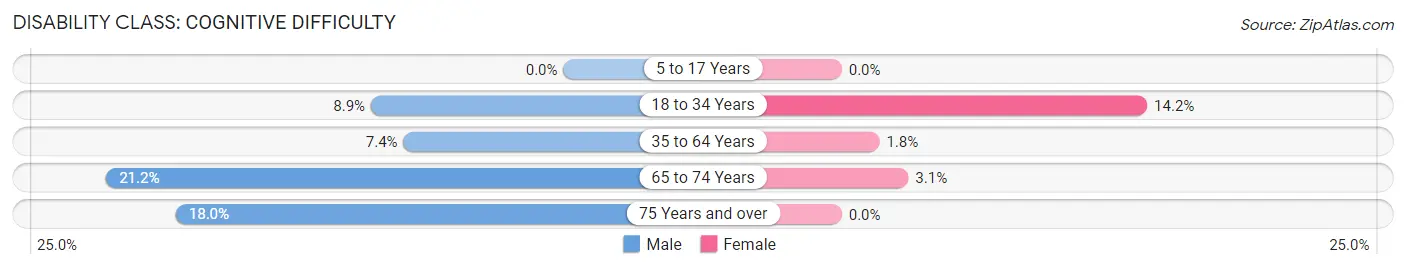
| Age Bracket | Male | Female |
| 5 to 17 Years | 0 (0.0%) | 0 (0.0%) |
| 18 to 34 Years | 10 (8.9%) | 17 (14.2%) |
| 35 to 64 Years | 17 (7.4%) | 3 (1.8%) |
| 65 to 74 Years | 14 (21.2%) | 3 (3.1%) |
| 75 Years and over | 16 (18.0%) | 0 (0.0%) |
Disability Class: Ambulatory Difficulty
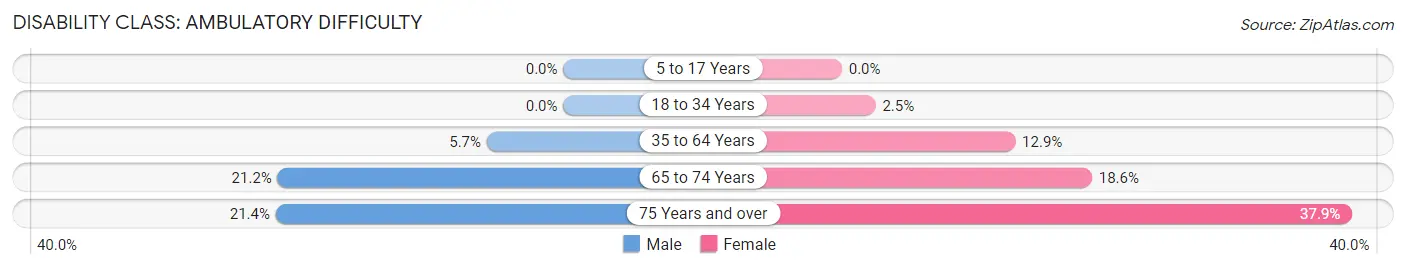
| Age Bracket | Male | Female |
| 5 to 17 Years | 0 (0.0%) | 0 (0.0%) |
| 18 to 34 Years | 0 (0.0%) | 3 (2.5%) |
| 35 to 64 Years | 13 (5.7%) | 22 (12.9%) |
| 65 to 74 Years | 14 (21.2%) | 18 (18.6%) |
| 75 Years and over | 19 (21.3%) | 36 (37.9%) |
Disability Class: Self-Care Difficulty
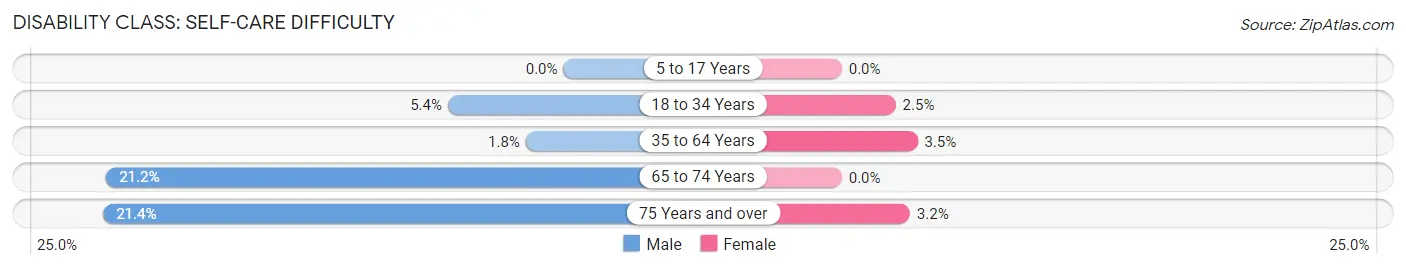
| Age Bracket | Male | Female |
| 5 to 17 Years | 0 (0.0%) | 0 (0.0%) |
| 18 to 34 Years | 6 (5.4%) | 3 (2.5%) |
| 35 to 64 Years | 4 (1.8%) | 6 (3.5%) |
| 65 to 74 Years | 14 (21.2%) | 0 (0.0%) |
| 75 Years and over | 19 (21.3%) | 3 (3.2%) |
Technology Access in Miller
Computing Device Access in Miller
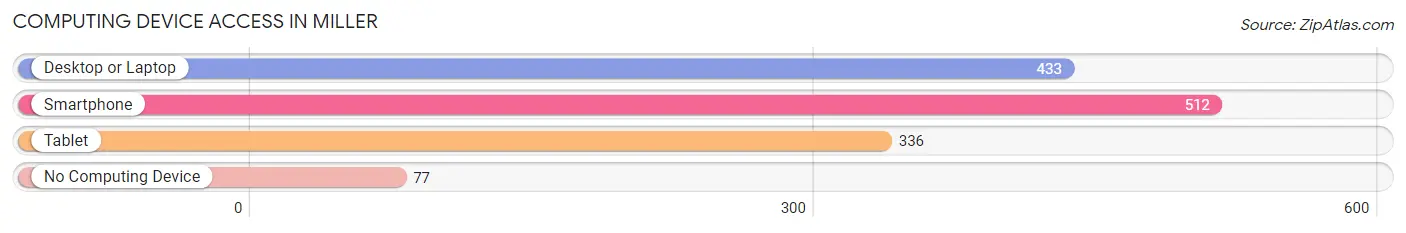
| Device Type | # Households | % Households |
| Desktop or Laptop | 433 | 69.0% |
| Smartphone | 512 | 81.5% |
| Tablet | 336 | 53.5% |
| No Computing Device | 77 | 12.3% |
| Total | 628 | 100.0% |
Internet Access in Miller
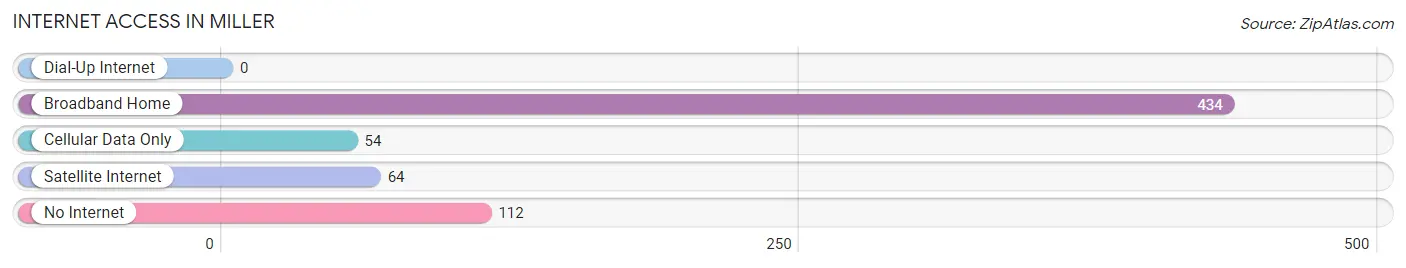
| Internet Type | # Households | % Households |
| Dial-Up Internet | 0 | 0.0% |
| Broadband Home | 434 | 69.1% |
| Cellular Data Only | 54 | 8.6% |
| Satellite Internet | 64 | 10.2% |
| No Internet | 112 | 17.8% |
| Total | 628 | 100.0% |
Miller Summary
The city of Miller, South Dakota is located in Hand County in the northeastern part of the state. It is situated on the James River, approximately 20 miles south of the North Dakota border. Miller is the county seat of Hand County and is home to a population of 1,845 people, according to the 2010 census.
Geography
Miller is located in the James River Valley, which is part of the Great Plains region of the United States. The city is situated on the banks of the James River, which flows through the city and is a major source of recreation for the area. The city is surrounded by rolling hills and prairies, and is located in the heart of the Great Plains. The city is located at an elevation of 1,845 feet above sea level.
The climate in Miller is classified as a humid continental climate, with hot summers and cold winters. The average temperature in the summer months is around 80 degrees Fahrenheit, while the average temperature in the winter months is around 20 degrees Fahrenheit. The city receives an average of 20 inches of precipitation per year, with most of it falling in the spring and summer months.
Economy
The economy of Miller is largely based on agriculture and manufacturing. The city is home to several large agricultural operations, including grain and livestock farms. The city is also home to several manufacturing companies, including a furniture factory, a plastics factory, and a metal fabrication plant.
The city is also home to several retail stores, restaurants, and other businesses. The city is served by the Miller Municipal Airport, which provides air service to the surrounding area.
Demographics
According to the 2010 census, the population of Miller was 1,845 people. The racial makeup of the city was 97.3% White, 0.3% African American, 0.2% Native American, 0.2% Asian, 0.1% Pacific Islander, 0.7% from other races, and 1.2% from two or more races. Hispanic or Latino of any race were 1.7% of the population.
The median income for a household in Miller was $37,917, and the median income for a family was $45,938. The per capita income for the city was $18,945. About 11.2% of families and 14.2% of the population were below the poverty line, including 18.2% of those under age 18 and 8.3% of those age 65 or over.
Miller is served by the Miller Public School District, which includes Miller High School. The city is also home to several churches, including the First Presbyterian Church, the First Lutheran Church, and the Miller United Methodist Church.
Miller is a small city with a rich history and a strong sense of community. The city is home to a diverse population and a vibrant economy. Miller is a great place to live, work, and raise a family.
Common Questions
What is the Total Population of Miller?
Total Population of Miller is 1,293.
What is the Total Male Population of Miller?
Total Male Population of Miller is 629.
What is the Total Female Population of Miller?
Total Female Population of Miller is 664.
What is the Ratio of Males per 100 Females in Miller?
There are 94.73 Males per 100 Females in Miller.
What is the Ratio of Females per 100 Males in Miller?
There are 105.56 Females per 100 Males in Miller.
What is the Median Population Age in Miller?
Median Population Age in Miller is 49.3 Years.
What is the Average Family Size in Miller
Average Family Size in Miller is 2.6 People.
What is the Average Household Size in Miller
Average Household Size in Miller is 1.9 People.
What is Per Capita Income in Miller?
Per Capita income in Miller is $40,727.
What is the Median Family Income in Miller?
Median Family Income in Miller is $92,644.
What is the Median Household income in Miller?
Median Household Income in Miller is $59,063.
What is Income or Wage Gap in Miller?
Income or Wage Gap in Miller is 28.0%.
Women in Miller earn 72.0 cents for every dollar earned by a man.
What is Inequality or Gini Index in Miller?
Inequality or Gini Index in Miller is 0.50.
How Large is the Labor Force in Miller?
There are 649 People in the Labor Forcein in Miller.
What is the Percentage of People in the Labor Force in Miller?
60.5% of People are in the Labor Force in Miller.