Zip Codes with the Highest Percentage of Immigrants from Eastern Asia in Mansfield, OH
RELATED REPORTS & OPTIONS
Eastern Asia
Mansfield
Compare Zip Codes
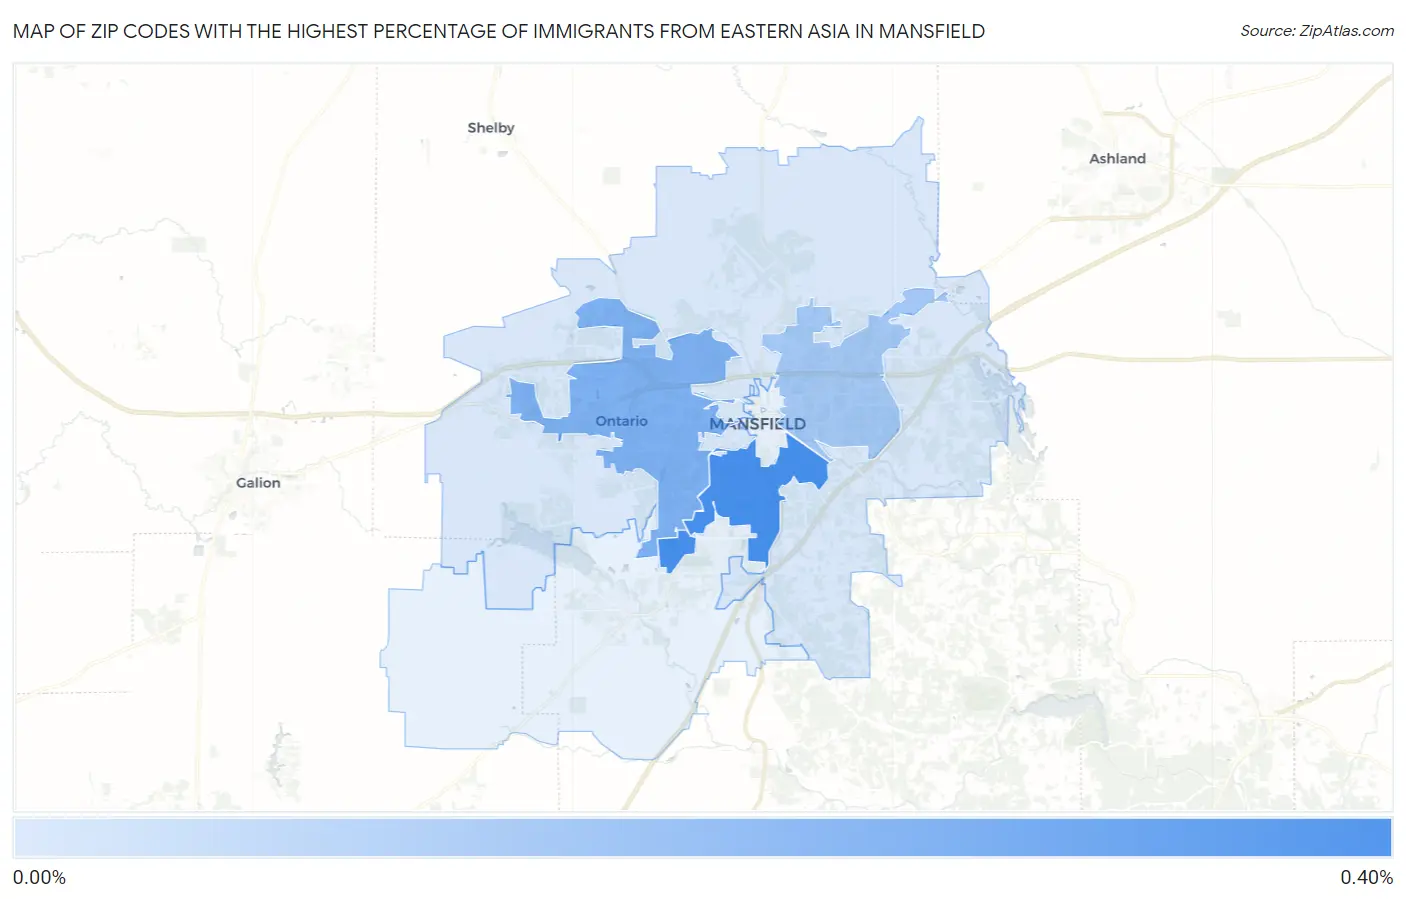
Map of Zip Codes with the Highest Percentage of Immigrants from Eastern Asia in Mansfield
0.00%
0.40%
Zip Codes with the Highest Percentage of Immigrants from Eastern Asia in Mansfield, OH
| Zip Code | Eastern Asia | vs State | vs National | |
| 1. | 44907 | 0.36% | 0.52%(-0.164)#214 | 1.28%(-0.920)#8,077 |
| 2. | 44906 | 0.22% | 0.52%(-0.295)#278 | 1.28%(-1.05)#9,869 |
| 3. | 44905 | 0.13% | 0.52%(-0.385)#333 | 1.28%(-1.14)#11,475 |
| 4. | 44903 | 0.012% | 0.52%(-0.508)#441 | 1.28%(-1.26)#13,950 |
1
Common Questions
What are the Top 5 Zip Codes with the Highest Percentage of Immigrants from Eastern Asia in Mansfield, OH?
Top 5 Zip Codes with the Highest Percentage of Immigrants from Eastern Asia in Mansfield, OH are:
What zip code has the Highest Percentage of Immigrants from Eastern Asia in Mansfield, OH?
44907 has the Highest Percentage of Immigrants from Eastern Asia in Mansfield, OH with 0.36%.
What is the Percentage of Immigrants from Eastern Asia in Mansfield, OH?
Percentage of Immigrants from Eastern Asia in Mansfield is 0.17%.
What is the Percentage of Immigrants from Eastern Asia in Ohio?
Percentage of Immigrants from Eastern Asia in Ohio is 0.52%.
What is the Percentage of Immigrants from Eastern Asia in the United States?
Percentage of Immigrants from Eastern Asia in the United States is 1.28%.