Bushnell, NE
Bushnell Map
Bushnell Overview
141
TOTAL POPULATION
82
MALE POPULATION
59
FEMALE POPULATION
138.98
MALES / 100 FEMALES
71.95
FEMALES / 100 MALES
60.9
MEDIAN AGE
2.8
AVG FAMILY SIZE
2.3
AVG HOUSEHOLD SIZE
$17,135
PER CAPITA INCOME
$29,250
AVG FAMILY INCOME
$28,750
AVG HOUSEHOLD INCOME
0.38
INEQUALITY / GINI INDEX
36
LABOR FORCE [ PEOPLE ]
28.8%
PERCENT IN LABOR FORCE
11.1%
UNEMPLOYMENT RATE
Bushnell Zip Codes
Bushnell Area Codes
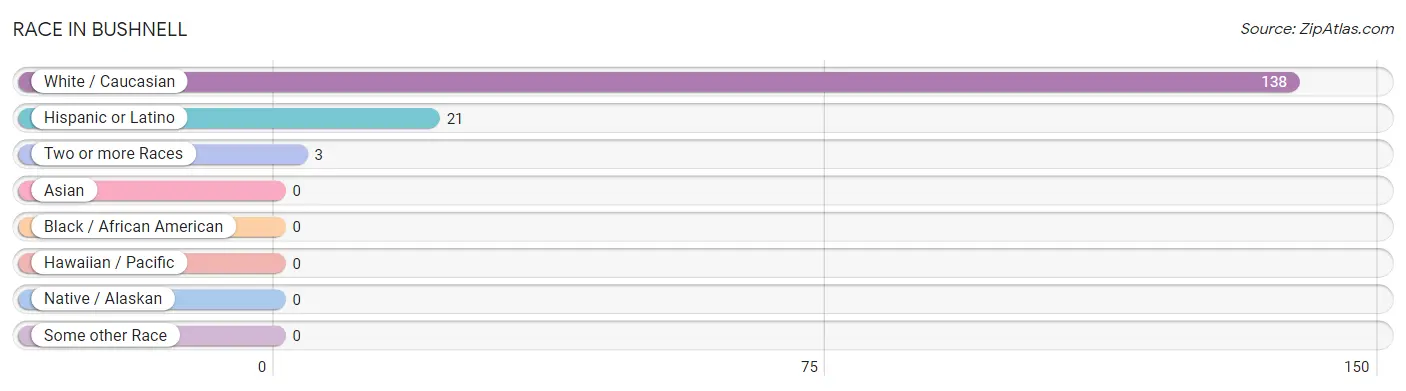
Race in Bushnell
The most populous races in Bushnell are White / Caucasian (138 | 97.9%), Hispanic or Latino (21 | 14.9%), and Two or more Races (3 | 2.1%).
| Race | # Population | % Population |
| Asian | 0 | 0.0% |
| Black / African American | 0 | 0.0% |
| Hawaiian / Pacific | 0 | 0.0% |
| Hispanic or Latino | 21 | 14.9% |
| Native / Alaskan | 0 | 0.0% |
| White / Caucasian | 138 | 97.9% |
| Two or more Races | 3 | 2.1% |
| Some other Race | 0 | 0.0% |
| Total | 141 | 100.0% |
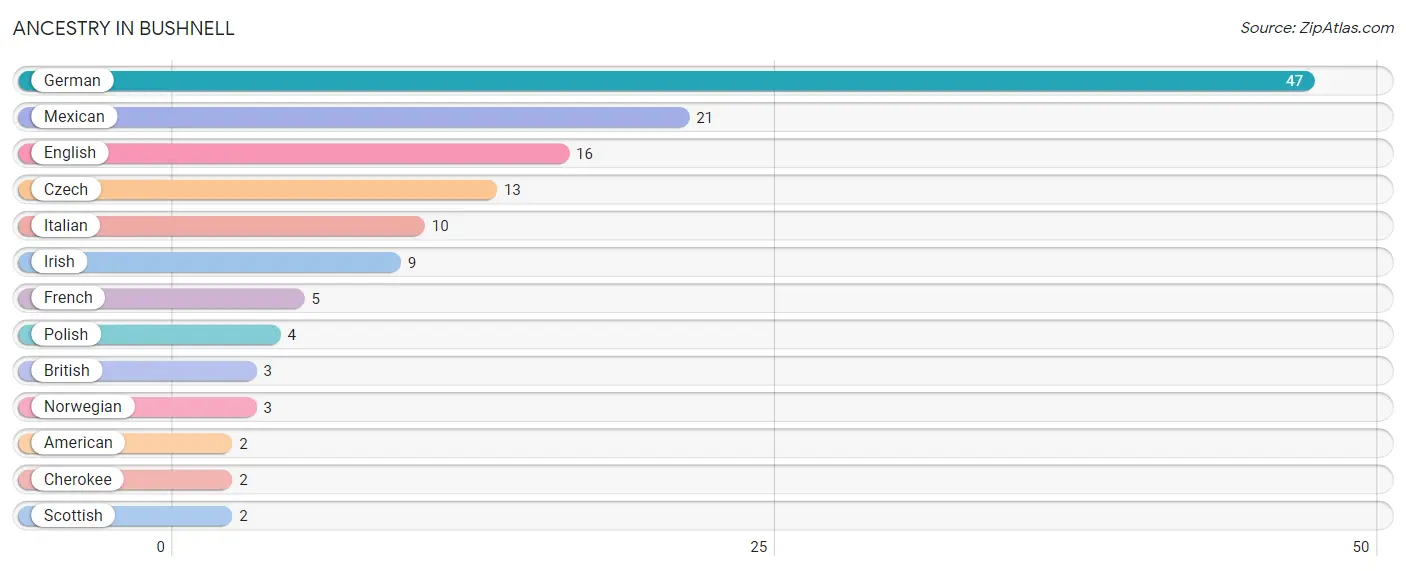
Ancestry in Bushnell
The most populous ancestries reported in Bushnell are German (47 | 33.3%), Mexican (21 | 14.9%), English (16 | 11.4%), Czech (13 | 9.2%), and Italian (10 | 7.1%), together accounting for 75.9% of all Bushnell residents.
| Ancestry | # Population | % Population |
| American | 2 | 1.4% |
| British | 3 | 2.1% |
| Cherokee | 2 | 1.4% |
| Czech | 13 | 9.2% |
| English | 16 | 11.4% |
| French | 5 | 3.5% |
| German | 47 | 33.3% |
| Irish | 9 | 6.4% |
| Italian | 10 | 7.1% |
| Mexican | 21 | 14.9% |
| Norwegian | 3 | 2.1% |
| Polish | 4 | 2.8% |
| Scottish | 2 | 1.4% | View All 13 Rows |
Immigrants in Bushnell

| Immigration Origin | # Population | % Population | View All 0 Rows |
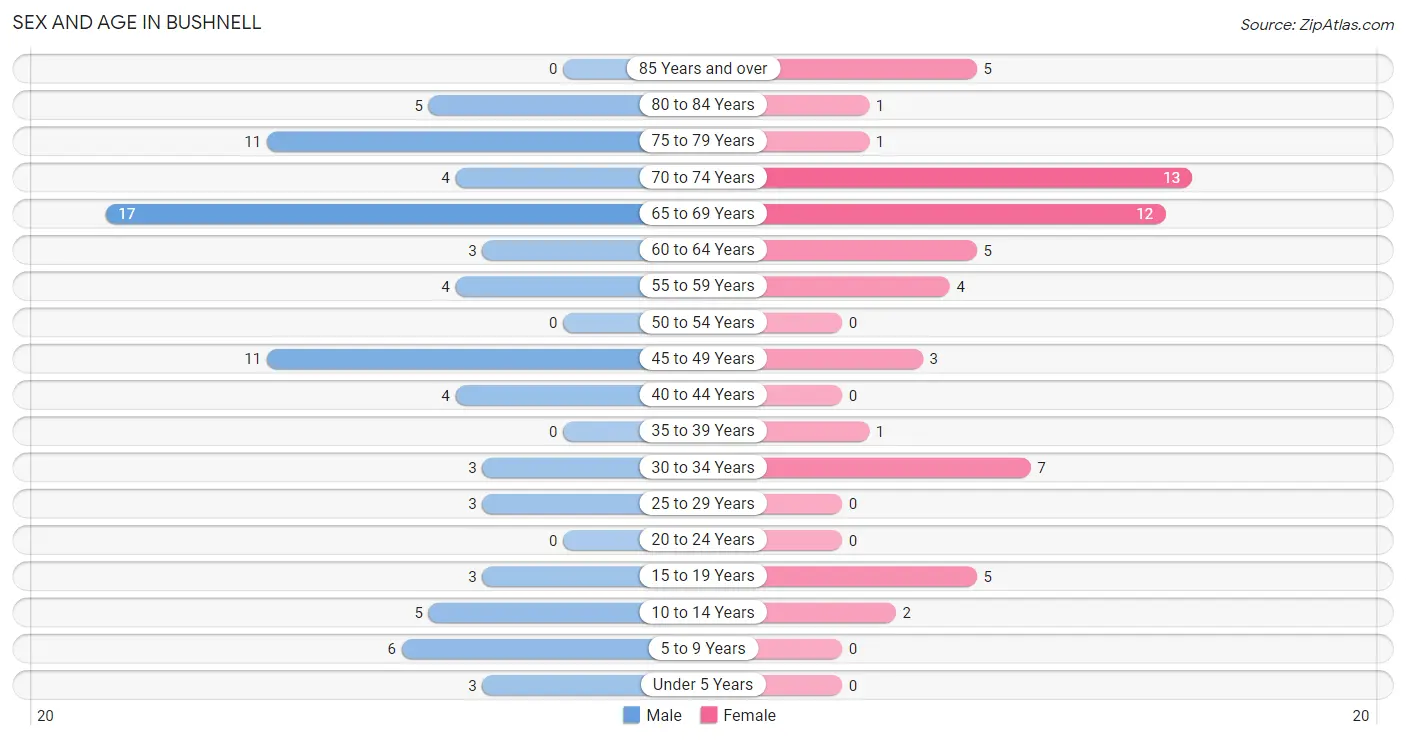
Sex and Age in Bushnell
Sex and Age in Bushnell
The most populous age groups in Bushnell are 65 to 69 Years (17 | 20.7%) for men and 70 to 74 Years (13 | 22.0%) for women.
| Age Bracket | Male | Female |
| Under 5 Years | 3 (3.7%) | 0 (0.0%) |
| 5 to 9 Years | 6 (7.3%) | 0 (0.0%) |
| 10 to 14 Years | 5 (6.1%) | 2 (3.4%) |
| 15 to 19 Years | 3 (3.7%) | 5 (8.5%) |
| 20 to 24 Years | 0 (0.0%) | 0 (0.0%) |
| 25 to 29 Years | 3 (3.7%) | 0 (0.0%) |
| 30 to 34 Years | 3 (3.7%) | 7 (11.9%) |
| 35 to 39 Years | 0 (0.0%) | 1 (1.7%) |
| 40 to 44 Years | 4 (4.9%) | 0 (0.0%) |
| 45 to 49 Years | 11 (13.4%) | 3 (5.1%) |
| 50 to 54 Years | 0 (0.0%) | 0 (0.0%) |
| 55 to 59 Years | 4 (4.9%) | 4 (6.8%) |
| 60 to 64 Years | 3 (3.7%) | 5 (8.5%) |
| 65 to 69 Years | 17 (20.7%) | 12 (20.3%) |
| 70 to 74 Years | 4 (4.9%) | 13 (22.0%) |
| 75 to 79 Years | 11 (13.4%) | 1 (1.7%) |
| 80 to 84 Years | 5 (6.1%) | 1 (1.7%) |
| 85 Years and over | 0 (0.0%) | 5 (8.5%) |
| Total | 82 (100.0%) | 59 (100.0%) |
Families and Households in Bushnell
Median Family Size in Bushnell
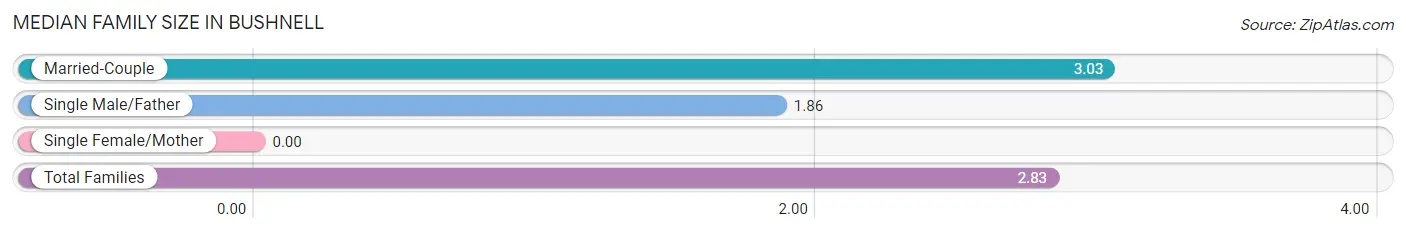
| Family Type | # Families | Family Size |
| Married-Couple | 34 (82.9%) | 3.03 |
| Single Male/Father | 7 (17.1%) | 1.86 |
| Single Female/Mother | 0 (0.0%) | - |
| Total Families | 41 (100.0%) | 2.83 |
Median Household Size in Bushnell
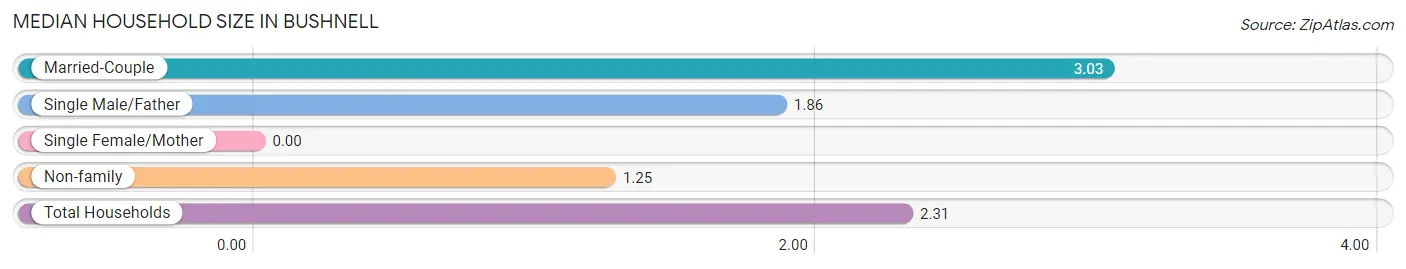
| Household Type | # Households | Household Size |
| Married-Couple | 34 (55.7%) | 3.03 |
| Single Male/Father | 7 (11.5%) | 1.86 |
| Single Female/Mother | 0 (0.0%) | - |
| Non-family | 20 (32.8%) | 1.25 |
| Total Households | 61 (100.0%) | 2.31 |
Household Size by Marriage Status in Bushnell
Out of a total of 61 households in Bushnell, 41 (67.2%) are family households, while 20 (32.8%) are nonfamily households. The most numerous type of family households are 2-person households, comprising 29, and the most common type of nonfamily households are 1-person households, comprising 15.
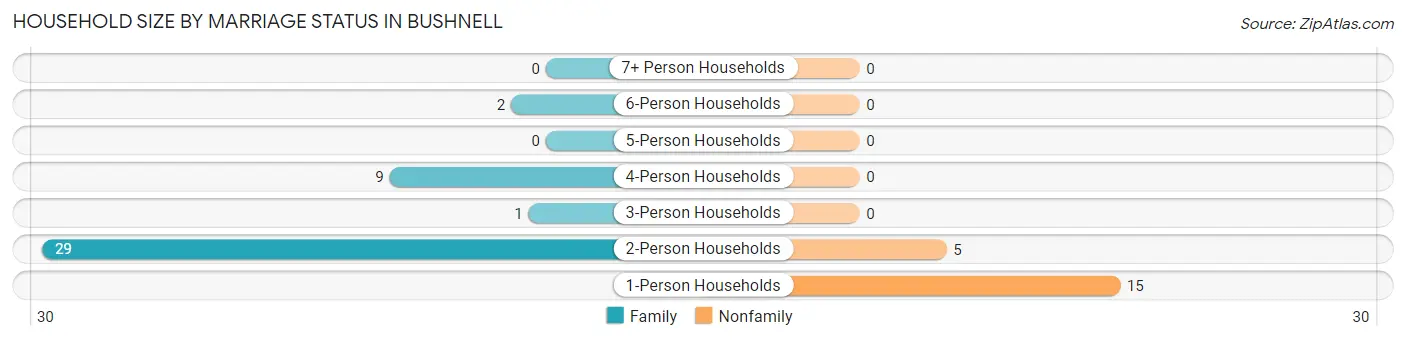
| Household Size | Family Households | Nonfamily Households |
| 1-Person Households | - | 15 (24.6%) |
| 2-Person Households | 29 (47.5%) | 5 (8.2%) |
| 3-Person Households | 1 (1.6%) | 0 (0.0%) |
| 4-Person Households | 9 (14.7%) | 0 (0.0%) |
| 5-Person Households | 0 (0.0%) | 0 (0.0%) |
| 6-Person Households | 2 (3.3%) | 0 (0.0%) |
| 7+ Person Households | 0 (0.0%) | 0 (0.0%) |
| Total | 41 (67.2%) | 20 (32.8%) |
Female Fertility in Bushnell
Fertility by Age in Bushnell
Average fertility rate in Bushnell is 313.0 births per 1,000 women. Women in the age bracket of 15 to 19 years have the highest fertility rate with 1,000.0 births per 1,000 women. Women in the age bracket of 15 to 19 years acount for 100.0% of all women with births.
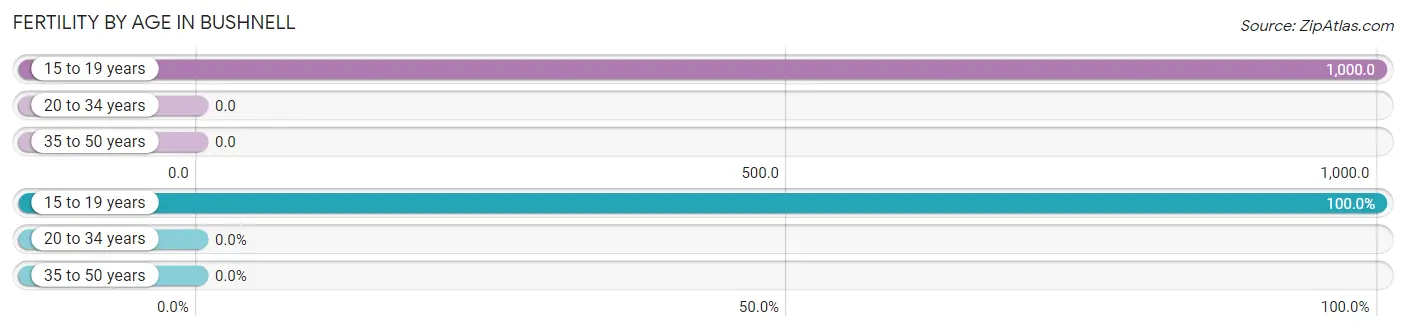
| Age Bracket | Women with Births | Births / 1,000 Women |
| 15 to 19 years | 5 (100.0%) | 1,000.0 |
| 20 to 34 years | 0 (0.0%) | 0.0 |
| 35 to 50 years | 0 (0.0%) | 0.0 |
| Total | 5 (100.0%) | 313.0 |
Fertility by Age by Marriage Status in Bushnell
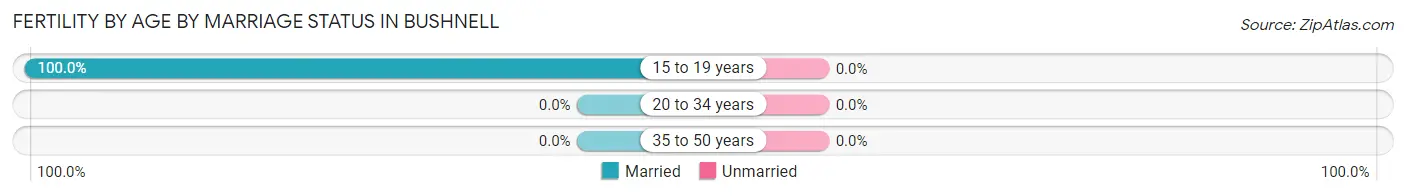
| Age Bracket | Married | Unmarried |
| 15 to 19 years | 5 (100.0%) | 0 (0.0%) |
| 20 to 34 years | 0 (0.0%) | 0 (0.0%) |
| 35 to 50 years | 0 (0.0%) | 0 (0.0%) |
| Total | 5 (100.0%) | 0 (0.0%) |
Fertility by Education in Bushnell
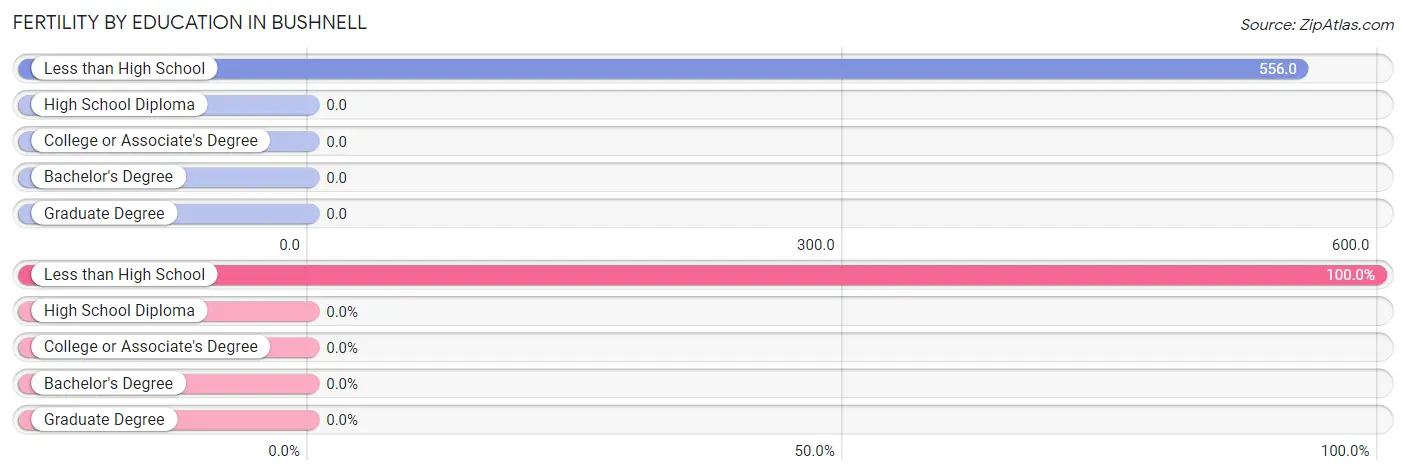
| Educational Attainment | Women with Births | Births / 1,000 Women |
| Less than High School | 5 (100.0%) | 556.0 |
| High School Diploma | 0 (0.0%) | 0.0 |
| College or Associate's Degree | 0 (0.0%) | 0.0 |
| Bachelor's Degree | 0 (0.0%) | 0.0 |
| Graduate Degree | 0 (0.0%) | 0.0 |
| Total | 5 (100.0%) | 313.0 |
Fertility by Education by Marriage Status in Bushnell
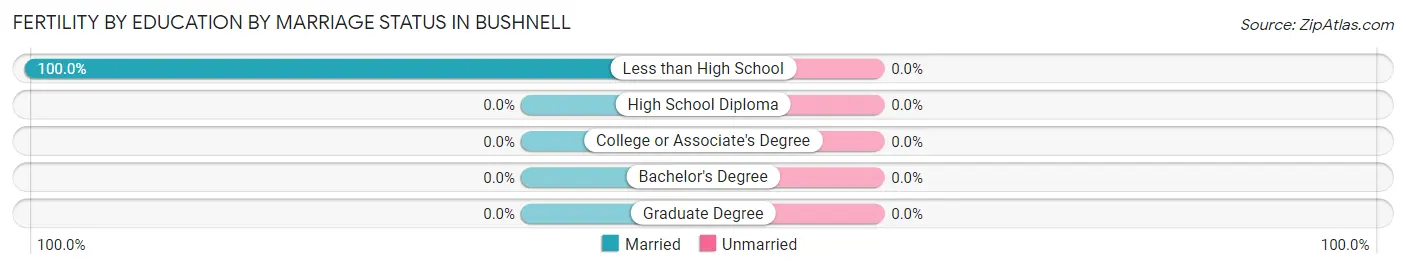
| Educational Attainment | Married | Unmarried |
| Less than High School | 5 (100.0%) | 0 (0.0%) |
| High School Diploma | 0 (0.0%) | 0 (0.0%) |
| College or Associate's Degree | 0 (0.0%) | 0 (0.0%) |
| Bachelor's Degree | 0 (0.0%) | 0 (0.0%) |
| Graduate Degree | 0 (0.0%) | 0 (0.0%) |
| Total | 5 (100.0%) | 0 (0.0%) |
Income in Bushnell
Income Overview in Bushnell
Per Capita Income in Bushnell is $17,135, while median incomes of families and households are $29,250 and $28,750 respectively.
| Characteristic | Number | Measure |
| Per Capita Income | 141 | $17,135 |
| Median Family Income | 41 | $29,250 |
| Mean Family Income | 41 | $34,320 |
| Median Household Income | 61 | $28,750 |
| Mean Household Income | 61 | $36,530 |
| Income Deficit | 41 | $0 |
| Wage / Income Gap (%) | 141 | 0.00% |
| Wage / Income Gap ($) | 141 | 100.00¢ per $1 |
| Gini / Inequality Index | 141 | 0.38 |
Earnings by Sex in Bushnell
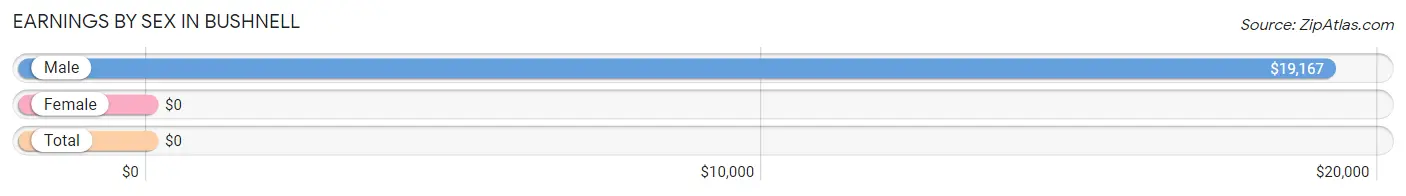
| Sex | Number | Average Earnings |
| Male | 24 (58.5%) | $19,167 |
| Female | 17 (41.5%) | $0 |
| Total | 41 (100.0%) | $0 |
Earnings by Sex by Income Bracket in Bushnell
The most common earnings brackets in Bushnell are $35,000 to $39,999 for men (4 | 16.7%) and $7,500 to $9,999 for women (8 | 47.1%).
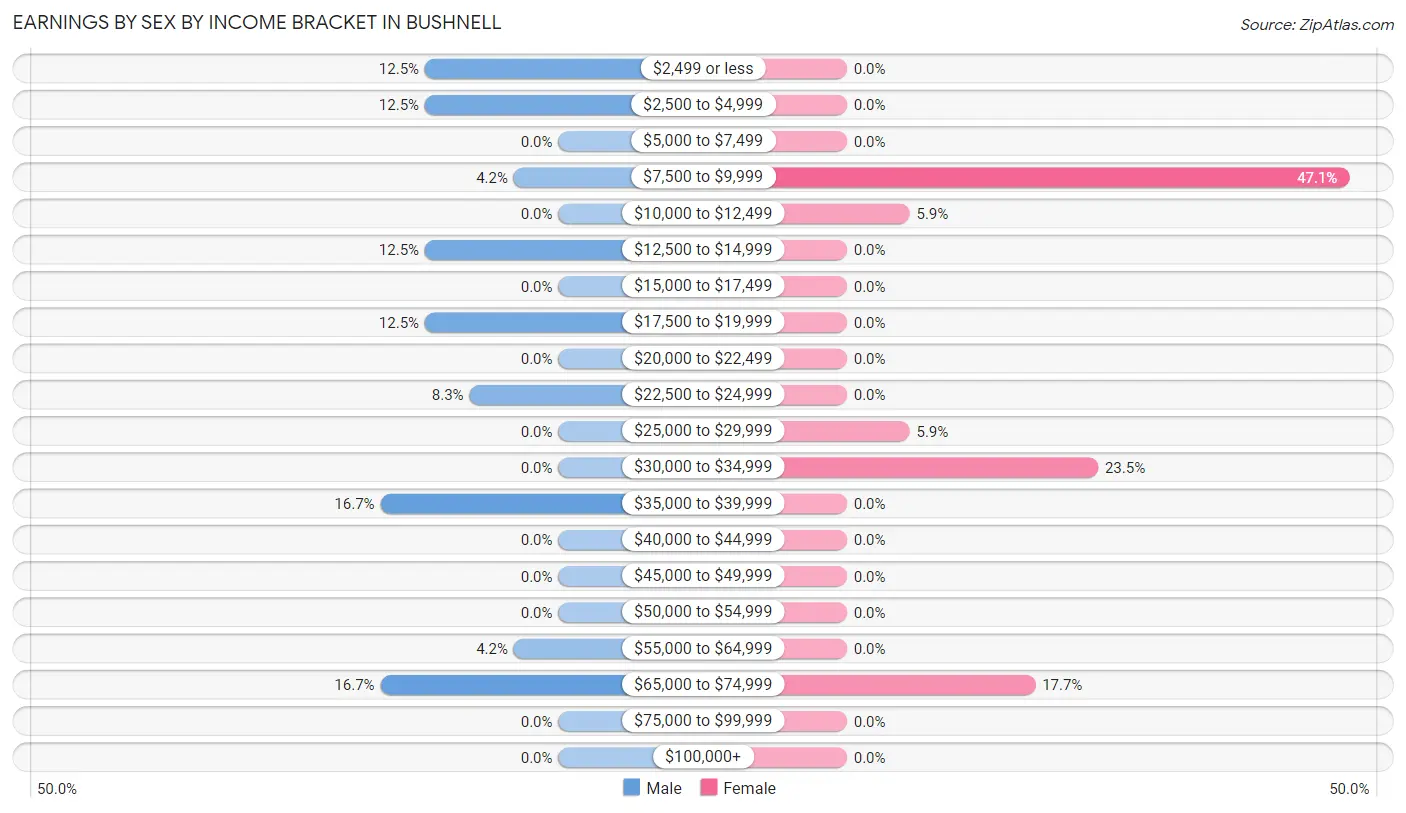
| Income | Male | Female |
| $2,499 or less | 3 (12.5%) | 0 (0.0%) |
| $2,500 to $4,999 | 3 (12.5%) | 0 (0.0%) |
| $5,000 to $7,499 | 0 (0.0%) | 0 (0.0%) |
| $7,500 to $9,999 | 1 (4.2%) | 8 (47.1%) |
| $10,000 to $12,499 | 0 (0.0%) | 1 (5.9%) |
| $12,500 to $14,999 | 3 (12.5%) | 0 (0.0%) |
| $15,000 to $17,499 | 0 (0.0%) | 0 (0.0%) |
| $17,500 to $19,999 | 3 (12.5%) | 0 (0.0%) |
| $20,000 to $22,499 | 0 (0.0%) | 0 (0.0%) |
| $22,500 to $24,999 | 2 (8.3%) | 0 (0.0%) |
| $25,000 to $29,999 | 0 (0.0%) | 1 (5.9%) |
| $30,000 to $34,999 | 0 (0.0%) | 4 (23.5%) |
| $35,000 to $39,999 | 4 (16.7%) | 0 (0.0%) |
| $40,000 to $44,999 | 0 (0.0%) | 0 (0.0%) |
| $45,000 to $49,999 | 0 (0.0%) | 0 (0.0%) |
| $50,000 to $54,999 | 0 (0.0%) | 0 (0.0%) |
| $55,000 to $64,999 | 1 (4.2%) | 0 (0.0%) |
| $65,000 to $74,999 | 4 (16.7%) | 3 (17.6%) |
| $75,000 to $99,999 | 0 (0.0%) | 0 (0.0%) |
| $100,000+ | 0 (0.0%) | 0 (0.0%) |
| Total | 24 (100.0%) | 17 (100.0%) |
Earnings by Sex by Educational Attainment in Bushnell
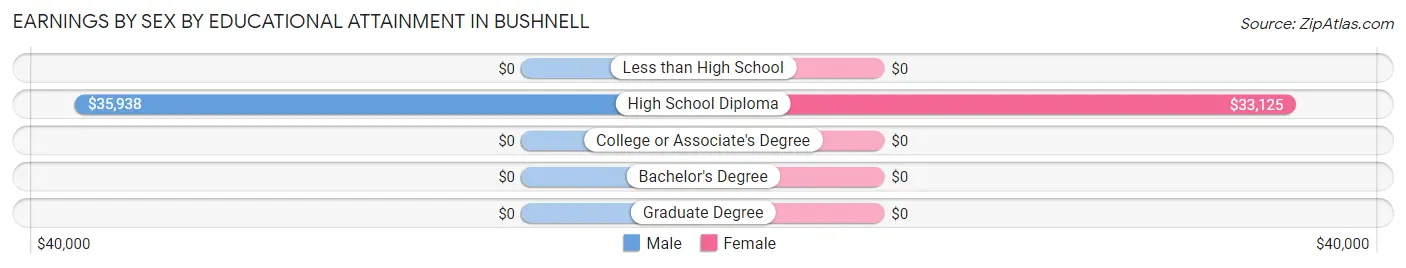
| Educational Attainment | Male Income | Female Income |
| Less than High School | - | - |
| High School Diploma | $35,938 | $33,125 |
| College or Associate's Degree | - | - |
| Bachelor's Degree | - | - |
| Graduate Degree | - | - |
| Total | $23,125 | $0 |
Family Income in Bushnell
Family Income Brackets in Bushnell
According to the Bushnell family income data, there are 15 families falling into the $15,000 to $24,999 income range, which is the most common income bracket and makes up 36.6% of all families.
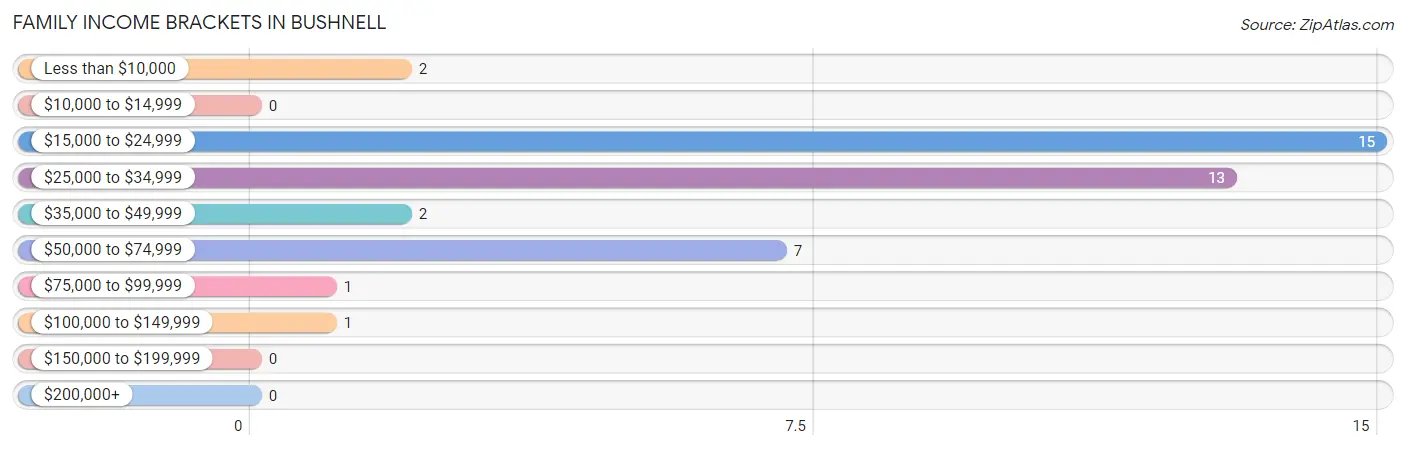
| Income Bracket | # Families | % Families |
| Less than $10,000 | 2 | 4.9% |
| $10,000 to $14,999 | 0 | 0.0% |
| $15,000 to $24,999 | 15 | 36.6% |
| $25,000 to $34,999 | 13 | 31.7% |
| $35,000 to $49,999 | 2 | 4.9% |
| $50,000 to $74,999 | 7 | 17.1% |
| $75,000 to $99,999 | 1 | 2.4% |
| $100,000 to $149,999 | 1 | 2.4% |
| $150,000 to $199,999 | 0 | 0.0% |
| $200,000+ | 0 | 0.0% |
Family Income by Famaliy Size in Bushnell
2-person families (29 | 70.7%) account for the highest median family income in Bushnell with $32,969 per family, while 2-person families (29 | 70.7%) have the highest median income of $16,484 per family member.
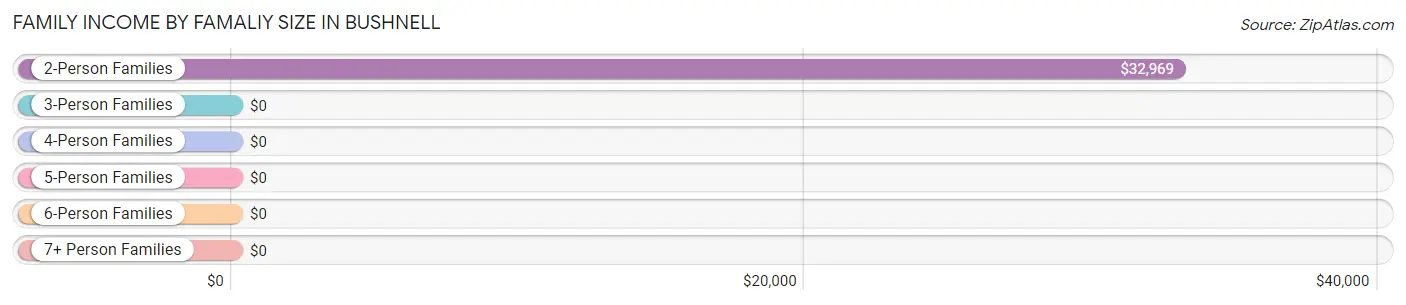
| Income Bracket | # Families | Median Income |
| 2-Person Families | 29 (70.7%) | $32,969 |
| 3-Person Families | 1 (2.4%) | $0 |
| 4-Person Families | 9 (22.0%) | $0 |
| 5-Person Families | 0 (0.0%) | $0 |
| 6-Person Families | 2 (4.9%) | $0 |
| 7+ Person Families | 0 (0.0%) | $0 |
| Total | 41 (100.0%) | $29,250 |
Family Income by Number of Earners in Bushnell
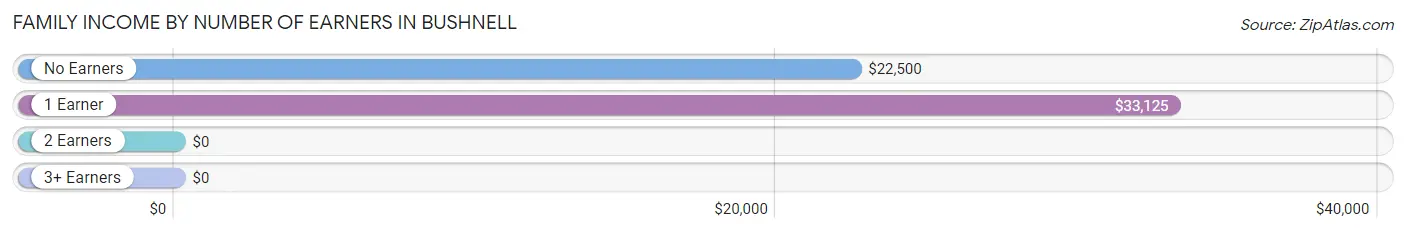
| Number of Earners | # Families | Median Income |
| No Earners | 14 (34.2%) | $22,500 |
| 1 Earner | 24 (58.5%) | $33,125 |
| 2 Earners | 3 (7.3%) | $0 |
| 3+ Earners | 0 (0.0%) | $0 |
| Total | 41 (100.0%) | $29,250 |
Household Income in Bushnell
Household Income Brackets in Bushnell
With 23 households falling in the category, the $15,000 to $24,999 income range is the most frequent in Bushnell, accounting for 37.7% of all households.
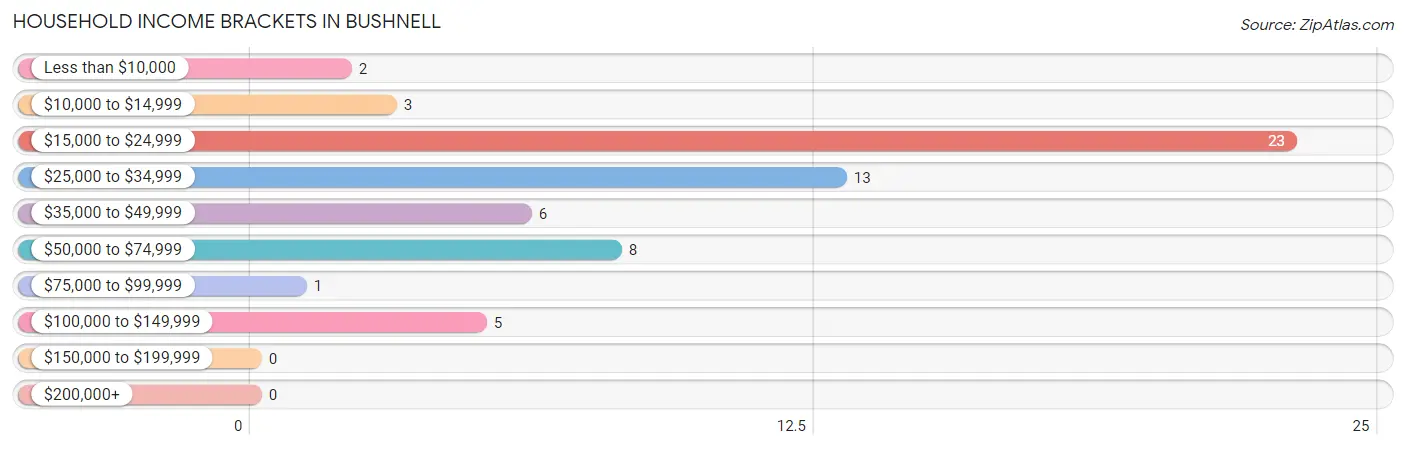
| Income Bracket | # Households | % Households |
| Less than $10,000 | 2 | 3.3% |
| $10,000 to $14,999 | 3 | 4.9% |
| $15,000 to $24,999 | 23 | 37.7% |
| $25,000 to $34,999 | 13 | 21.3% |
| $35,000 to $49,999 | 6 | 9.8% |
| $50,000 to $74,999 | 8 | 13.1% |
| $75,000 to $99,999 | 1 | 1.6% |
| $100,000 to $149,999 | 5 | 8.2% |
| $150,000 to $199,999 | 0 | 0.0% |
| $200,000+ | 0 | 0.0% |
Household Income by Householder Age in Bushnell
The median household income in Bushnell is $28,750, with the highest median household income of $32,656 found in the 65+ years age bracket for the primary householder. A total of 31 households (50.8%) fall into this category.
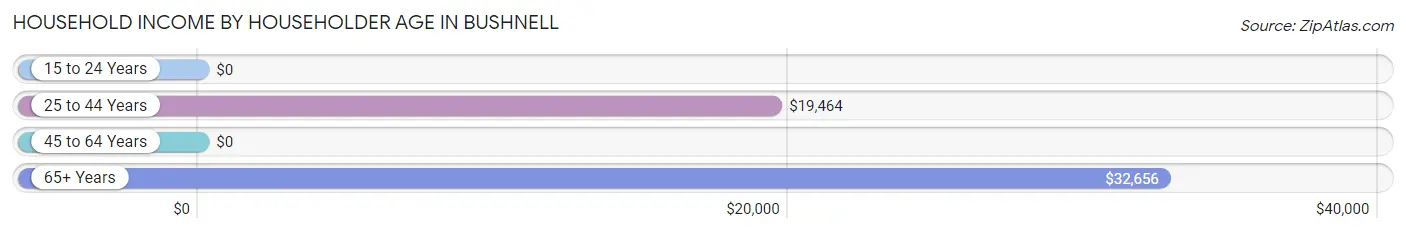
| Income Bracket | # Households | Median Income |
| 15 to 24 Years | 0 (0.0%) | $0 |
| 25 to 44 Years | 11 (18.0%) | $19,464 |
| 45 to 64 Years | 19 (31.1%) | $0 |
| 65+ Years | 31 (50.8%) | $32,656 |
| Total | 61 (100.0%) | $28,750 |
Poverty in Bushnell
Income Below Poverty by Sex and Age in Bushnell
With 34.2% poverty level for males and 27.1% for females among the residents of Bushnell, 5 year old males and 12 to 14 year old females are the most vulnerable to poverty, with 6 males (100.0%) and 2 females (100.0%) in their respective age groups living below the poverty level.
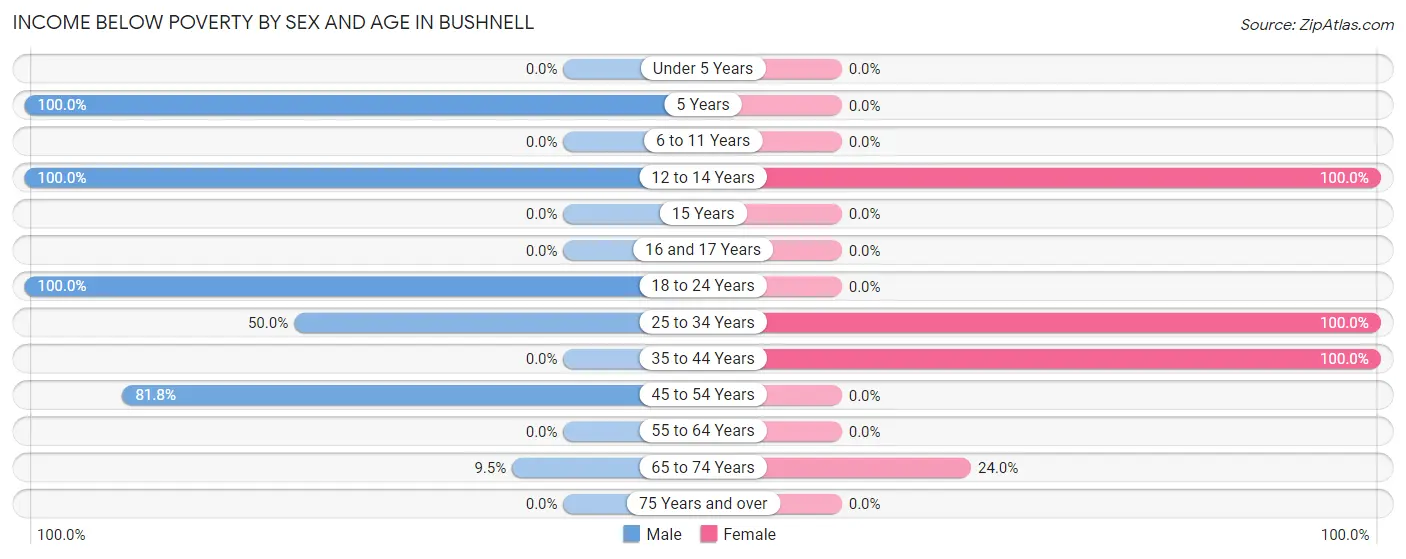
| Age Bracket | Male | Female |
| Under 5 Years | 0 (0.0%) | 0 (0.0%) |
| 5 Years | 6 (100.0%) | 0 (0.0%) |
| 6 to 11 Years | 0 (0.0%) | 0 (0.0%) |
| 12 to 14 Years | 5 (100.0%) | 2 (100.0%) |
| 15 Years | 0 (0.0%) | 0 (0.0%) |
| 16 and 17 Years | 0 (0.0%) | 0 (0.0%) |
| 18 to 24 Years | 3 (100.0%) | 0 (0.0%) |
| 25 to 34 Years | 3 (50.0%) | 7 (100.0%) |
| 35 to 44 Years | 0 (0.0%) | 1 (100.0%) |
| 45 to 54 Years | 9 (81.8%) | 0 (0.0%) |
| 55 to 64 Years | 0 (0.0%) | 0 (0.0%) |
| 65 to 74 Years | 2 (9.5%) | 6 (24.0%) |
| 75 Years and over | 0 (0.0%) | 0 (0.0%) |
| Total | 28 (34.2%) | 16 (27.1%) |
Income Above Poverty by Sex and Age in Bushnell
According to the poverty statistics in Bushnell, males aged under 5 years and females aged 18 to 24 years are the age groups that are most secure financially, with 100.0% of males and 100.0% of females in these age groups living above the poverty line.
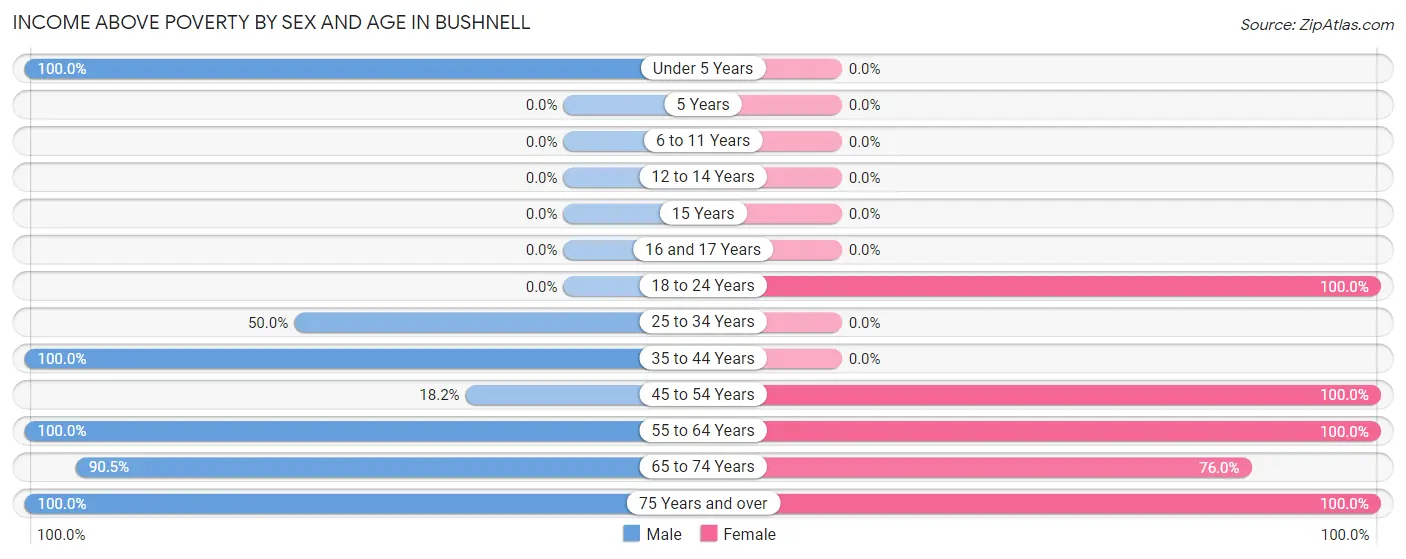
| Age Bracket | Male | Female |
| Under 5 Years | 3 (100.0%) | 0 (0.0%) |
| 5 Years | 0 (0.0%) | 0 (0.0%) |
| 6 to 11 Years | 0 (0.0%) | 0 (0.0%) |
| 12 to 14 Years | 0 (0.0%) | 0 (0.0%) |
| 15 Years | 0 (0.0%) | 0 (0.0%) |
| 16 and 17 Years | 0 (0.0%) | 0 (0.0%) |
| 18 to 24 Years | 0 (0.0%) | 5 (100.0%) |
| 25 to 34 Years | 3 (50.0%) | 0 (0.0%) |
| 35 to 44 Years | 4 (100.0%) | 0 (0.0%) |
| 45 to 54 Years | 2 (18.2%) | 3 (100.0%) |
| 55 to 64 Years | 7 (100.0%) | 9 (100.0%) |
| 65 to 74 Years | 19 (90.5%) | 19 (76.0%) |
| 75 Years and over | 16 (100.0%) | 7 (100.0%) |
| Total | 54 (65.8%) | 43 (72.9%) |
Income Below Poverty Among Married-Couple Families in Bushnell
The poverty statistics for married-couple families in Bushnell show that 26.5% or 9 of the total 34 families live below the poverty line. Families with 1 or 2 children have the highest poverty rate of 81.8%, comprising of 9 families. On the other hand, families with no children have the lowest poverty rate of 0.0%, which includes 0 families.
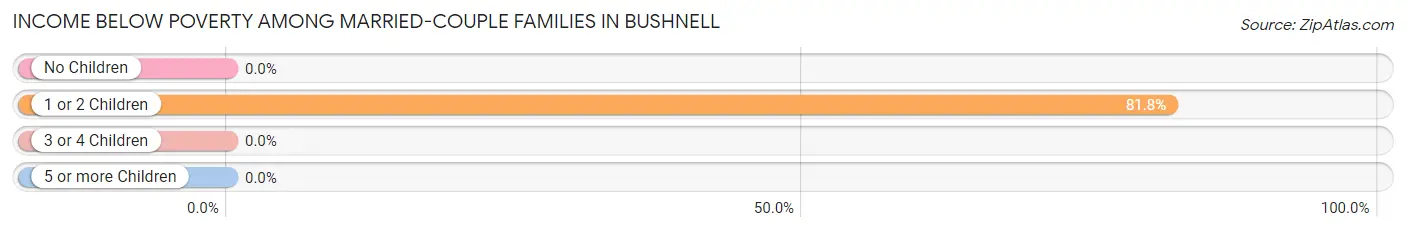
| Children | Above Poverty | Below Poverty |
| No Children | 23 (100.0%) | 0 (0.0%) |
| 1 or 2 Children | 2 (18.2%) | 9 (81.8%) |
| 3 or 4 Children | 0 (0.0%) | 0 (0.0%) |
| 5 or more Children | 0 (0.0%) | 0 (0.0%) |
| Total | 25 (73.5%) | 9 (26.5%) |
Income Below Poverty Among Single-Parent Households in Bushnell
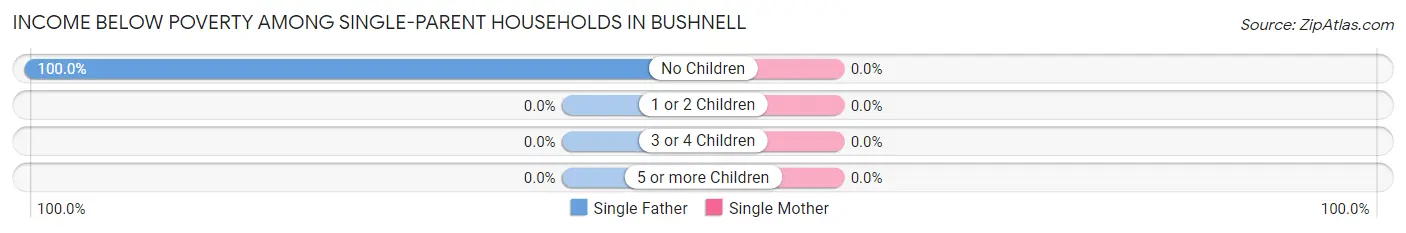
| Children | Single Father | Single Mother |
| No Children | 7 (100.0%) | 0 (0.0%) |
| 1 or 2 Children | 0 (0.0%) | 0 (0.0%) |
| 3 or 4 Children | 0 (0.0%) | 0 (0.0%) |
| 5 or more Children | 0 (0.0%) | 0 (0.0%) |
| Total | 7 (100.0%) | 0 (0.0%) |
Income Below Poverty Among Married-Couple vs Single-Parent Households in Bushnell
The poverty data for Bushnell shows that 9 of the married-couple family households (26.5%) and 7 of the single-parent households (100.0%) are living below the poverty level. Within the married-couple family households, those with 1 or 2 children have the highest poverty rate, with 9 households (81.8%) falling below the poverty line. Among the single-parent households, those with no children have the highest poverty rate, with 7 household (100.0%) living below poverty.
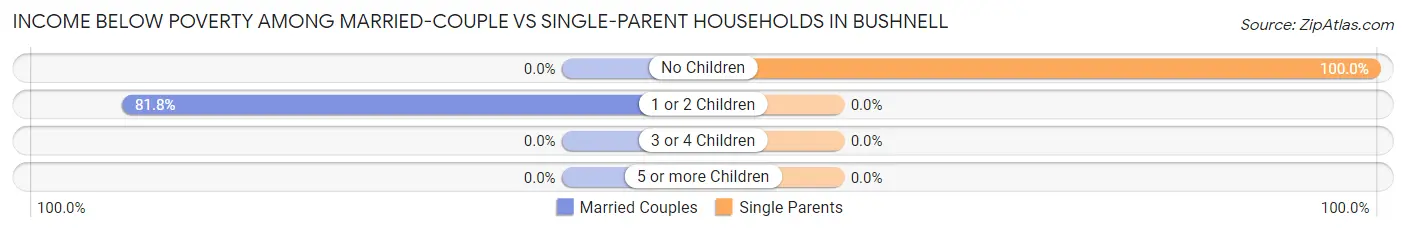
| Children | Married-Couple Families | Single-Parent Households |
| No Children | 0 (0.0%) | 7 (100.0%) |
| 1 or 2 Children | 9 (81.8%) | 0 (0.0%) |
| 3 or 4 Children | 0 (0.0%) | 0 (0.0%) |
| 5 or more Children | 0 (0.0%) | 0 (0.0%) |
| Total | 9 (26.5%) | 7 (100.0%) |
Employment Characteristics in Bushnell
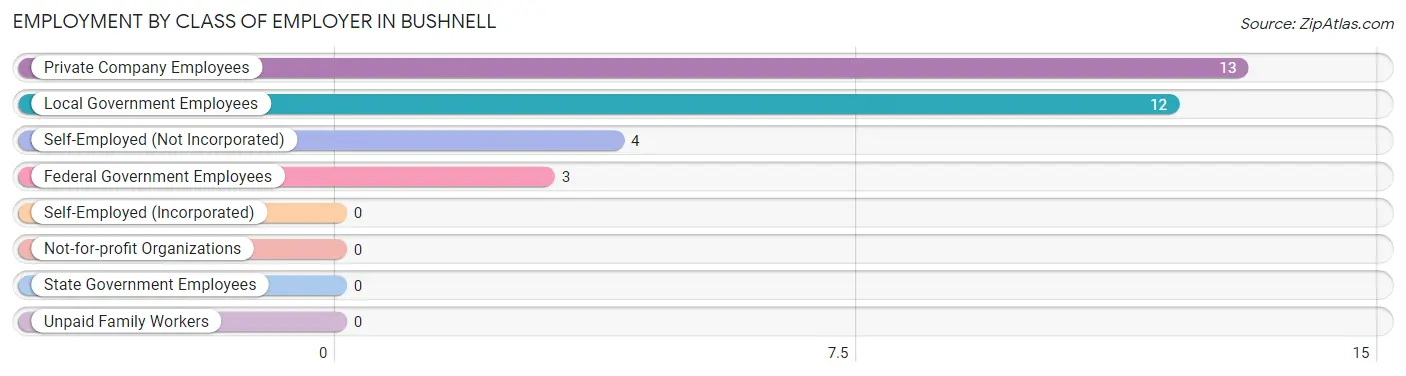
Employment by Class of Employer in Bushnell
Among the 32 employed individuals in Bushnell, private company employees (13 | 40.6%), local government employees (12 | 37.5%), and self-employed (not incorporated) (4 | 12.5%) make up the most common classes of employment.
| Employer Class | # Employees | % Employees |
| Private Company Employees | 13 | 40.6% |
| Self-Employed (Incorporated) | 0 | 0.0% |
| Self-Employed (Not Incorporated) | 4 | 12.5% |
| Not-for-profit Organizations | 0 | 0.0% |
| Local Government Employees | 12 | 37.5% |
| State Government Employees | 0 | 0.0% |
| Federal Government Employees | 3 | 9.4% |
| Unpaid Family Workers | 0 | 0.0% |
| Total | 32 | 100.0% |
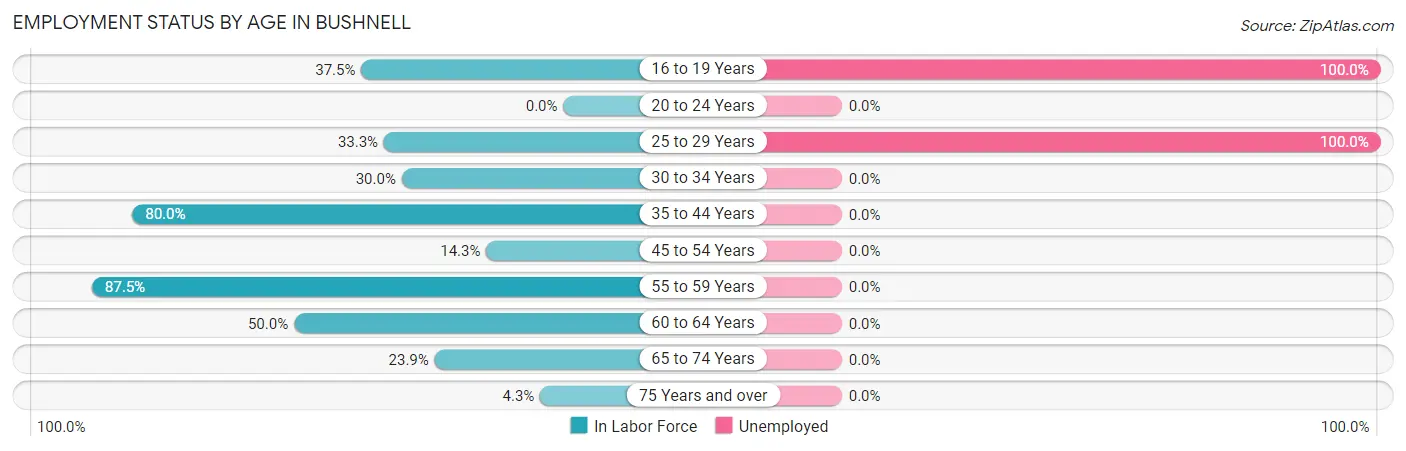
Employment Status by Age in Bushnell
According to the labor force statistics for Bushnell, out of the total population over 16 years of age (125), 28.8% or 36 individuals are in the labor force, with 11.1% or 4 of them unemployed. The age group with the highest labor force participation rate is 55 to 59 years, with 87.5% or 7 individuals in the labor force. Within the labor force, the 16 to 19 years age range has the highest percentage of unemployed individuals, with 100.0% or 3 of them being unemployed.
| Age Bracket | In Labor Force | Unemployed |
| 16 to 19 Years | 3 (37.5%) | 3 (100.0%) |
| 20 to 24 Years | 0 (0.0%) | 0 (0.0%) |
| 25 to 29 Years | 1 (33.3%) | 1 (100.0%) |
| 30 to 34 Years | 3 (30.0%) | 0 (0.0%) |
| 35 to 44 Years | 4 (80.0%) | 0 (0.0%) |
| 45 to 54 Years | 2 (14.3%) | 0 (0.0%) |
| 55 to 59 Years | 7 (87.5%) | 0 (0.0%) |
| 60 to 64 Years | 4 (50.0%) | 0 (0.0%) |
| 65 to 74 Years | 11 (23.9%) | 0 (0.0%) |
| 75 Years and over | 1 (4.3%) | 0 (0.0%) |
| Total | 36 (28.8%) | 4 (11.1%) |
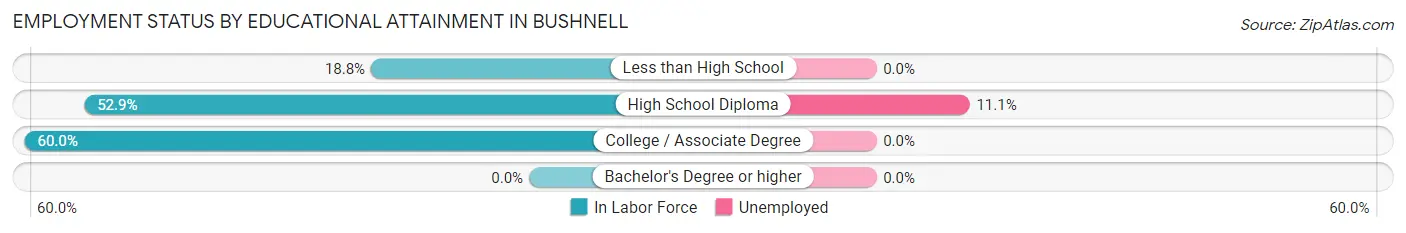
Employment Status by Educational Attainment in Bushnell
According to labor force statistics for Bushnell, 43.8% of individuals (21) out of the total population between 25 and 64 years of age (48) are in the labor force, with 4.8% or 1 of them being unemployed. The group with the highest labor force participation rate are those with the educational attainment of college / associate degree, with 60.0% or 9 individuals in the labor force. Within the labor force, individuals with high school diploma education have the highest percentage of unemployment, with 11.1% or 1 of them being unemployed.
| Educational Attainment | In Labor Force | Unemployed |
| Less than High School | 3 (18.8%) | 0 (0.0%) |
| High School Diploma | 9 (52.9%) | 2 (11.1%) |
| College / Associate Degree | 9 (60.0%) | 0 (0.0%) |
| Bachelor's Degree or higher | 0 (0.0%) | 0 (0.0%) |
| Total | 21 (43.8%) | 2 (4.8%) |
Employment Occupations by Sex in Bushnell
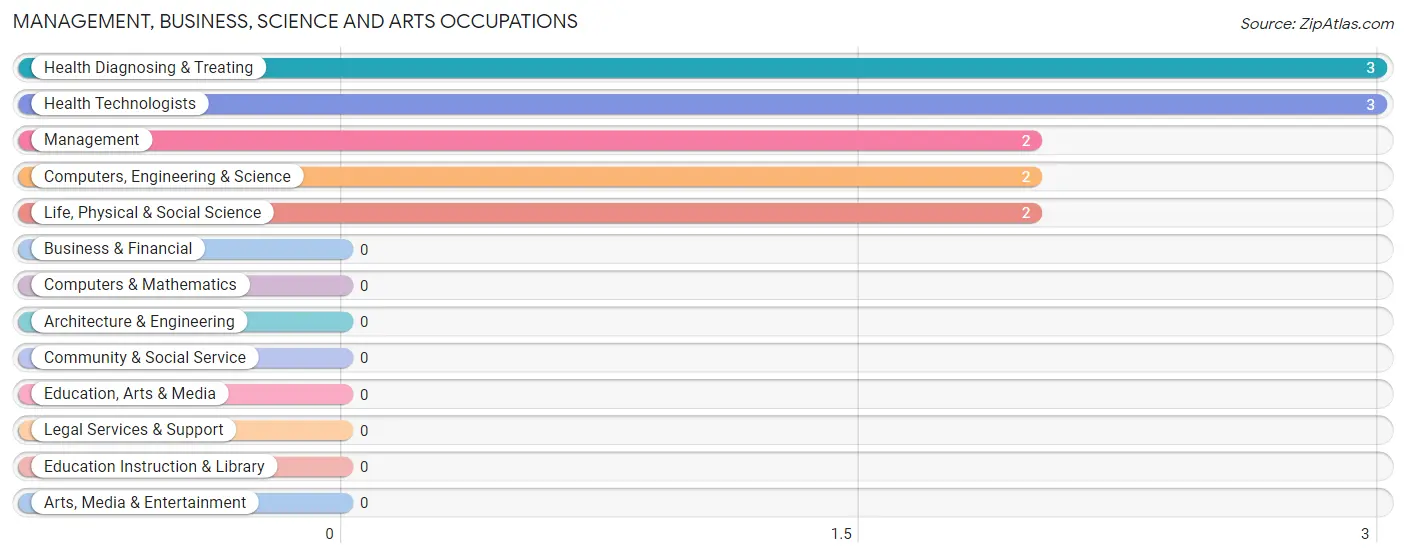
Management, Business, Science and Arts Occupations
The most common Management, Business, Science and Arts occupations in Bushnell are Health Diagnosing & Treating (3 | 9.4%), Health Technologists (3 | 9.4%), Management (2 | 6.2%), Computers, Engineering & Science (2 | 6.2%), and Life, Physical & Social Science (2 | 6.2%).
Management, Business, Science and Arts Occupations by Sex
Within the Management, Business, Science and Arts occupations in Bushnell, the most male-oriented occupations are Management (100.0%), Computers, Engineering & Science (100.0%), and Life, Physical & Social Science (100.0%), while the most female-oriented occupations are Health Diagnosing & Treating (100.0%), and Health Technologists (100.0%).
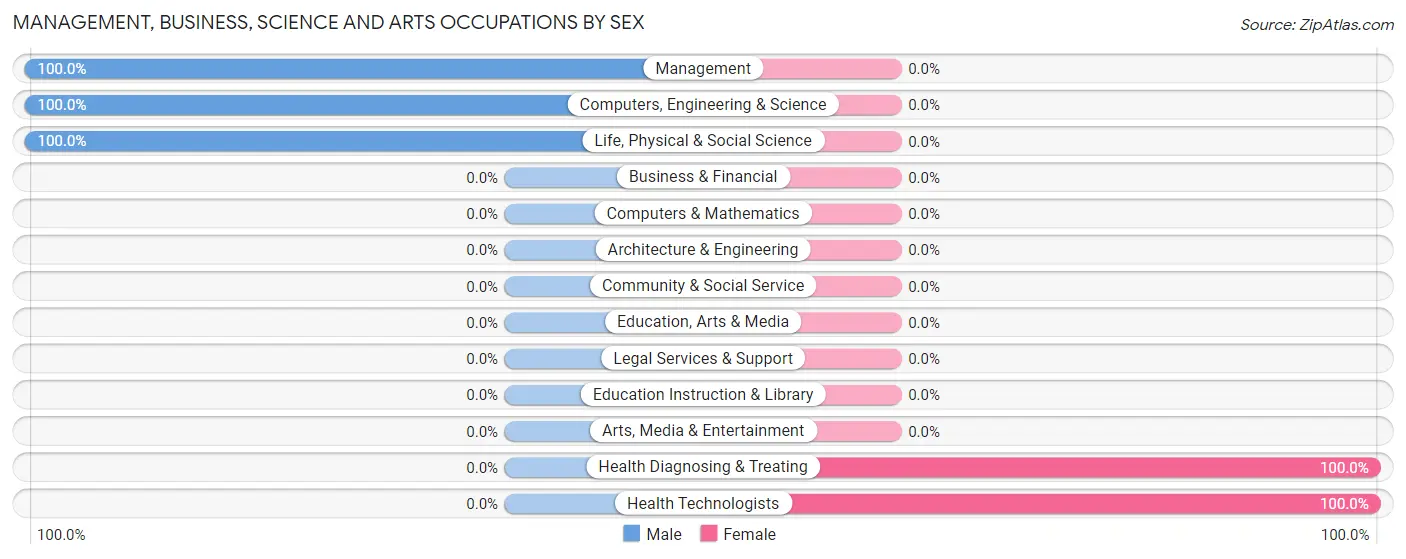
| Occupation | Male | Female |
| Management | 2 (100.0%) | 0 (0.0%) |
| Business & Financial | 0 (0.0%) | 0 (0.0%) |
| Computers, Engineering & Science | 2 (100.0%) | 0 (0.0%) |
| Computers & Mathematics | 0 (0.0%) | 0 (0.0%) |
| Architecture & Engineering | 0 (0.0%) | 0 (0.0%) |
| Life, Physical & Social Science | 2 (100.0%) | 0 (0.0%) |
| Community & Social Service | 0 (0.0%) | 0 (0.0%) |
| Education, Arts & Media | 0 (0.0%) | 0 (0.0%) |
| Legal Services & Support | 0 (0.0%) | 0 (0.0%) |
| Education Instruction & Library | 0 (0.0%) | 0 (0.0%) |
| Arts, Media & Entertainment | 0 (0.0%) | 0 (0.0%) |
| Health Diagnosing & Treating | 0 (0.0%) | 3 (100.0%) |
| Health Technologists | 0 (0.0%) | 3 (100.0%) |
| Total (Category) | 4 (57.1%) | 3 (42.9%) |
| Total (Overall) | 17 (53.1%) | 15 (46.9%) |
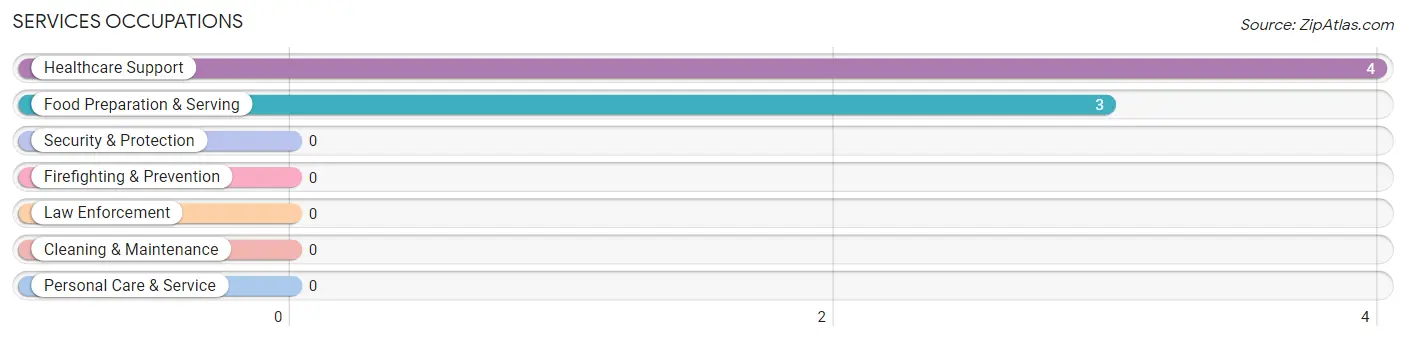
Services Occupations
The most common Services occupations in Bushnell are Healthcare Support (4 | 12.5%), and Food Preparation & Serving (3 | 9.4%).
Services Occupations by Sex
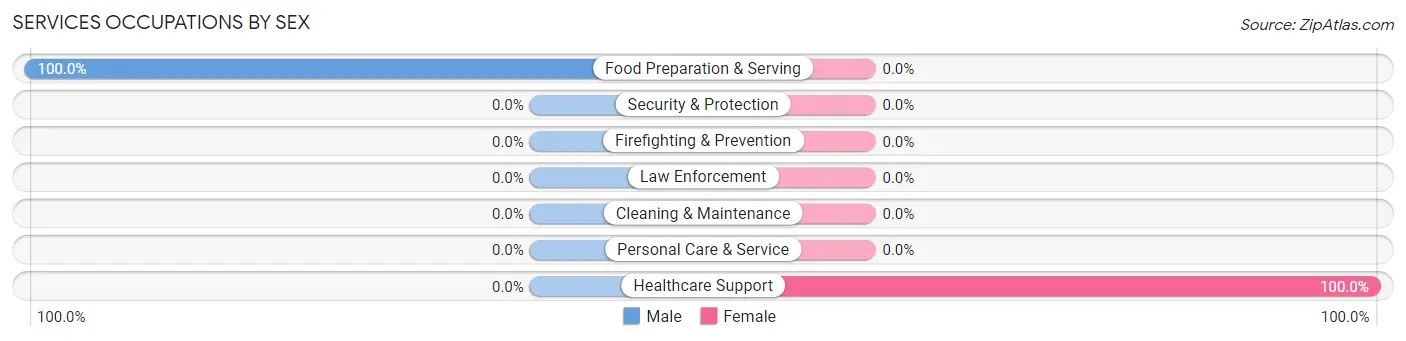
| Occupation | Male | Female |
| Healthcare Support | 0 (0.0%) | 4 (100.0%) |
| Security & Protection | 0 (0.0%) | 0 (0.0%) |
| Firefighting & Prevention | 0 (0.0%) | 0 (0.0%) |
| Law Enforcement | 0 (0.0%) | 0 (0.0%) |
| Food Preparation & Serving | 3 (100.0%) | 0 (0.0%) |
| Cleaning & Maintenance | 0 (0.0%) | 0 (0.0%) |
| Personal Care & Service | 0 (0.0%) | 0 (0.0%) |
| Total (Category) | 3 (42.9%) | 4 (57.1%) |
| Total (Overall) | 17 (53.1%) | 15 (46.9%) |
Sales and Office Occupations
The most common Sales and Office occupations in Bushnell are Office & Administration (8 | 25.0%), and Sales & Related (1 | 3.1%).

Sales and Office Occupations by Sex

| Occupation | Male | Female |
| Sales & Related | 1 (100.0%) | 0 (0.0%) |
| Office & Administration | 0 (0.0%) | 8 (100.0%) |
| Total (Category) | 1 (11.1%) | 8 (88.9%) |
| Total (Overall) | 17 (53.1%) | 15 (46.9%) |
Natural Resources, Construction and Maintenance Occupations
The most common Natural Resources, Construction and Maintenance occupations in Bushnell are , and Construction & Extraction (4 | 12.5%).
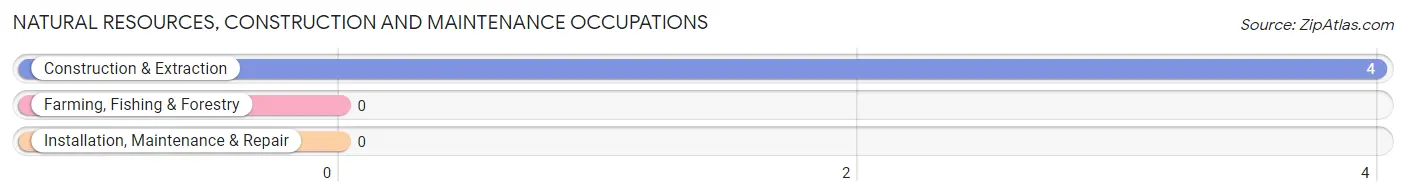
Natural Resources, Construction and Maintenance Occupations by Sex
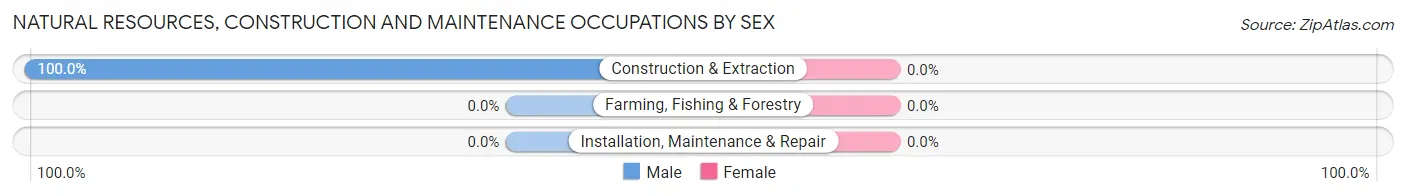
| Occupation | Male | Female |
| Farming, Fishing & Forestry | 0 (0.0%) | 0 (0.0%) |
| Construction & Extraction | 4 (100.0%) | 0 (0.0%) |
| Installation, Maintenance & Repair | 0 (0.0%) | 0 (0.0%) |
| Total (Category) | 4 (100.0%) | 0 (0.0%) |
| Total (Overall) | 17 (53.1%) | 15 (46.9%) |
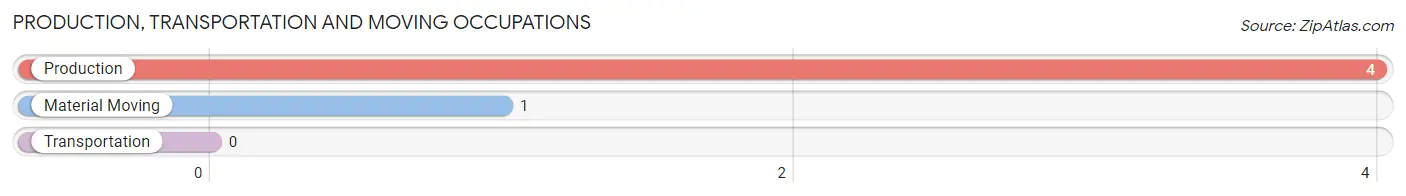
Production, Transportation and Moving Occupations
The most common Production, Transportation and Moving occupations in Bushnell are Production (4 | 12.5%), and Material Moving (1 | 3.1%).
Production, Transportation and Moving Occupations by Sex
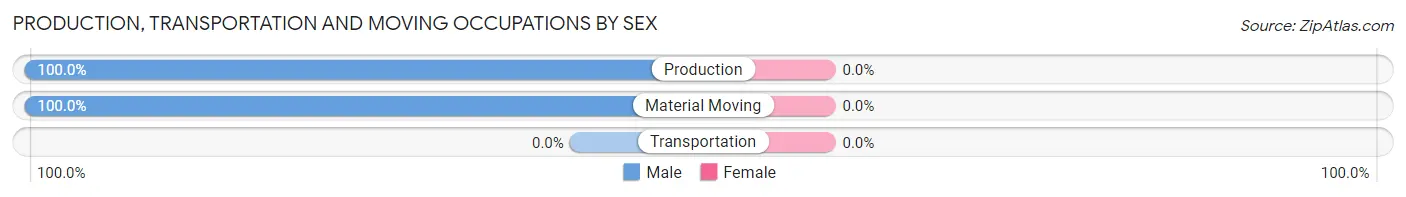
| Occupation | Male | Female |
| Production | 4 (100.0%) | 0 (0.0%) |
| Transportation | 0 (0.0%) | 0 (0.0%) |
| Material Moving | 1 (100.0%) | 0 (0.0%) |
| Total (Category) | 5 (100.0%) | 0 (0.0%) |
| Total (Overall) | 17 (53.1%) | 15 (46.9%) |
Employment Industries by Sex in Bushnell
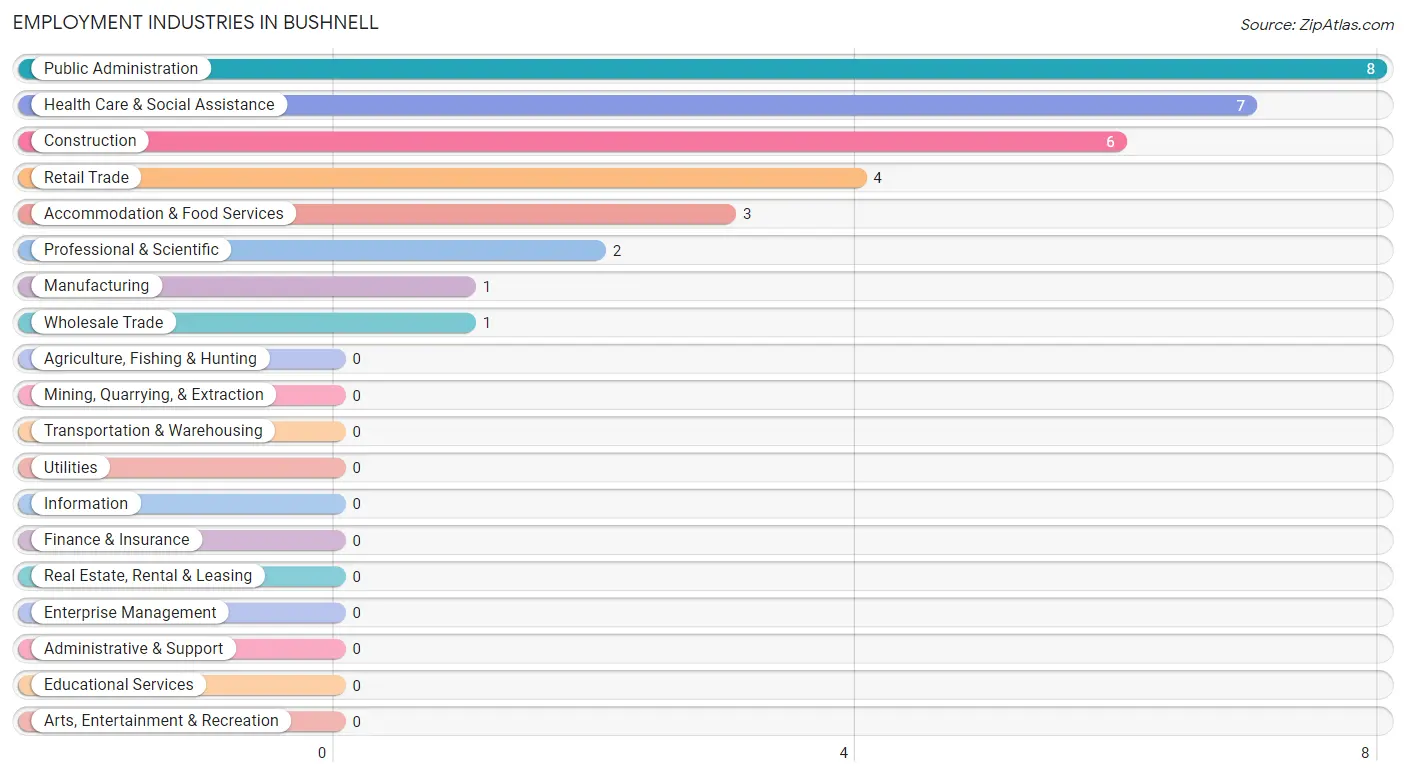
Employment Industries in Bushnell
The major employment industries in Bushnell include Public Administration (8 | 25.0%), Health Care & Social Assistance (7 | 21.9%), Construction (6 | 18.8%), Retail Trade (4 | 12.5%), and Accommodation & Food Services (3 | 9.4%).
Employment Industries by Sex in Bushnell
The Bushnell industries that see more men than women are Construction (100.0%), Manufacturing (100.0%), and Wholesale Trade (100.0%), whereas the industries that tend to have a higher number of women are Health Care & Social Assistance (100.0%), and Public Administration (100.0%).
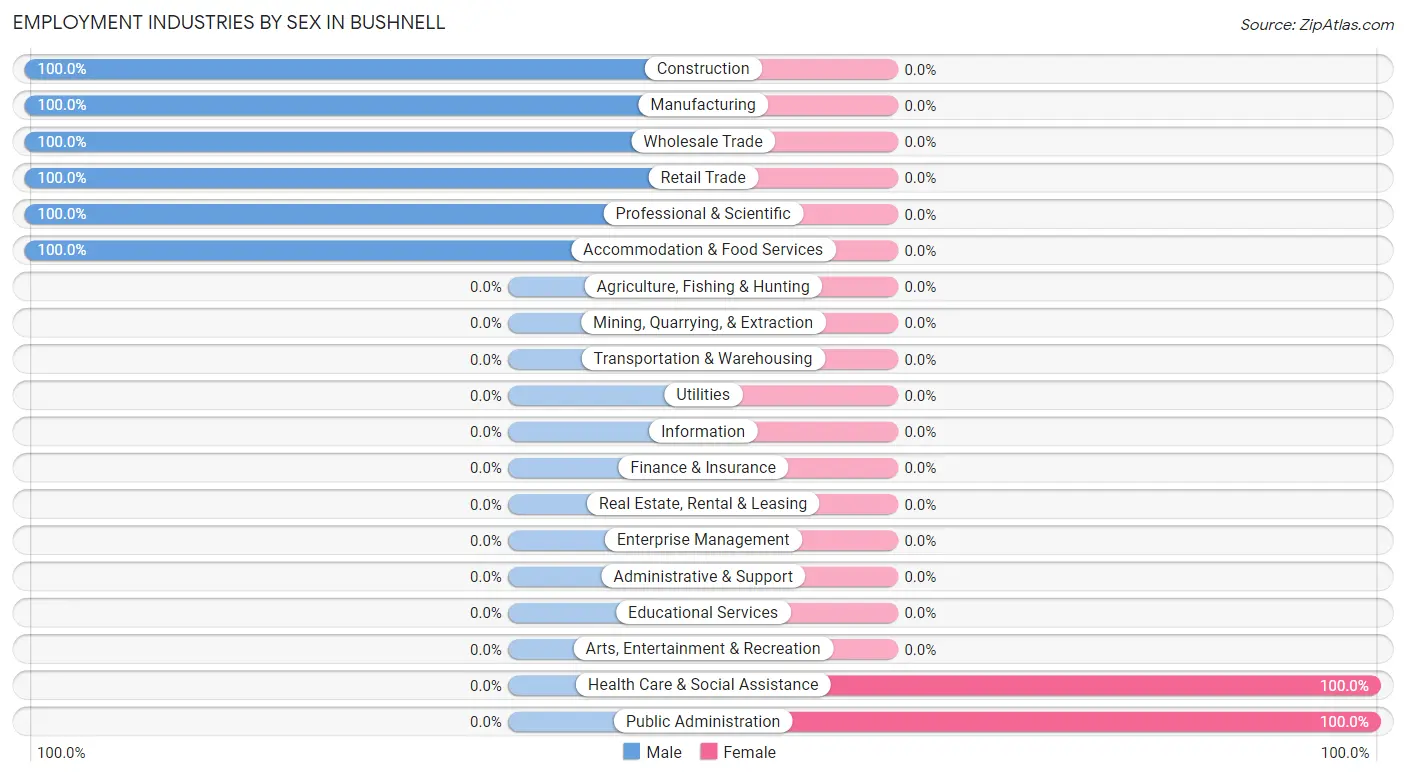
| Industry | Male | Female |
| Agriculture, Fishing & Hunting | 0 (0.0%) | 0 (0.0%) |
| Mining, Quarrying, & Extraction | 0 (0.0%) | 0 (0.0%) |
| Construction | 6 (100.0%) | 0 (0.0%) |
| Manufacturing | 1 (100.0%) | 0 (0.0%) |
| Wholesale Trade | 1 (100.0%) | 0 (0.0%) |
| Retail Trade | 4 (100.0%) | 0 (0.0%) |
| Transportation & Warehousing | 0 (0.0%) | 0 (0.0%) |
| Utilities | 0 (0.0%) | 0 (0.0%) |
| Information | 0 (0.0%) | 0 (0.0%) |
| Finance & Insurance | 0 (0.0%) | 0 (0.0%) |
| Real Estate, Rental & Leasing | 0 (0.0%) | 0 (0.0%) |
| Professional & Scientific | 2 (100.0%) | 0 (0.0%) |
| Enterprise Management | 0 (0.0%) | 0 (0.0%) |
| Administrative & Support | 0 (0.0%) | 0 (0.0%) |
| Educational Services | 0 (0.0%) | 0 (0.0%) |
| Health Care & Social Assistance | 0 (0.0%) | 7 (100.0%) |
| Arts, Entertainment & Recreation | 0 (0.0%) | 0 (0.0%) |
| Accommodation & Food Services | 3 (100.0%) | 0 (0.0%) |
| Public Administration | 0 (0.0%) | 8 (100.0%) |
| Total | 17 (53.1%) | 15 (46.9%) |
Education in Bushnell
School Enrollment in Bushnell
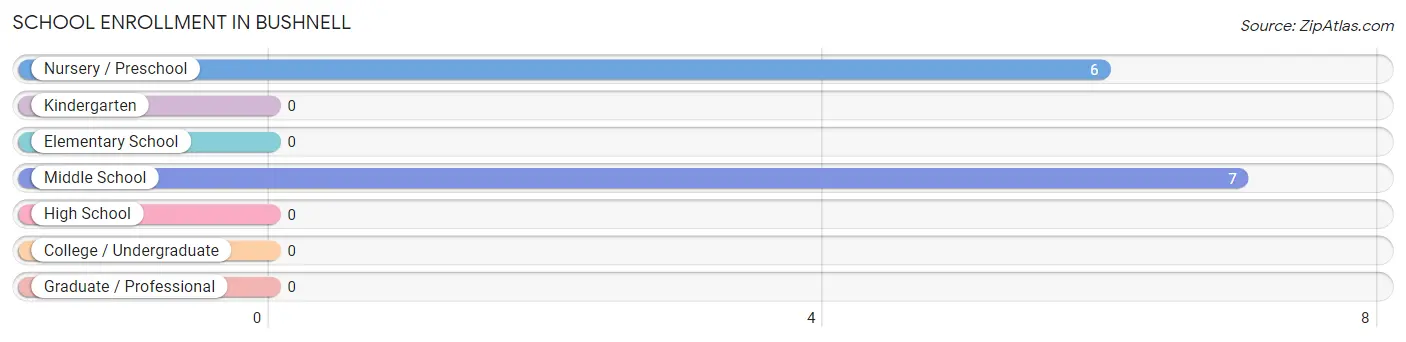
The most common levels of schooling among the 13 students in Bushnell are middle school (7 | 53.8%), and nursery / preschool (6 | 46.2%).
| School Level | # Students | % Students |
| Nursery / Preschool | 6 | 46.2% |
| Kindergarten | 0 | 0.0% |
| Elementary School | 0 | 0.0% |
| Middle School | 7 | 53.8% |
| High School | 0 | 0.0% |
| College / Undergraduate | 0 | 0.0% |
| Graduate / Professional | 0 | 0.0% |
| Total | 13 | 100.0% |
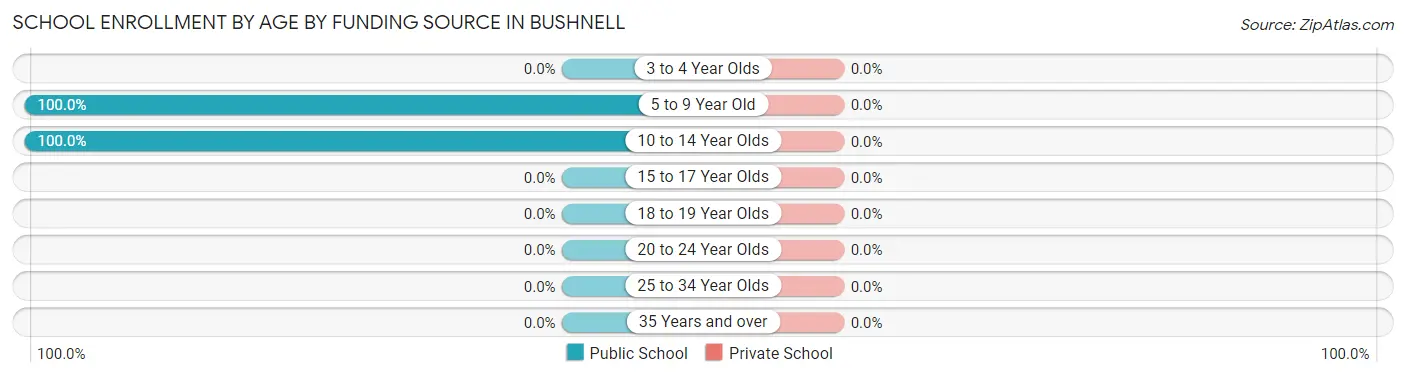
School Enrollment by Age by Funding Source in Bushnell
| Age Bracket | Public School | Private School |
| 3 to 4 Year Olds | 0 (0.0%) | 0 (0.0%) |
| 5 to 9 Year Old | 6 (100.0%) | 0 (0.0%) |
| 10 to 14 Year Olds | 7 (100.0%) | 0 (0.0%) |
| 15 to 17 Year Olds | 0 (0.0%) | 0 (0.0%) |
| 18 to 19 Year Olds | 0 (0.0%) | 0 (0.0%) |
| 20 to 24 Year Olds | 0 (0.0%) | 0 (0.0%) |
| 25 to 34 Year Olds | 0 (0.0%) | 0 (0.0%) |
| 35 Years and over | 0 (0.0%) | 0 (0.0%) |
| Total | 13 (100.0%) | 0 (0.0%) |
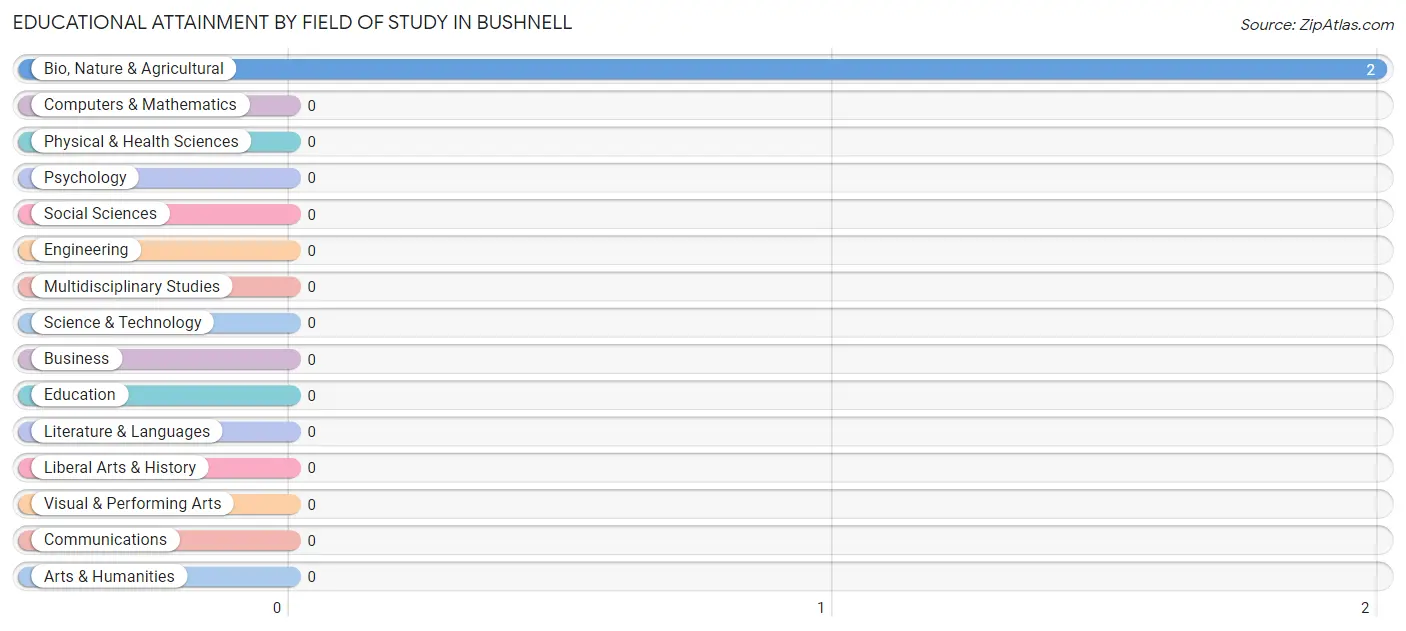
Educational Attainment by Field of Study in Bushnell
, and bio, nature & agricultural (2 | 100.0%) are the most common fields of study among 2 individuals in Bushnell who have obtained a bachelor's degree or higher.
| Field of Study | # Graduates | % Graduates |
| Computers & Mathematics | 0 | 0.0% |
| Bio, Nature & Agricultural | 2 | 100.0% |
| Physical & Health Sciences | 0 | 0.0% |
| Psychology | 0 | 0.0% |
| Social Sciences | 0 | 0.0% |
| Engineering | 0 | 0.0% |
| Multidisciplinary Studies | 0 | 0.0% |
| Science & Technology | 0 | 0.0% |
| Business | 0 | 0.0% |
| Education | 0 | 0.0% |
| Literature & Languages | 0 | 0.0% |
| Liberal Arts & History | 0 | 0.0% |
| Visual & Performing Arts | 0 | 0.0% |
| Communications | 0 | 0.0% |
| Arts & Humanities | 0 | 0.0% |
| Total | 2 | 100.0% |
Transportation & Commute in Bushnell
Vehicle Availability by Sex in Bushnell
The most prevalent vehicle ownership categories in Bushnell are males with 2 vehicles (7, accounting for 41.2%) and females with 2 vehicles (15, making up 46.7%).
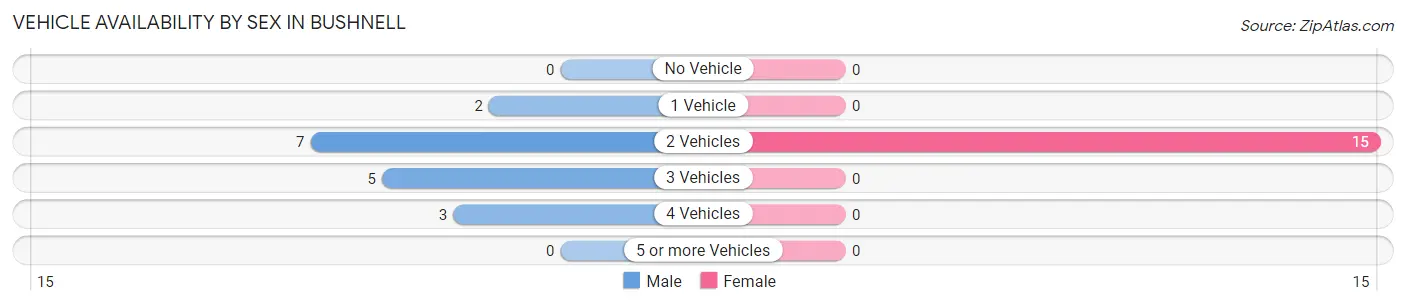
| Vehicles Available | Male | Female |
| No Vehicle | 0 (0.0%) | 0 (0.0%) |
| 1 Vehicle | 2 (11.8%) | 0 (0.0%) |
| 2 Vehicles | 7 (41.2%) | 15 (100.0%) |
| 3 Vehicles | 5 (29.4%) | 0 (0.0%) |
| 4 Vehicles | 3 (17.6%) | 0 (0.0%) |
| 5 or more Vehicles | 0 (0.0%) | 0 (0.0%) |
| Total | 17 (100.0%) | 15 (100.0%) |
Commute Time in Bushnell
The most frequently occuring commute durations in Bushnell are 5 to 9 minutes (10 commuters, 33.3%), 20 to 24 minutes (7 commuters, 23.3%), and 60 to 89 minutes (7 commuters, 23.3%).
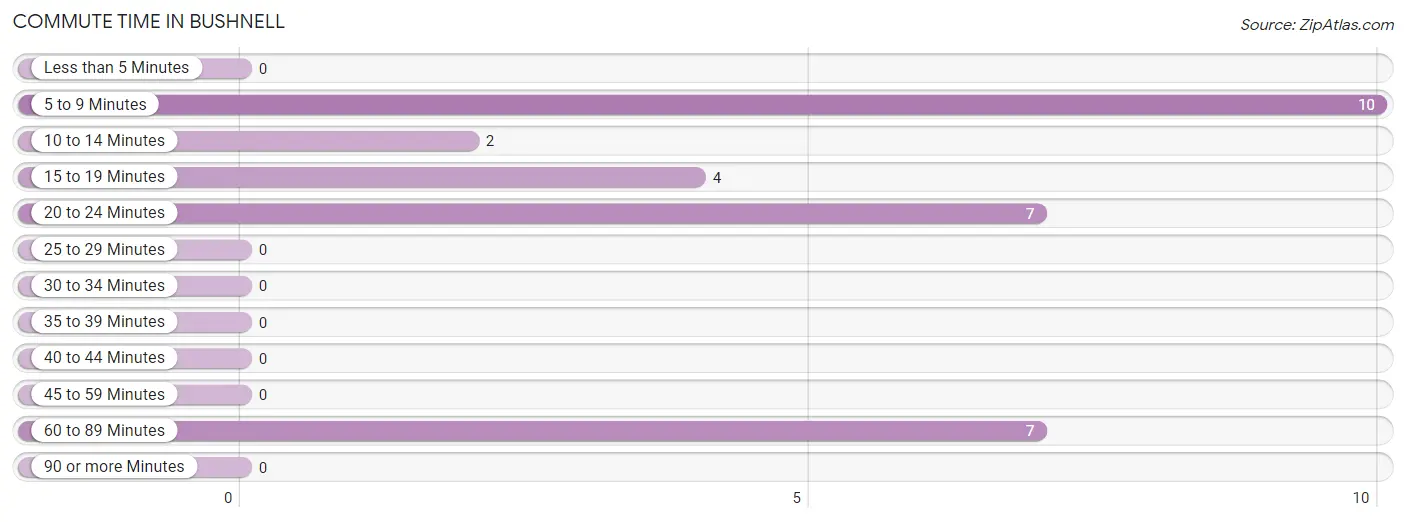
| Commute Time | # Commuters | % Commuters |
| Less than 5 Minutes | 0 | 0.0% |
| 5 to 9 Minutes | 10 | 33.3% |
| 10 to 14 Minutes | 2 | 6.7% |
| 15 to 19 Minutes | 4 | 13.3% |
| 20 to 24 Minutes | 7 | 23.3% |
| 25 to 29 Minutes | 0 | 0.0% |
| 30 to 34 Minutes | 0 | 0.0% |
| 35 to 39 Minutes | 0 | 0.0% |
| 40 to 44 Minutes | 0 | 0.0% |
| 45 to 59 Minutes | 0 | 0.0% |
| 60 to 89 Minutes | 7 | 23.3% |
| 90 or more Minutes | 0 | 0.0% |
Commute Time by Sex in Bushnell
The most common commute times in Bushnell are 20 to 24 minutes (7 commuters, 46.7%) for males and 5 to 9 minutes (8 commuters, 53.3%) for females.
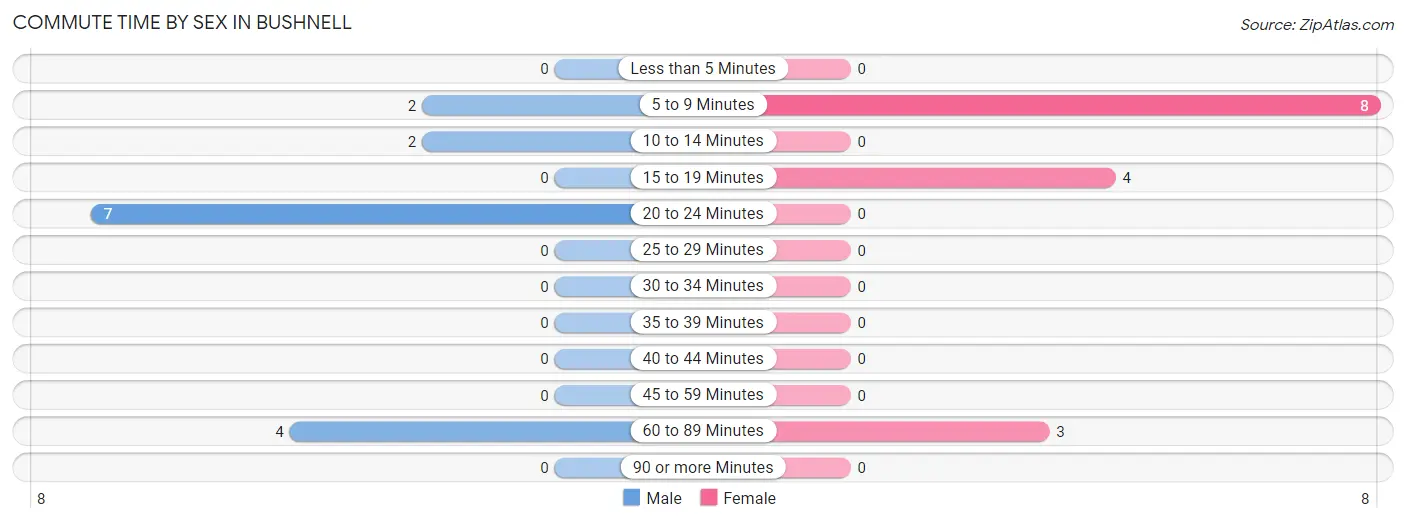
| Commute Time | Male | Female |
| Less than 5 Minutes | 0 (0.0%) | 0 (0.0%) |
| 5 to 9 Minutes | 2 (13.3%) | 8 (53.3%) |
| 10 to 14 Minutes | 2 (13.3%) | 0 (0.0%) |
| 15 to 19 Minutes | 0 (0.0%) | 4 (26.7%) |
| 20 to 24 Minutes | 7 (46.7%) | 0 (0.0%) |
| 25 to 29 Minutes | 0 (0.0%) | 0 (0.0%) |
| 30 to 34 Minutes | 0 (0.0%) | 0 (0.0%) |
| 35 to 39 Minutes | 0 (0.0%) | 0 (0.0%) |
| 40 to 44 Minutes | 0 (0.0%) | 0 (0.0%) |
| 45 to 59 Minutes | 0 (0.0%) | 0 (0.0%) |
| 60 to 89 Minutes | 4 (26.7%) | 3 (20.0%) |
| 90 or more Minutes | 0 (0.0%) | 0 (0.0%) |
Time of Departure to Work by Sex in Bushnell
The most frequent times of departure to work in Bushnell are 6:00 AM to 6:29 AM (8, 53.3%) for males and 7:30 AM to 7:59 AM (8, 53.3%) for females.
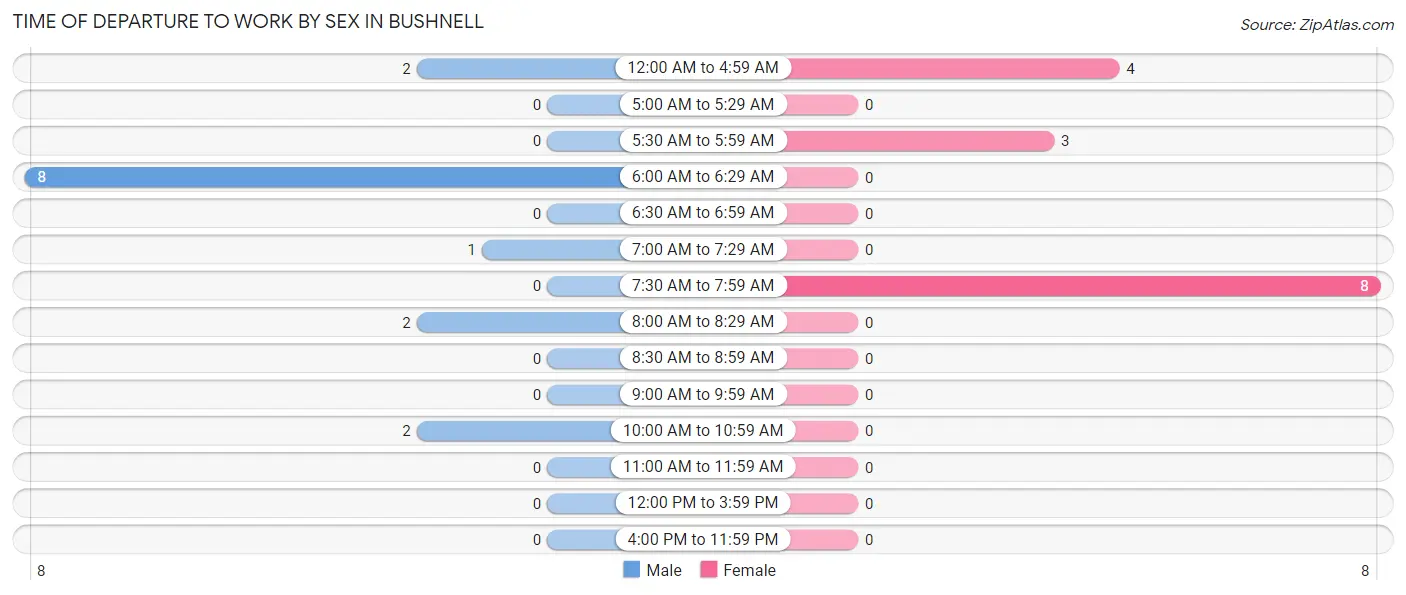
| Time of Departure | Male | Female |
| 12:00 AM to 4:59 AM | 2 (13.3%) | 4 (26.7%) |
| 5:00 AM to 5:29 AM | 0 (0.0%) | 0 (0.0%) |
| 5:30 AM to 5:59 AM | 0 (0.0%) | 3 (20.0%) |
| 6:00 AM to 6:29 AM | 8 (53.3%) | 0 (0.0%) |
| 6:30 AM to 6:59 AM | 0 (0.0%) | 0 (0.0%) |
| 7:00 AM to 7:29 AM | 1 (6.7%) | 0 (0.0%) |
| 7:30 AM to 7:59 AM | 0 (0.0%) | 8 (53.3%) |
| 8:00 AM to 8:29 AM | 2 (13.3%) | 0 (0.0%) |
| 8:30 AM to 8:59 AM | 0 (0.0%) | 0 (0.0%) |
| 9:00 AM to 9:59 AM | 0 (0.0%) | 0 (0.0%) |
| 10:00 AM to 10:59 AM | 2 (13.3%) | 0 (0.0%) |
| 11:00 AM to 11:59 AM | 0 (0.0%) | 0 (0.0%) |
| 12:00 PM to 3:59 PM | 0 (0.0%) | 0 (0.0%) |
| 4:00 PM to 11:59 PM | 0 (0.0%) | 0 (0.0%) |
| Total | 15 (100.0%) | 15 (100.0%) |
Housing Occupancy in Bushnell
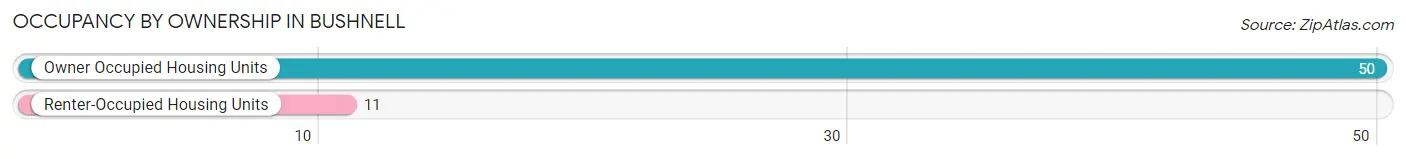
Occupancy by Ownership in Bushnell
Of the total 61 dwellings in Bushnell, owner-occupied units account for 50 (82.0%), while renter-occupied units make up 11 (18.0%).
| Occupancy | # Housing Units | % Housing Units |
| Owner Occupied Housing Units | 50 | 82.0% |
| Renter-Occupied Housing Units | 11 | 18.0% |
| Total Occupied Housing Units | 61 | 100.0% |
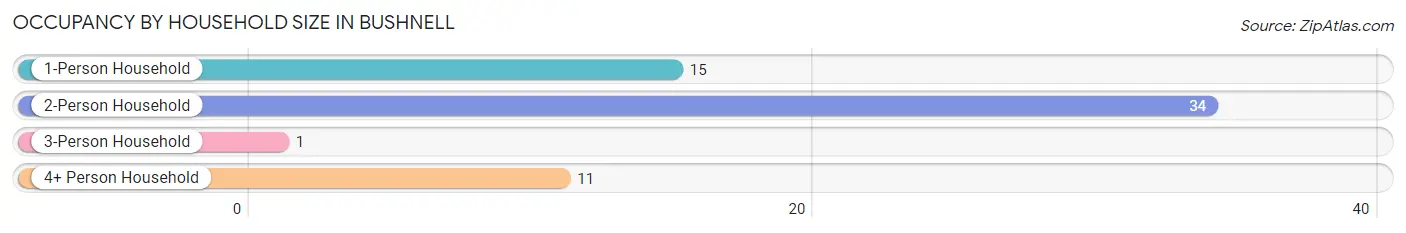
Occupancy by Household Size in Bushnell
| Household Size | # Housing Units | % Housing Units |
| 1-Person Household | 15 | 24.6% |
| 2-Person Household | 34 | 55.7% |
| 3-Person Household | 1 | 1.6% |
| 4+ Person Household | 11 | 18.0% |
| Total Housing Units | 61 | 100.0% |
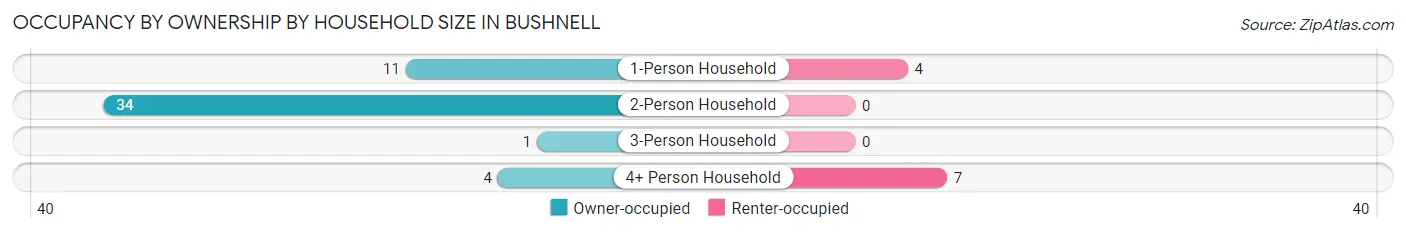
Occupancy by Ownership by Household Size in Bushnell
| Household Size | Owner-occupied | Renter-occupied |
| 1-Person Household | 11 (73.3%) | 4 (26.7%) |
| 2-Person Household | 34 (100.0%) | 0 (0.0%) |
| 3-Person Household | 1 (100.0%) | 0 (0.0%) |
| 4+ Person Household | 4 (36.4%) | 7 (63.6%) |
| Total Housing Units | 50 (82.0%) | 11 (18.0%) |
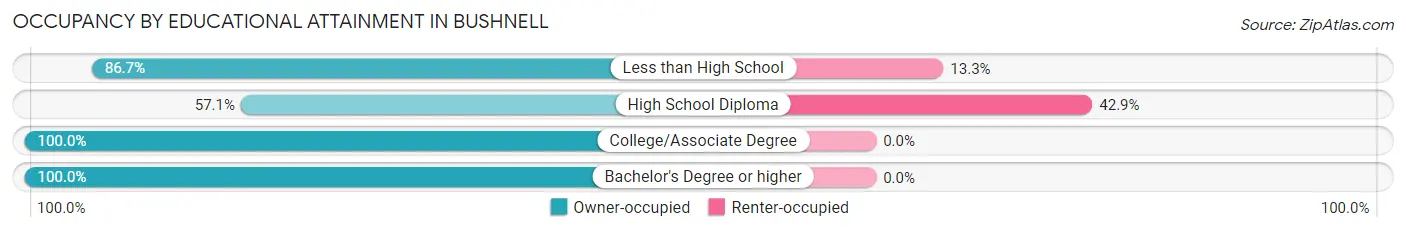
Occupancy by Educational Attainment in Bushnell
| Household Size | Owner-occupied | Renter-occupied |
| Less than High School | 13 (86.7%) | 2 (13.3%) |
| High School Diploma | 12 (57.1%) | 9 (42.9%) |
| College/Associate Degree | 23 (100.0%) | 0 (0.0%) |
| Bachelor's Degree or higher | 2 (100.0%) | 0 (0.0%) |
Occupancy by Age of Householder in Bushnell
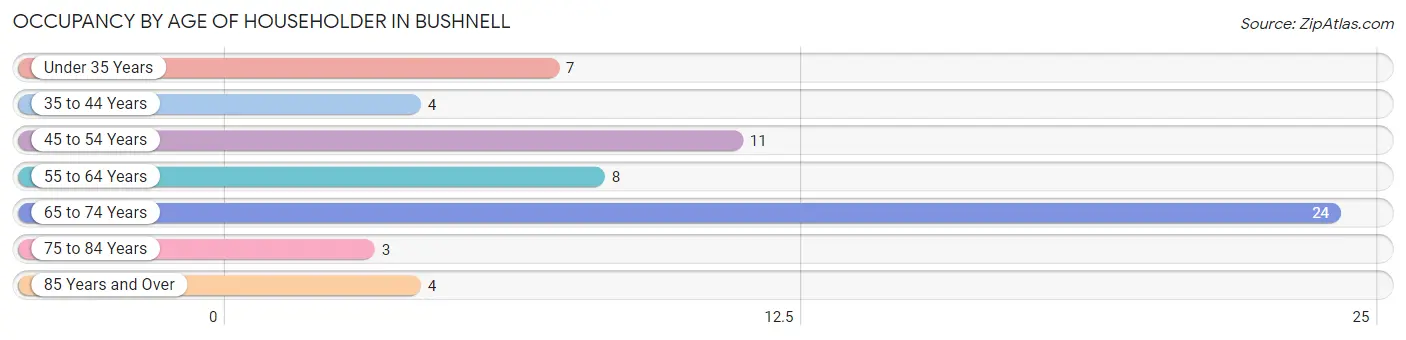
| Age Bracket | # Households | % Households |
| Under 35 Years | 7 | 11.5% |
| 35 to 44 Years | 4 | 6.6% |
| 45 to 54 Years | 11 | 18.0% |
| 55 to 64 Years | 8 | 13.1% |
| 65 to 74 Years | 24 | 39.3% |
| 75 to 84 Years | 3 | 4.9% |
| 85 Years and Over | 4 | 6.6% |
| Total | 61 | 100.0% |
Housing Finances in Bushnell
Median Income by Occupancy in Bushnell
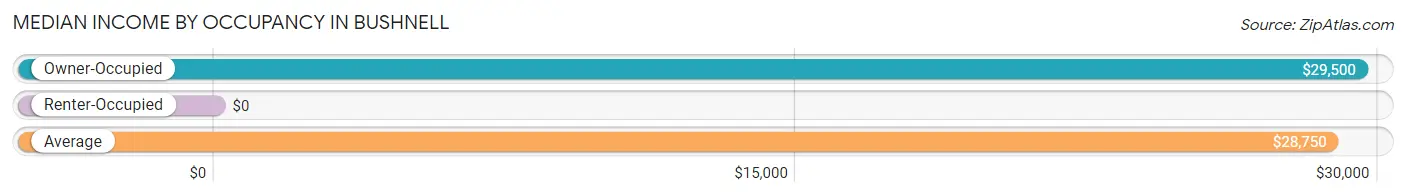
| Occupancy Type | # Households | Median Income |
| Owner-Occupied | 50 (82.0%) | $29,500 |
| Renter-Occupied | 11 (18.0%) | $0 |
| Average | 61 (100.0%) | $28,750 |
Occupancy by Householder Income Bracket in Bushnell
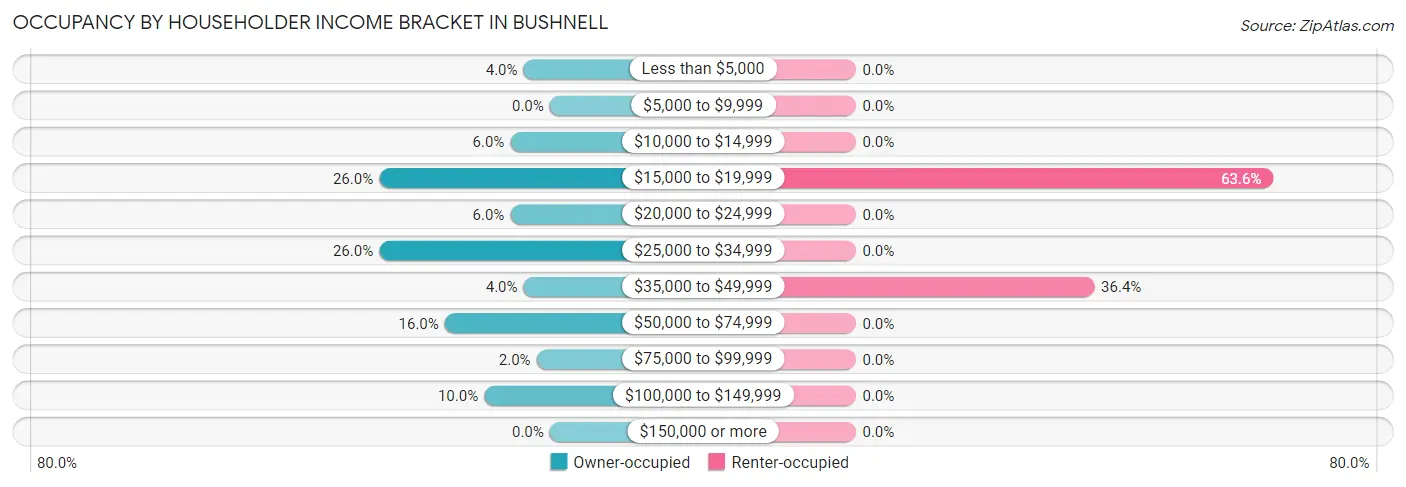
| Income Bracket | Owner-occupied | Renter-occupied |
| Less than $5,000 | 2 (4.0%) | 0 (0.0%) |
| $5,000 to $9,999 | 0 (0.0%) | 0 (0.0%) |
| $10,000 to $14,999 | 3 (6.0%) | 0 (0.0%) |
| $15,000 to $19,999 | 13 (26.0%) | 7 (63.6%) |
| $20,000 to $24,999 | 3 (6.0%) | 0 (0.0%) |
| $25,000 to $34,999 | 13 (26.0%) | 0 (0.0%) |
| $35,000 to $49,999 | 2 (4.0%) | 4 (36.4%) |
| $50,000 to $74,999 | 8 (16.0%) | 0 (0.0%) |
| $75,000 to $99,999 | 1 (2.0%) | 0 (0.0%) |
| $100,000 to $149,999 | 5 (10.0%) | 0 (0.0%) |
| $150,000 or more | 0 (0.0%) | 0 (0.0%) |
| Total | 50 (100.0%) | 11 (100.0%) |
Monthly Housing Cost Tiers in Bushnell
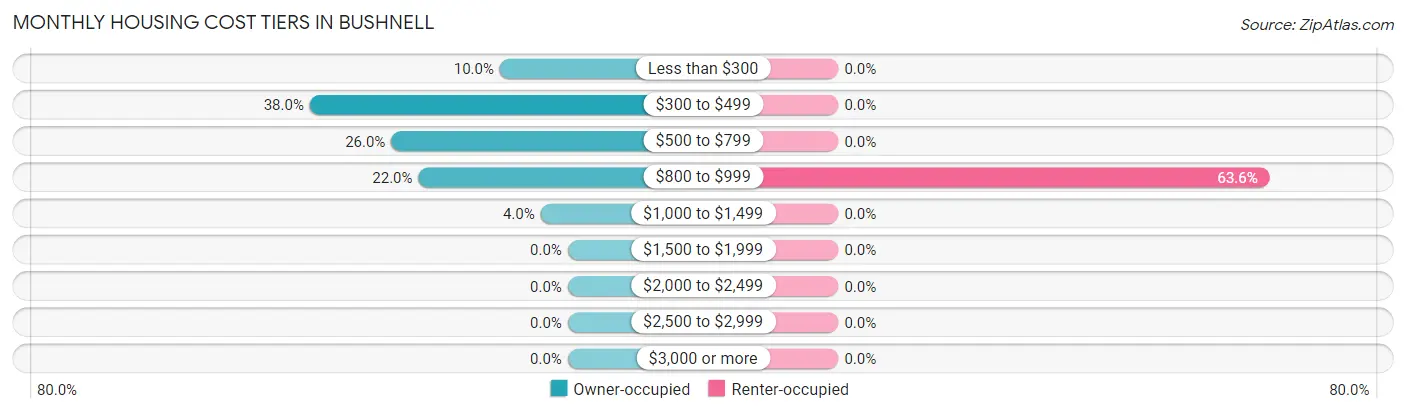
| Monthly Cost | Owner-occupied | Renter-occupied |
| Less than $300 | 5 (10.0%) | 0 (0.0%) |
| $300 to $499 | 19 (38.0%) | 0 (0.0%) |
| $500 to $799 | 13 (26.0%) | 0 (0.0%) |
| $800 to $999 | 11 (22.0%) | 7 (63.6%) |
| $1,000 to $1,499 | 2 (4.0%) | 0 (0.0%) |
| $1,500 to $1,999 | 0 (0.0%) | 0 (0.0%) |
| $2,000 to $2,499 | 0 (0.0%) | 0 (0.0%) |
| $2,500 to $2,999 | 0 (0.0%) | 0 (0.0%) |
| $3,000 or more | 0 (0.0%) | 0 (0.0%) |
| Total | 50 (100.0%) | 11 (100.0%) |
Physical Housing Characteristics in Bushnell
Housing Structures in Bushnell
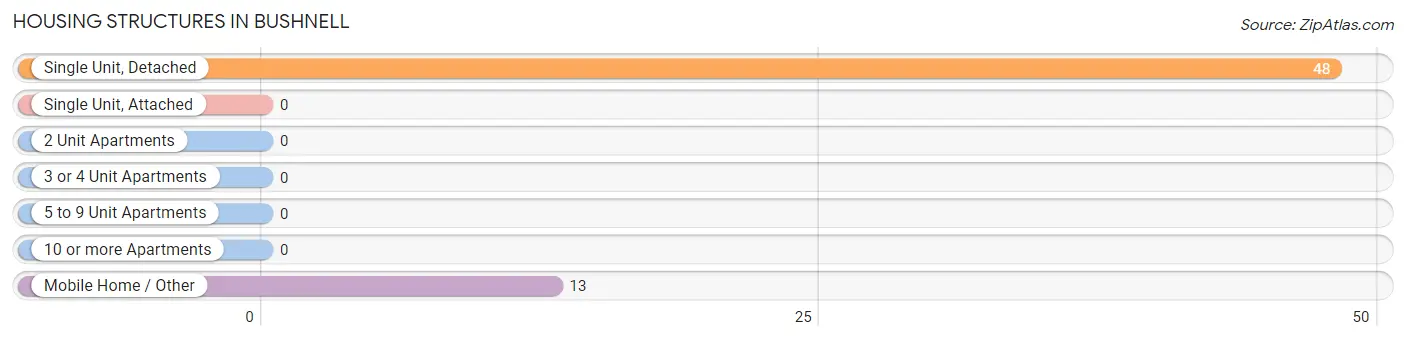
| Structure Type | # Housing Units | % Housing Units |
| Single Unit, Detached | 48 | 78.7% |
| Single Unit, Attached | 0 | 0.0% |
| 2 Unit Apartments | 0 | 0.0% |
| 3 or 4 Unit Apartments | 0 | 0.0% |
| 5 to 9 Unit Apartments | 0 | 0.0% |
| 10 or more Apartments | 0 | 0.0% |
| Mobile Home / Other | 13 | 21.3% |
| Total | 61 | 100.0% |
Housing Structures by Occupancy in Bushnell
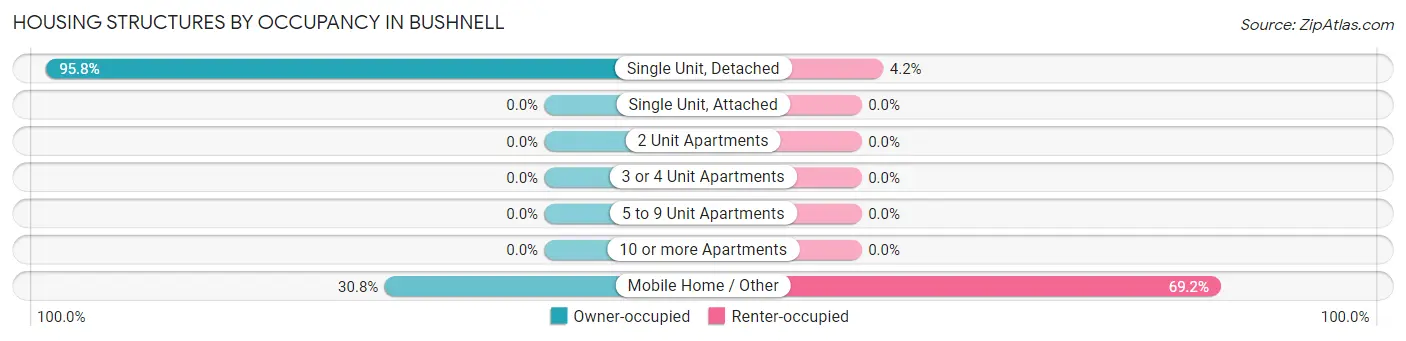
| Structure Type | Owner-occupied | Renter-occupied |
| Single Unit, Detached | 46 (95.8%) | 2 (4.2%) |
| Single Unit, Attached | 0 (0.0%) | 0 (0.0%) |
| 2 Unit Apartments | 0 (0.0%) | 0 (0.0%) |
| 3 or 4 Unit Apartments | 0 (0.0%) | 0 (0.0%) |
| 5 to 9 Unit Apartments | 0 (0.0%) | 0 (0.0%) |
| 10 or more Apartments | 0 (0.0%) | 0 (0.0%) |
| Mobile Home / Other | 4 (30.8%) | 9 (69.2%) |
| Total | 50 (82.0%) | 11 (18.0%) |
Housing Structures by Number of Rooms in Bushnell
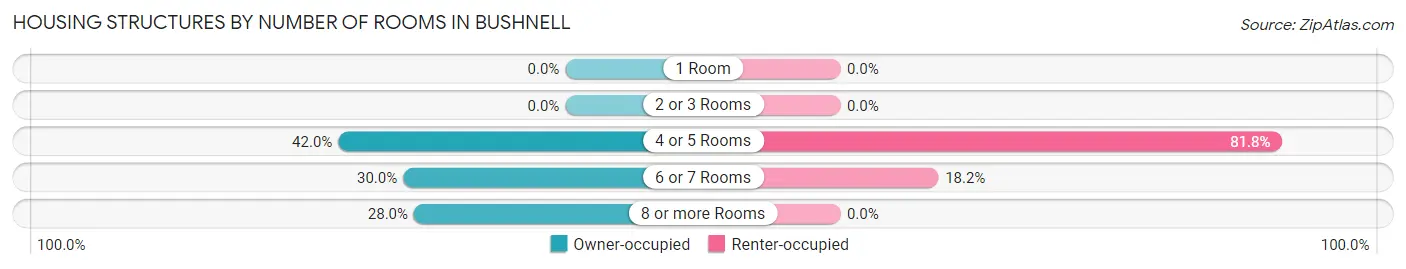
| Number of Rooms | Owner-occupied | Renter-occupied |
| 1 Room | 0 (0.0%) | 0 (0.0%) |
| 2 or 3 Rooms | 0 (0.0%) | 0 (0.0%) |
| 4 or 5 Rooms | 21 (42.0%) | 9 (81.8%) |
| 6 or 7 Rooms | 15 (30.0%) | 2 (18.2%) |
| 8 or more Rooms | 14 (28.0%) | 0 (0.0%) |
| Total | 50 (100.0%) | 11 (100.0%) |
Housing Structure by Heating Type in Bushnell
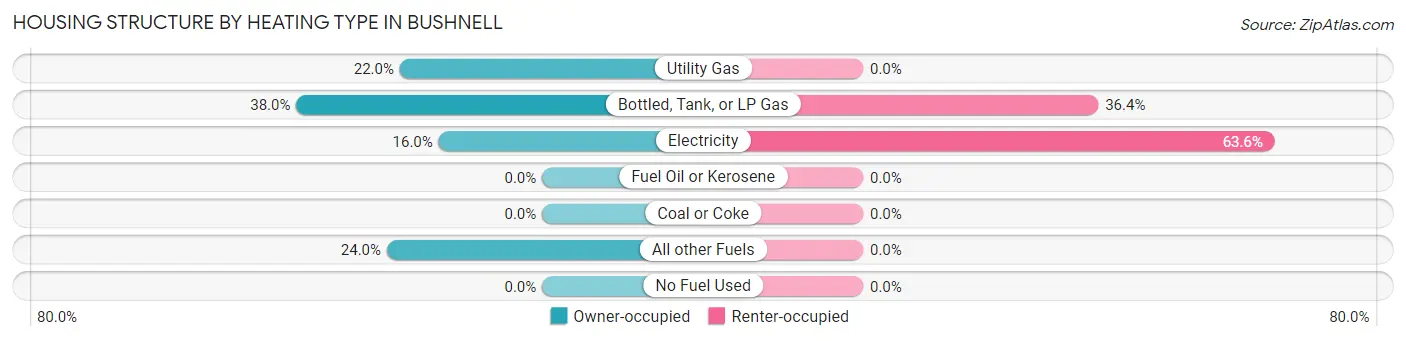
| Heating Type | Owner-occupied | Renter-occupied |
| Utility Gas | 11 (22.0%) | 0 (0.0%) |
| Bottled, Tank, or LP Gas | 19 (38.0%) | 4 (36.4%) |
| Electricity | 8 (16.0%) | 7 (63.6%) |
| Fuel Oil or Kerosene | 0 (0.0%) | 0 (0.0%) |
| Coal or Coke | 0 (0.0%) | 0 (0.0%) |
| All other Fuels | 12 (24.0%) | 0 (0.0%) |
| No Fuel Used | 0 (0.0%) | 0 (0.0%) |
| Total | 50 (100.0%) | 11 (100.0%) |
Household Vehicle Usage in Bushnell
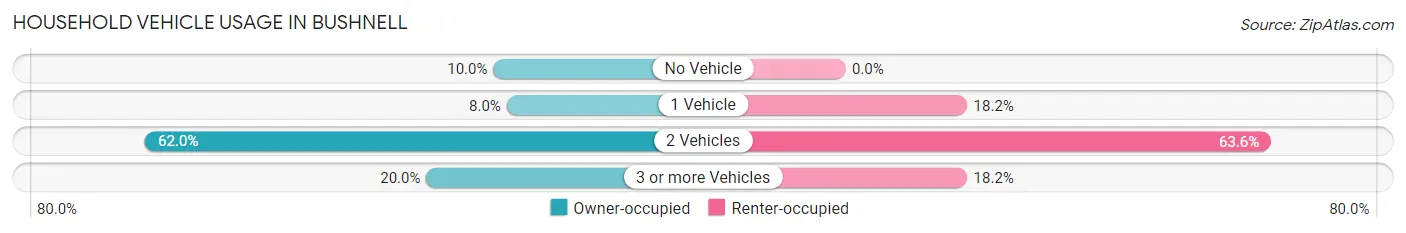
| Vehicles per Household | Owner-occupied | Renter-occupied |
| No Vehicle | 5 (10.0%) | 0 (0.0%) |
| 1 Vehicle | 4 (8.0%) | 2 (18.2%) |
| 2 Vehicles | 31 (62.0%) | 7 (63.6%) |
| 3 or more Vehicles | 10 (20.0%) | 2 (18.2%) |
| Total | 50 (100.0%) | 11 (100.0%) |
Real Estate & Mortgages in Bushnell
Real Estate and Mortgage Overview in Bushnell
| Characteristic | Without Mortgage | With Mortgage |
| Housing Units | 33 | 17 |
| Median Property Value | $53,000 | $78,300 |
| Median Household Income | $33,594 | $0 |
| Monthly Housing Costs | $378 | $0 |
| Real Estate Taxes | $600 | $5 |
Property Value by Mortgage Status in Bushnell
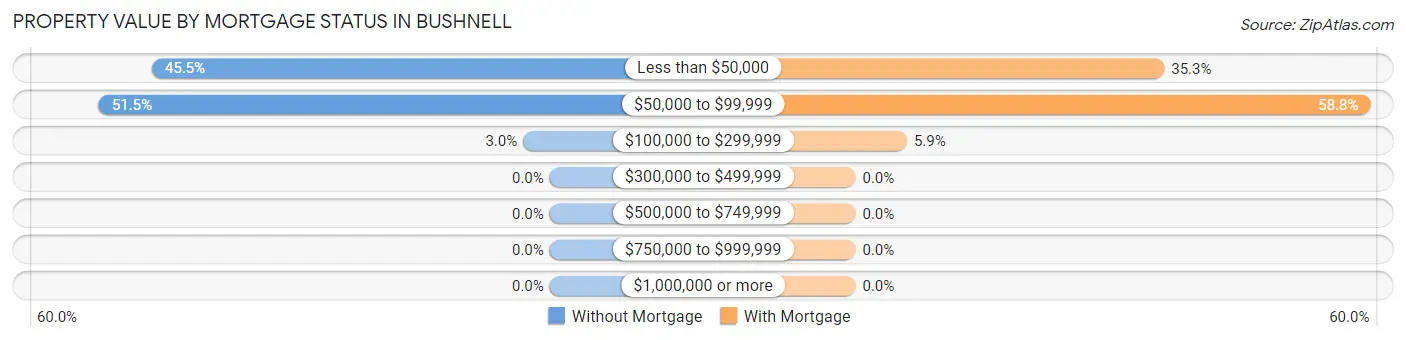
| Property Value | Without Mortgage | With Mortgage |
| Less than $50,000 | 15 (45.5%) | 6 (35.3%) |
| $50,000 to $99,999 | 17 (51.5%) | 10 (58.8%) |
| $100,000 to $299,999 | 1 (3.0%) | 1 (5.9%) |
| $300,000 to $499,999 | 0 (0.0%) | 0 (0.0%) |
| $500,000 to $749,999 | 0 (0.0%) | 0 (0.0%) |
| $750,000 to $999,999 | 0 (0.0%) | 0 (0.0%) |
| $1,000,000 or more | 0 (0.0%) | 0 (0.0%) |
| Total | 33 (100.0%) | 17 (100.0%) |
Household Income by Mortgage Status in Bushnell
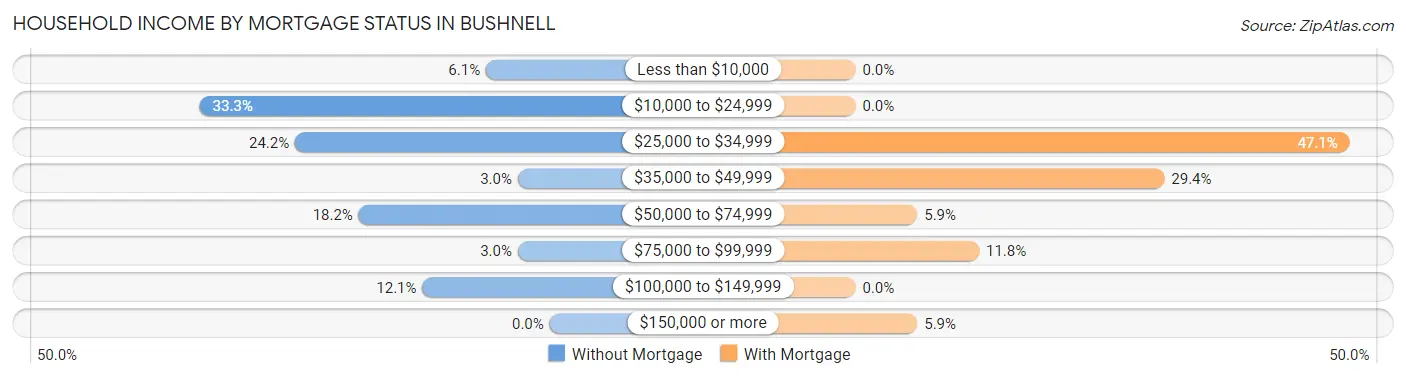
| Household Income | Without Mortgage | With Mortgage |
| Less than $10,000 | 2 (6.1%) | 0 (0.0%) |
| $10,000 to $24,999 | 11 (33.3%) | 0 (0.0%) |
| $25,000 to $34,999 | 8 (24.2%) | 8 (47.1%) |
| $35,000 to $49,999 | 1 (3.0%) | 5 (29.4%) |
| $50,000 to $74,999 | 6 (18.2%) | 1 (5.9%) |
| $75,000 to $99,999 | 1 (3.0%) | 2 (11.8%) |
| $100,000 to $149,999 | 4 (12.1%) | 0 (0.0%) |
| $150,000 or more | 0 (0.0%) | 1 (5.9%) |
| Total | 33 (100.0%) | 17 (100.0%) |
Property Value to Household Income Ratio in Bushnell
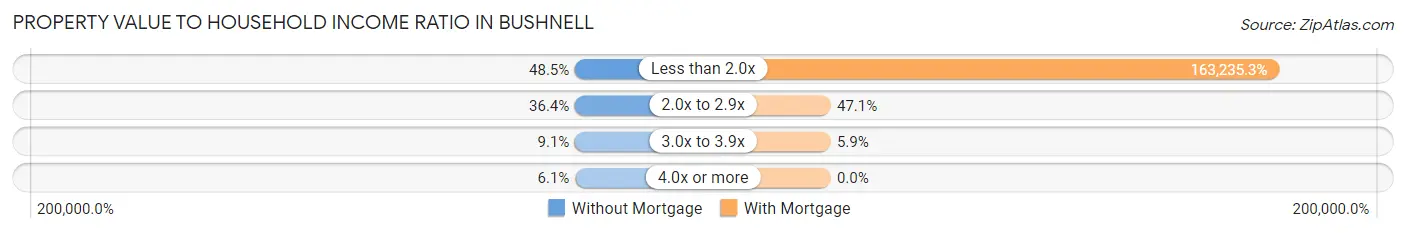
| Value-to-Income Ratio | Without Mortgage | With Mortgage |
| Less than 2.0x | 16 (48.5%) | 27,750 (163,235.3%) |
| 2.0x to 2.9x | 12 (36.4%) | 8 (47.1%) |
| 3.0x to 3.9x | 3 (9.1%) | 1 (5.9%) |
| 4.0x or more | 2 (6.1%) | 0 (0.0%) |
| Total | 33 (100.0%) | 17 (100.0%) |
Real Estate Taxes by Mortgage Status in Bushnell
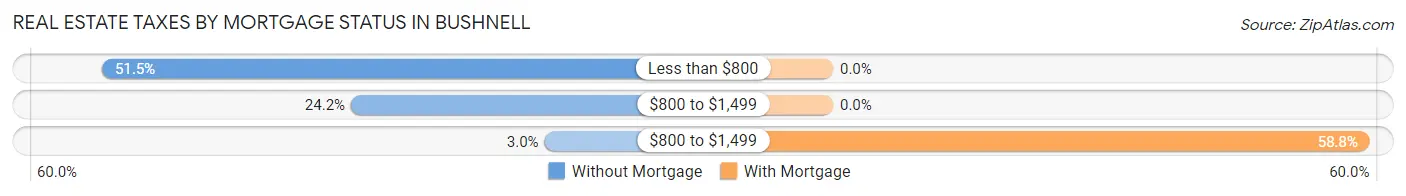
| Property Taxes | Without Mortgage | With Mortgage |
| Less than $800 | 17 (51.5%) | 0 (0.0%) |
| $800 to $1,499 | 8 (24.2%) | 0 (0.0%) |
| $800 to $1,499 | 1 (3.0%) | 10 (58.8%) |
| Total | 33 (100.0%) | 17 (100.0%) |
Health & Disability in Bushnell
Health Insurance Coverage by Age in Bushnell
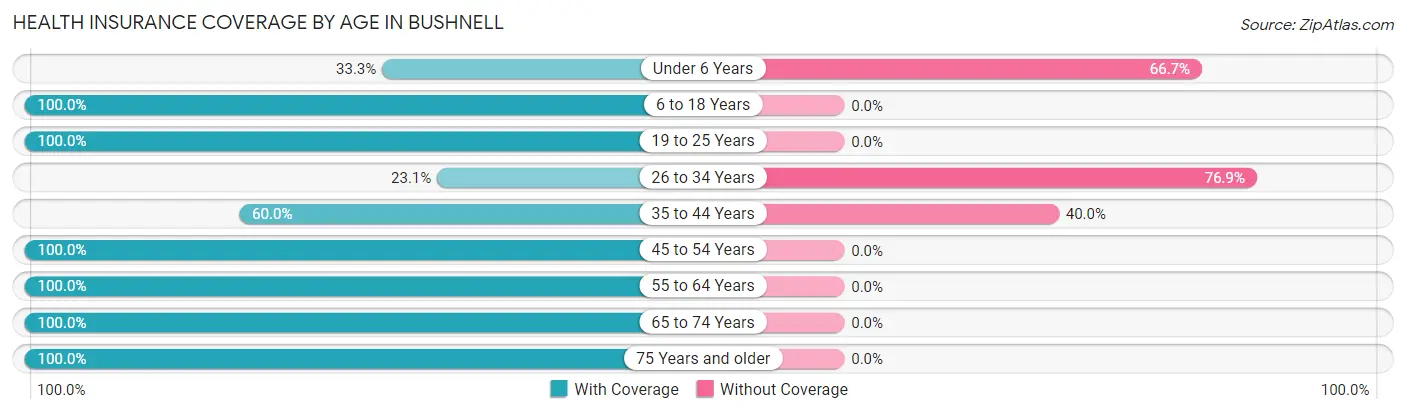
| Age Bracket | With Coverage | Without Coverage |
| Under 6 Years | 3 (33.3%) | 6 (66.7%) |
| 6 to 18 Years | 10 (100.0%) | 0 (0.0%) |
| 19 to 25 Years | 5 (100.0%) | 0 (0.0%) |
| 26 to 34 Years | 3 (23.1%) | 10 (76.9%) |
| 35 to 44 Years | 3 (60.0%) | 2 (40.0%) |
| 45 to 54 Years | 14 (100.0%) | 0 (0.0%) |
| 55 to 64 Years | 16 (100.0%) | 0 (0.0%) |
| 65 to 74 Years | 46 (100.0%) | 0 (0.0%) |
| 75 Years and older | 23 (100.0%) | 0 (0.0%) |
| Total | 123 (87.2%) | 18 (12.8%) |
Health Insurance Coverage by Citizenship Status in Bushnell
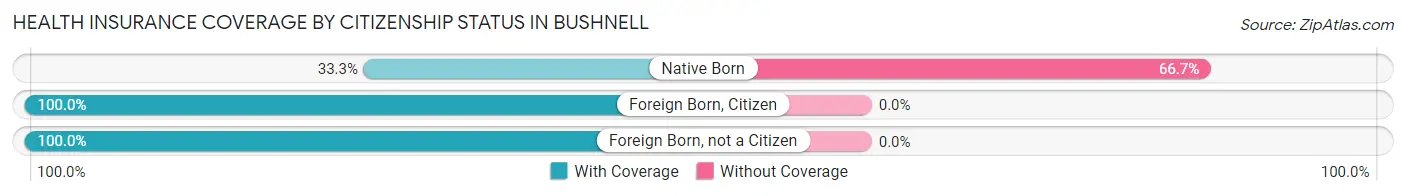
| Citizenship Status | With Coverage | Without Coverage |
| Native Born | 3 (33.3%) | 6 (66.7%) |
| Foreign Born, Citizen | 10 (100.0%) | 0 (0.0%) |
| Foreign Born, not a Citizen | 5 (100.0%) | 0 (0.0%) |
Health Insurance Coverage by Household Income in Bushnell
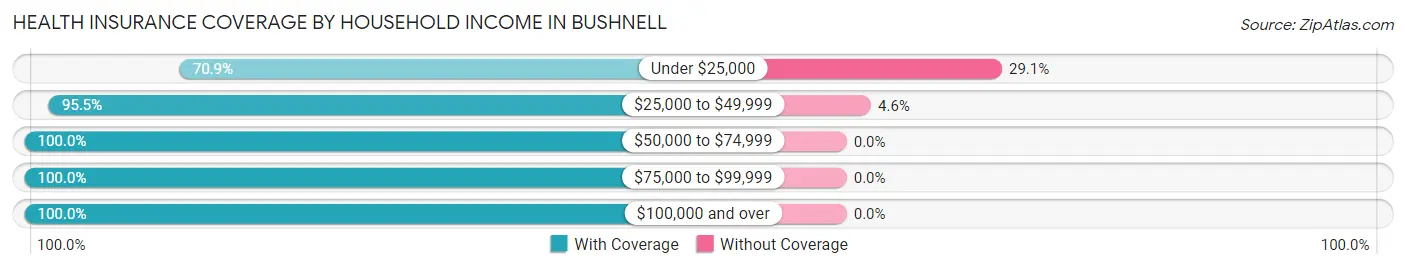
| Household Income | With Coverage | Without Coverage |
| Under $25,000 | 39 (70.9%) | 16 (29.1%) |
| $25,000 to $49,999 | 42 (95.5%) | 2 (4.5%) |
| $50,000 to $74,999 | 27 (100.0%) | 0 (0.0%) |
| $75,000 to $99,999 | 2 (100.0%) | 0 (0.0%) |
| $100,000 and over | 13 (100.0%) | 0 (0.0%) |
Public vs Private Health Insurance Coverage by Age in Bushnell
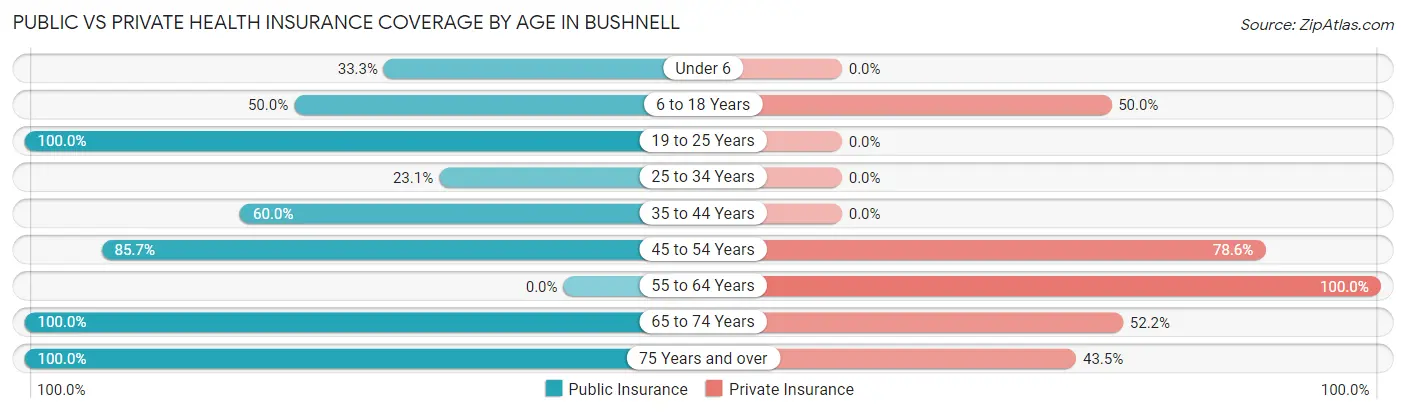
| Age Bracket | Public Insurance | Private Insurance |
| Under 6 | 3 (33.3%) | 0 (0.0%) |
| 6 to 18 Years | 5 (50.0%) | 5 (50.0%) |
| 19 to 25 Years | 5 (100.0%) | 0 (0.0%) |
| 25 to 34 Years | 3 (23.1%) | 0 (0.0%) |
| 35 to 44 Years | 3 (60.0%) | 0 (0.0%) |
| 45 to 54 Years | 12 (85.7%) | 11 (78.6%) |
| 55 to 64 Years | 0 (0.0%) | 16 (100.0%) |
| 65 to 74 Years | 46 (100.0%) | 24 (52.2%) |
| 75 Years and over | 23 (100.0%) | 10 (43.5%) |
| Total | 100 (70.9%) | 66 (46.8%) |
Disability Status by Sex by Age in Bushnell
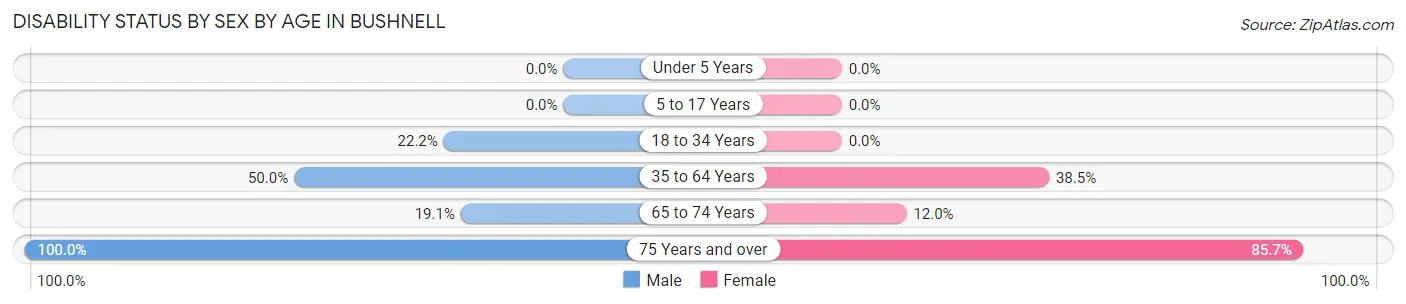
| Age Bracket | Male | Female |
| Under 5 Years | 0 (0.0%) | 0 (0.0%) |
| 5 to 17 Years | 0 (0.0%) | 0 (0.0%) |
| 18 to 34 Years | 2 (22.2%) | 0 (0.0%) |
| 35 to 64 Years | 11 (50.0%) | 5 (38.5%) |
| 65 to 74 Years | 4 (19.1%) | 3 (12.0%) |
| 75 Years and over | 16 (100.0%) | 6 (85.7%) |
Disability Class by Sex by Age in Bushnell
Disability Class: Hearing Difficulty
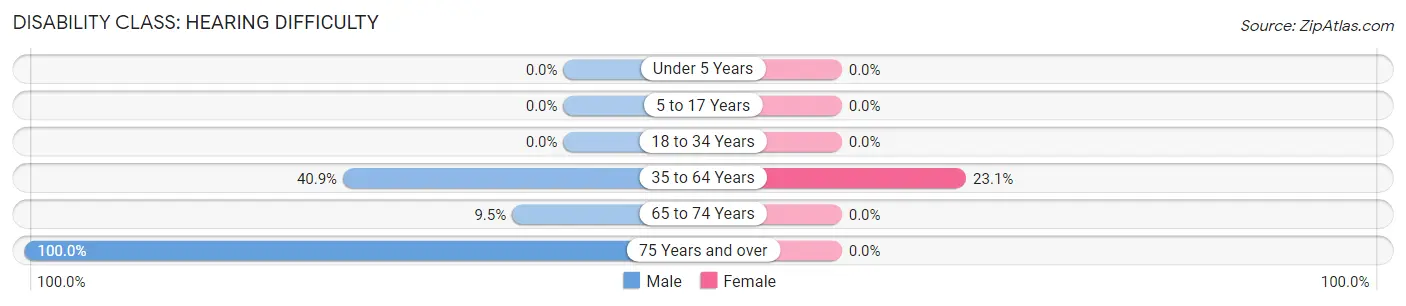
| Age Bracket | Male | Female |
| Under 5 Years | 0 (0.0%) | 0 (0.0%) |
| 5 to 17 Years | 0 (0.0%) | 0 (0.0%) |
| 18 to 34 Years | 0 (0.0%) | 0 (0.0%) |
| 35 to 64 Years | 9 (40.9%) | 3 (23.1%) |
| 65 to 74 Years | 2 (9.5%) | 0 (0.0%) |
| 75 Years and over | 16 (100.0%) | 0 (0.0%) |
Disability Class: Vision Difficulty
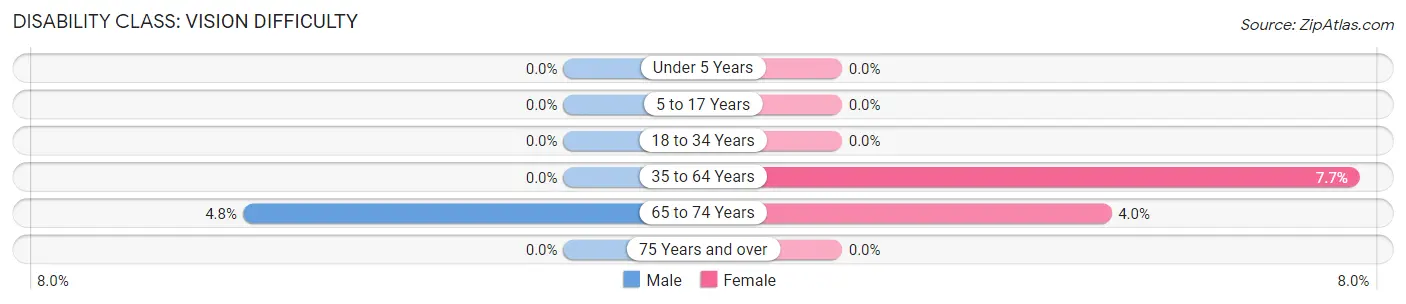
| Age Bracket | Male | Female |
| Under 5 Years | 0 (0.0%) | 0 (0.0%) |
| 5 to 17 Years | 0 (0.0%) | 0 (0.0%) |
| 18 to 34 Years | 0 (0.0%) | 0 (0.0%) |
| 35 to 64 Years | 0 (0.0%) | 1 (7.7%) |
| 65 to 74 Years | 1 (4.8%) | 1 (4.0%) |
| 75 Years and over | 0 (0.0%) | 0 (0.0%) |
Disability Class: Cognitive Difficulty
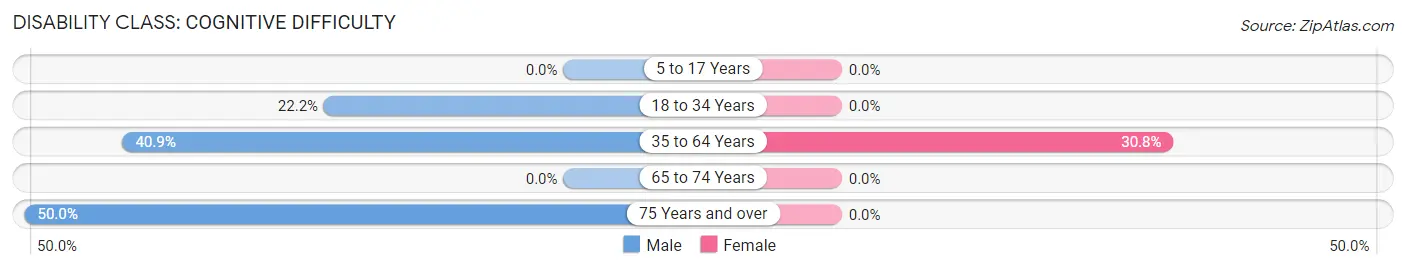
| Age Bracket | Male | Female |
| 5 to 17 Years | 0 (0.0%) | 0 (0.0%) |
| 18 to 34 Years | 2 (22.2%) | 0 (0.0%) |
| 35 to 64 Years | 9 (40.9%) | 4 (30.8%) |
| 65 to 74 Years | 0 (0.0%) | 0 (0.0%) |
| 75 Years and over | 8 (50.0%) | 0 (0.0%) |
Disability Class: Ambulatory Difficulty
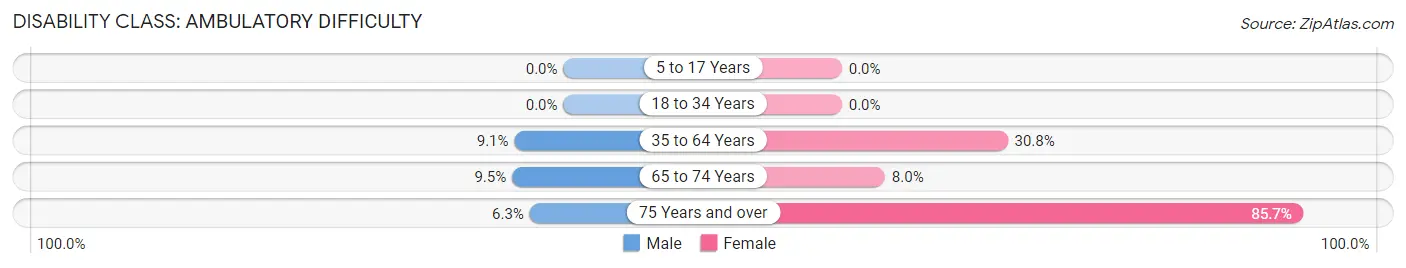
| Age Bracket | Male | Female |
| 5 to 17 Years | 0 (0.0%) | 0 (0.0%) |
| 18 to 34 Years | 0 (0.0%) | 0 (0.0%) |
| 35 to 64 Years | 2 (9.1%) | 4 (30.8%) |
| 65 to 74 Years | 2 (9.5%) | 2 (8.0%) |
| 75 Years and over | 1 (6.2%) | 6 (85.7%) |
Disability Class: Self-Care Difficulty
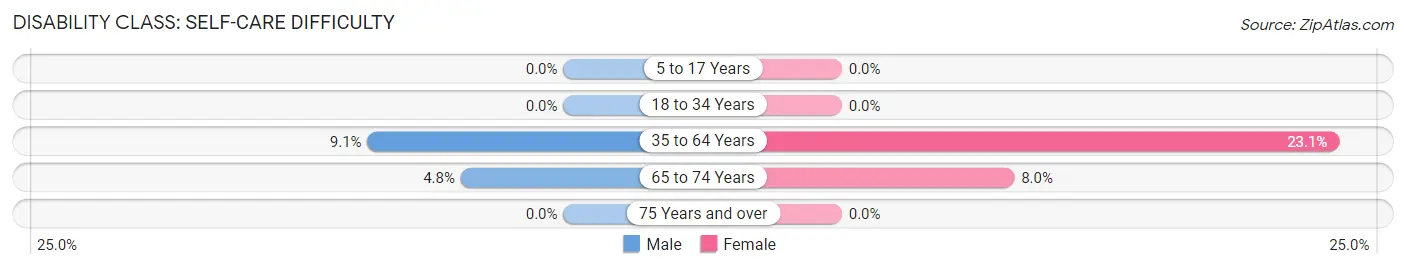
| Age Bracket | Male | Female |
| 5 to 17 Years | 0 (0.0%) | 0 (0.0%) |
| 18 to 34 Years | 0 (0.0%) | 0 (0.0%) |
| 35 to 64 Years | 2 (9.1%) | 3 (23.1%) |
| 65 to 74 Years | 1 (4.8%) | 2 (8.0%) |
| 75 Years and over | 0 (0.0%) | 0 (0.0%) |
Technology Access in Bushnell
Computing Device Access in Bushnell
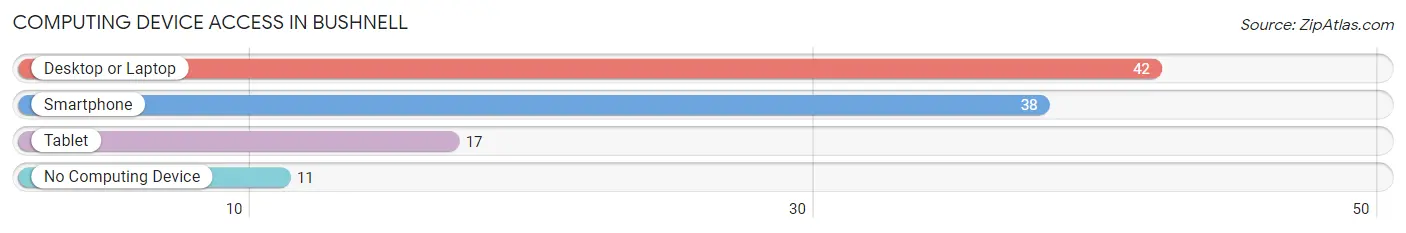
| Device Type | # Households | % Households |
| Desktop or Laptop | 42 | 68.9% |
| Smartphone | 38 | 62.3% |
| Tablet | 17 | 27.9% |
| No Computing Device | 11 | 18.0% |
| Total | 61 | 100.0% |
Internet Access in Bushnell
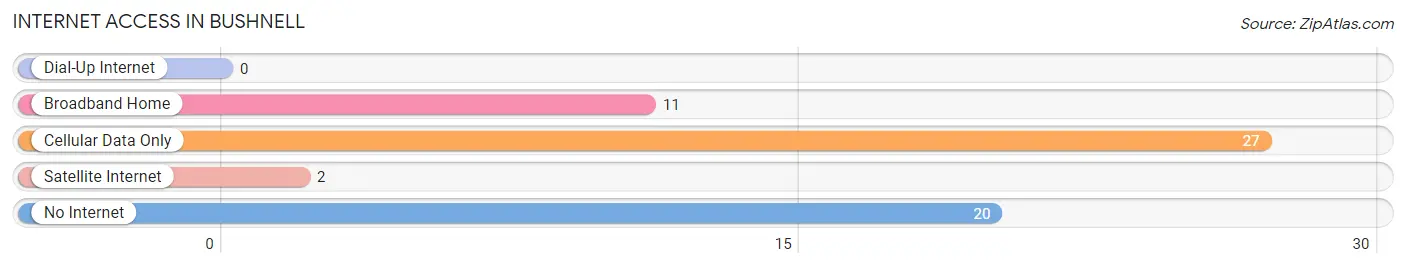
| Internet Type | # Households | % Households |
| Dial-Up Internet | 0 | 0.0% |
| Broadband Home | 11 | 18.0% |
| Cellular Data Only | 27 | 44.3% |
| Satellite Internet | 2 | 3.3% |
| No Internet | 20 | 32.8% |
| Total | 61 | 100.0% |
Bushnell Summary
History
The small town of Bushnell, Nebraska is located in the southeastern corner of the state, in the county of Phelps. It was founded in 1887 by the Union Pacific Railroad, and was named after the railroad’s president, Charles Bushnell. The town was originally a stop on the railroad, and the first settlers were mostly farmers and ranchers.
The town grew slowly, but steadily, and by the early 1900s, it had a population of around 500 people. The town was home to a variety of businesses, including a bank, a hotel, a general store, a blacksmith, and a post office. The town also had a school, which was built in 1891.
In the 1920s, the town began to experience a period of growth, as the railroad began to expand and more people moved to the area. The population grew to around 1,000 people by the 1930s. During this time, the town was home to a variety of businesses, including a movie theater, a bowling alley, and a variety of stores.
In the 1950s, the town began to decline, as the railroad began to move away from the area. The population dropped to around 500 people by the 1960s. However, the town was able to survive, and by the 1970s, the population had grown to around 800 people.
In the 1980s, the town began to experience a period of growth, as the railroad began to expand and more people moved to the area. The population grew to around 1,200 people by the 1990s. During this time, the town was home to a variety of businesses, including a grocery store, a hardware store, and a variety of restaurants.
Geography
Bushnell is located in the southeastern corner of Nebraska, in the county of Phelps. It is situated on the banks of the Platte River, and is surrounded by rolling hills and farmland. The town is located about 25 miles from the city of Omaha, and is about an hour’s drive from Lincoln, the state capital.
The town is located at an elevation of 1,845 feet above sea level, and has an average annual temperature of around 50 degrees Fahrenheit. The town receives an average of around 30 inches of precipitation each year, and has an average of around 200 days of sunshine each year.
Economy
The economy of Bushnell is largely based on agriculture. The town is home to a variety of farms, which produce a variety of crops, including corn, soybeans, wheat, and hay. The town is also home to a variety of businesses, including a grocery store, a hardware store, and a variety of restaurants.
The town is also home to a variety of manufacturing businesses, which produce a variety of products, including furniture, clothing, and electronics. The town is also home to a variety of service businesses, which provide a variety of services, including auto repair, plumbing, and landscaping.
Demographics
As of the 2010 census, the population of Bushnell was 1,541 people. The town has a population density of around 1,000 people per square mile. The town is predominantly white, with around 95% of the population being white. The town also has a small Hispanic population, with around 4% of the population being Hispanic.
The median household income in Bushnell is around $45,000, and the median home value is around $90,000. The town has a poverty rate of around 10%, and the unemployment rate is around 4%. The town has a high school graduation rate of around 90%, and the town has a low crime rate.
Common Questions
What is the Total Population of Bushnell?
Total Population of Bushnell is 141.
What is the Total Male Population of Bushnell?
Total Male Population of Bushnell is 82.
What is the Total Female Population of Bushnell?
Total Female Population of Bushnell is 59.
What is the Ratio of Males per 100 Females in Bushnell?
There are 138.98 Males per 100 Females in Bushnell.
What is the Ratio of Females per 100 Males in Bushnell?
There are 71.95 Females per 100 Males in Bushnell.
What is the Median Population Age in Bushnell?
Median Population Age in Bushnell is 60.9 Years.
What is the Average Family Size in Bushnell
Average Family Size in Bushnell is 2.8 People.
What is the Average Household Size in Bushnell
Average Household Size in Bushnell is 2.3 People.
What is Per Capita Income in Bushnell?
Per Capita income in Bushnell is $17,135.
What is the Median Family Income in Bushnell?
Median Family Income in Bushnell is $29,250.
What is the Median Household income in Bushnell?
Median Household Income in Bushnell is $28,750.
What is Inequality or Gini Index in Bushnell?
Inequality or Gini Index in Bushnell is 0.38.
How Large is the Labor Force in Bushnell?
There are 36 People in the Labor Forcein in Bushnell.
What is the Percentage of People in the Labor Force in Bushnell?
28.8% of People are in the Labor Force in Bushnell.
What is the Unemployment Rate in Bushnell?
Unemployment Rate in Bushnell is 11.1%.