Oakland, NE
Oakland Map
Oakland Overview
1,578
TOTAL POPULATION
761
MALE POPULATION
817
FEMALE POPULATION
93.15
MALES / 100 FEMALES
107.36
FEMALES / 100 MALES
40.8
MEDIAN AGE
3.0
AVG FAMILY SIZE
2.5
AVG HOUSEHOLD SIZE
$31,885
PER CAPITA INCOME
$82,000
AVG FAMILY INCOME
$66,406
AVG HOUSEHOLD INCOME
9.1%
WAGE / INCOME GAP [ % ]
90.9¢/ $1
WAGE / INCOME GAP [ $ ]
0.42
INEQUALITY / GINI INDEX
707
LABOR FORCE [ PEOPLE ]
56.2%
PERCENT IN LABOR FORCE
Oakland Zip Codes
Oakland Area Codes
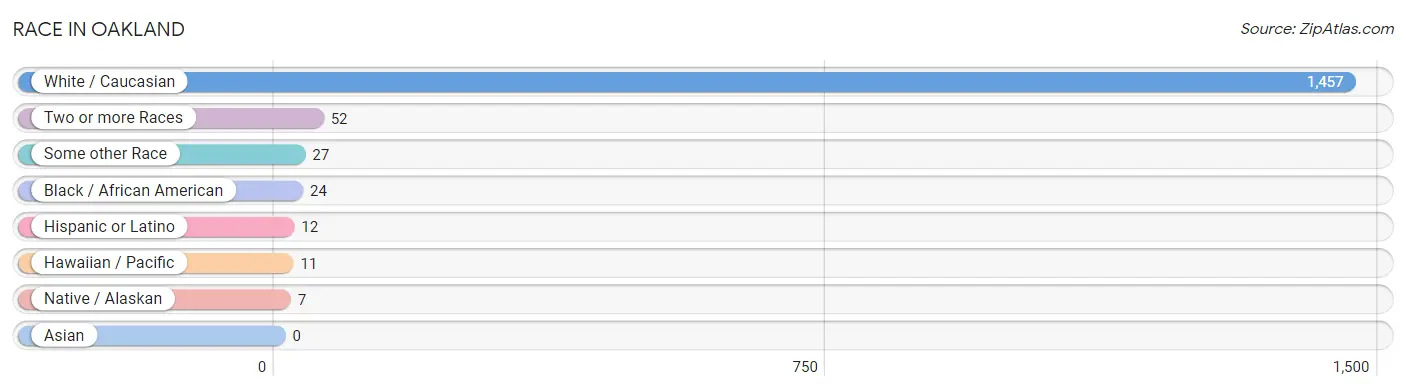
Race in Oakland
The most populous races in Oakland are White / Caucasian (1,457 | 92.3%), Two or more Races (52 | 3.3%), and Some other Race (27 | 1.7%).
| Race | # Population | % Population |
| Asian | 0 | 0.0% |
| Black / African American | 24 | 1.5% |
| Hawaiian / Pacific | 11 | 0.7% |
| Hispanic or Latino | 12 | 0.8% |
| Native / Alaskan | 7 | 0.4% |
| White / Caucasian | 1,457 | 92.3% |
| Two or more Races | 52 | 3.3% |
| Some other Race | 27 | 1.7% |
| Total | 1,578 | 100.0% |
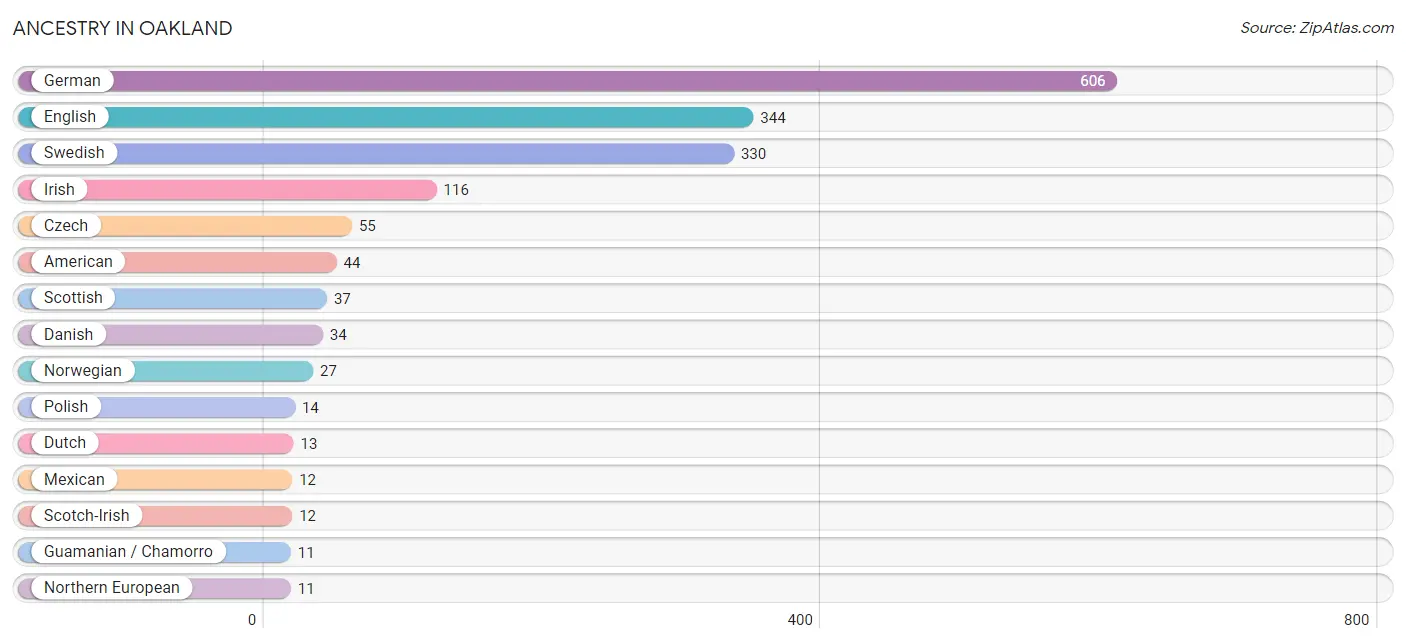
Ancestry in Oakland
The most populous ancestries reported in Oakland are German (606 | 38.4%), English (344 | 21.8%), Swedish (330 | 20.9%), Irish (116 | 7.3%), and Czech (55 | 3.5%), together accounting for 91.9% of all Oakland residents.
| Ancestry | # Population | % Population |
| American | 44 | 2.8% |
| Czech | 55 | 3.5% |
| Danish | 34 | 2.1% |
| Dutch | 13 | 0.8% |
| English | 344 | 21.8% |
| European | 5 | 0.3% |
| Finnish | 7 | 0.4% |
| French | 5 | 0.3% |
| German | 606 | 38.4% |
| Guamanian / Chamorro | 11 | 0.7% |
| Hungarian | 3 | 0.2% |
| Irish | 116 | 7.3% |
| Italian | 2 | 0.1% |
| Mexican | 12 | 0.8% |
| Northern European | 11 | 0.7% |
| Norwegian | 27 | 1.7% |
| Osage | 7 | 0.4% |
| Polish | 14 | 0.9% |
| Portuguese | 4 | 0.3% |
| Russian | 4 | 0.3% |
| Scandinavian | 3 | 0.2% |
| Scotch-Irish | 12 | 0.8% |
| Scottish | 37 | 2.3% |
| Swedish | 330 | 20.9% |
| Welsh | 4 | 0.3% | View All 25 Rows |
Immigrants in Oakland

| Immigration Origin | # Population | % Population | View All 0 Rows |
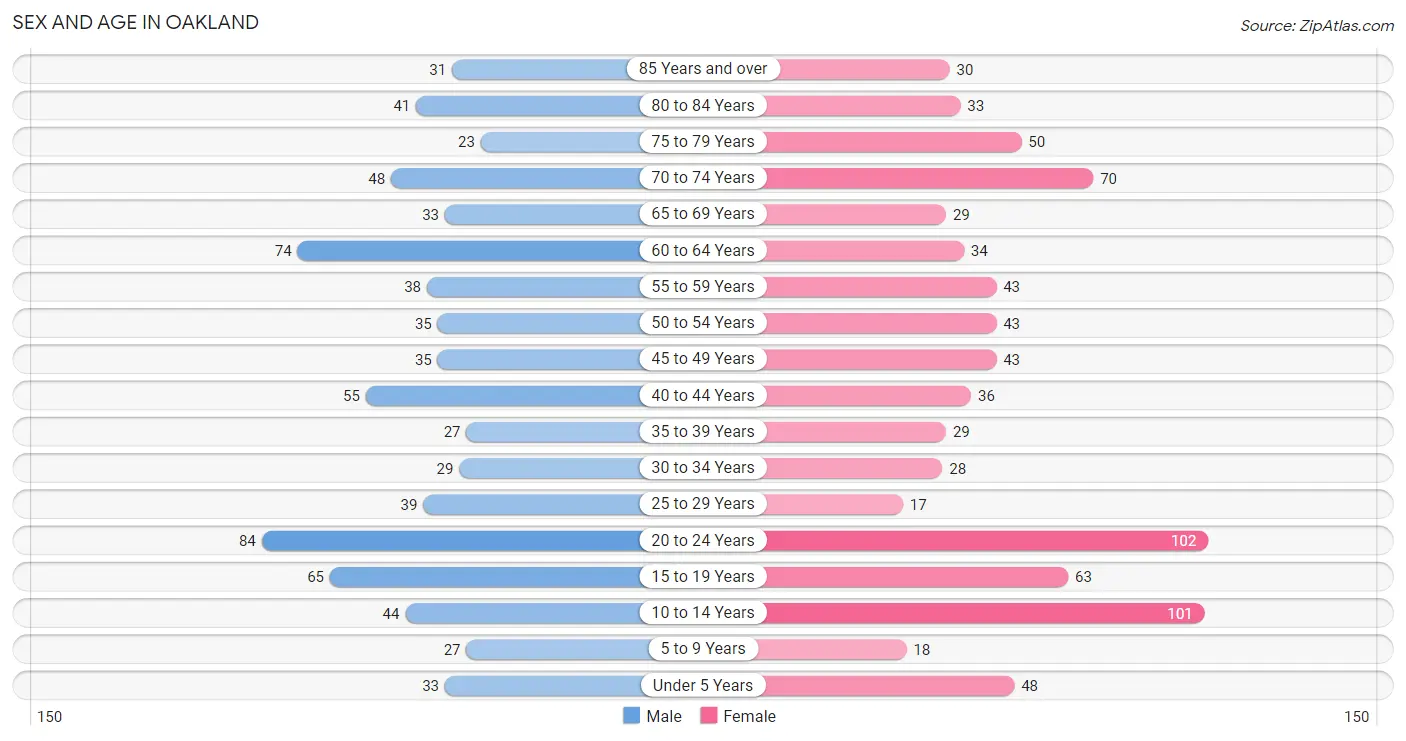
Sex and Age in Oakland
Sex and Age in Oakland
The most populous age groups in Oakland are 20 to 24 Years (84 | 11.0%) for men and 20 to 24 Years (102 | 12.5%) for women.
| Age Bracket | Male | Female |
| Under 5 Years | 33 (4.3%) | 48 (5.9%) |
| 5 to 9 Years | 27 (3.5%) | 18 (2.2%) |
| 10 to 14 Years | 44 (5.8%) | 101 (12.4%) |
| 15 to 19 Years | 65 (8.5%) | 63 (7.7%) |
| 20 to 24 Years | 84 (11.0%) | 102 (12.5%) |
| 25 to 29 Years | 39 (5.1%) | 17 (2.1%) |
| 30 to 34 Years | 29 (3.8%) | 28 (3.4%) |
| 35 to 39 Years | 27 (3.5%) | 29 (3.5%) |
| 40 to 44 Years | 55 (7.2%) | 36 (4.4%) |
| 45 to 49 Years | 35 (4.6%) | 43 (5.3%) |
| 50 to 54 Years | 35 (4.6%) | 43 (5.3%) |
| 55 to 59 Years | 38 (5.0%) | 43 (5.3%) |
| 60 to 64 Years | 74 (9.7%) | 34 (4.2%) |
| 65 to 69 Years | 33 (4.3%) | 29 (3.5%) |
| 70 to 74 Years | 48 (6.3%) | 70 (8.6%) |
| 75 to 79 Years | 23 (3.0%) | 50 (6.1%) |
| 80 to 84 Years | 41 (5.4%) | 33 (4.0%) |
| 85 Years and over | 31 (4.1%) | 30 (3.7%) |
| Total | 761 (100.0%) | 817 (100.0%) |
Families and Households in Oakland
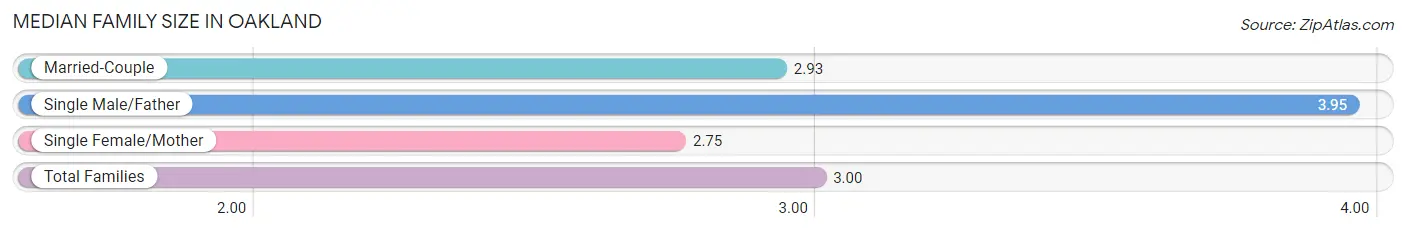
Median Family Size in Oakland
The median family size in Oakland is 3.00 persons per family, with single male/father families (38 | 9.6%) accounting for the largest median family size of 3.95 persons per family. On the other hand, single female/mother families (51 | 12.8%) represent the smallest median family size with 2.75 persons per family.
| Family Type | # Families | Family Size |
| Married-Couple | 309 (77.6%) | 2.93 |
| Single Male/Father | 38 (9.6%) | 3.95 |
| Single Female/Mother | 51 (12.8%) | 2.75 |
| Total Families | 398 (100.0%) | 3.00 |
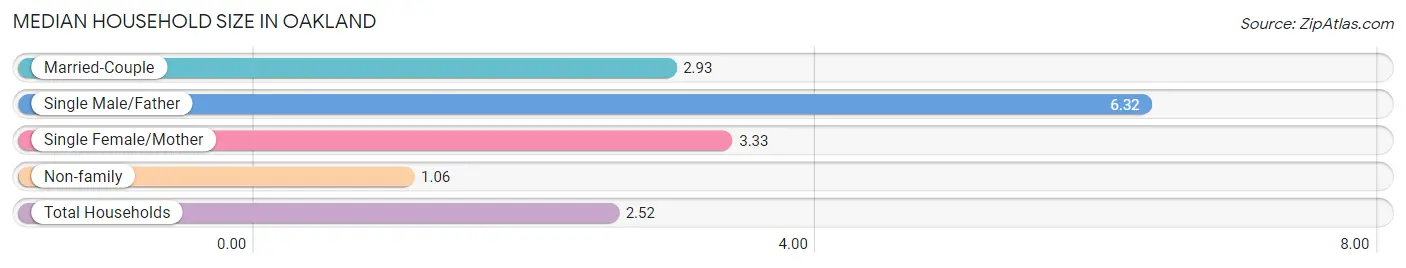
Median Household Size in Oakland
The median household size in Oakland is 2.52 persons per household, with single male/father households (38 | 6.2%) accounting for the largest median household size of 6.32 persons per household. non-family households (213 | 34.9%) represent the smallest median household size with 1.06 persons per household.
| Household Type | # Households | Household Size |
| Married-Couple | 309 (50.6%) | 2.93 |
| Single Male/Father | 38 (6.2%) | 6.32 |
| Single Female/Mother | 51 (8.4%) | 3.33 |
| Non-family | 213 (34.9%) | 1.06 |
| Total Households | 611 (100.0%) | 2.52 |
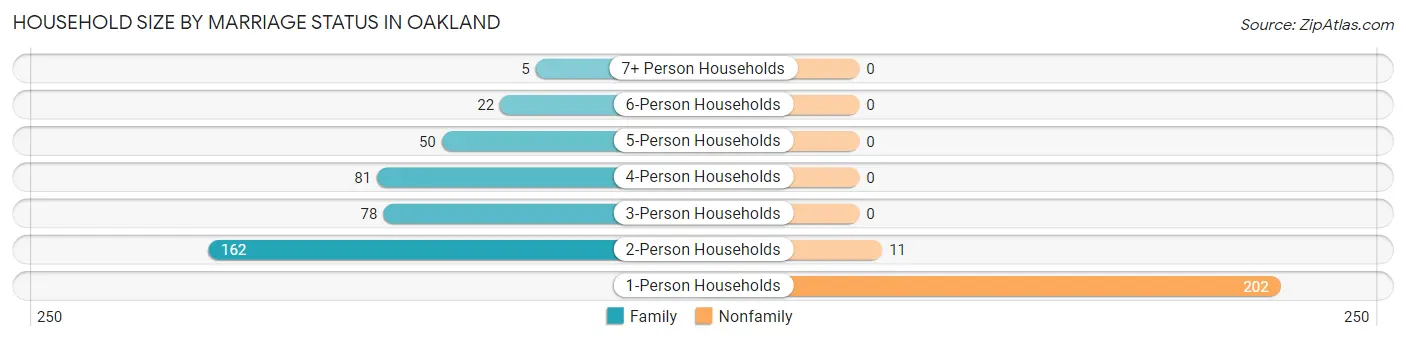
Household Size by Marriage Status in Oakland
Out of a total of 611 households in Oakland, 398 (65.1%) are family households, while 213 (34.9%) are nonfamily households. The most numerous type of family households are 2-person households, comprising 162, and the most common type of nonfamily households are 1-person households, comprising 202.
| Household Size | Family Households | Nonfamily Households |
| 1-Person Households | - | 202 (33.1%) |
| 2-Person Households | 162 (26.5%) | 11 (1.8%) |
| 3-Person Households | 78 (12.8%) | 0 (0.0%) |
| 4-Person Households | 81 (13.3%) | 0 (0.0%) |
| 5-Person Households | 50 (8.2%) | 0 (0.0%) |
| 6-Person Households | 22 (3.6%) | 0 (0.0%) |
| 7+ Person Households | 5 (0.8%) | 0 (0.0%) |
| Total | 398 (65.1%) | 213 (34.9%) |
Female Fertility in Oakland
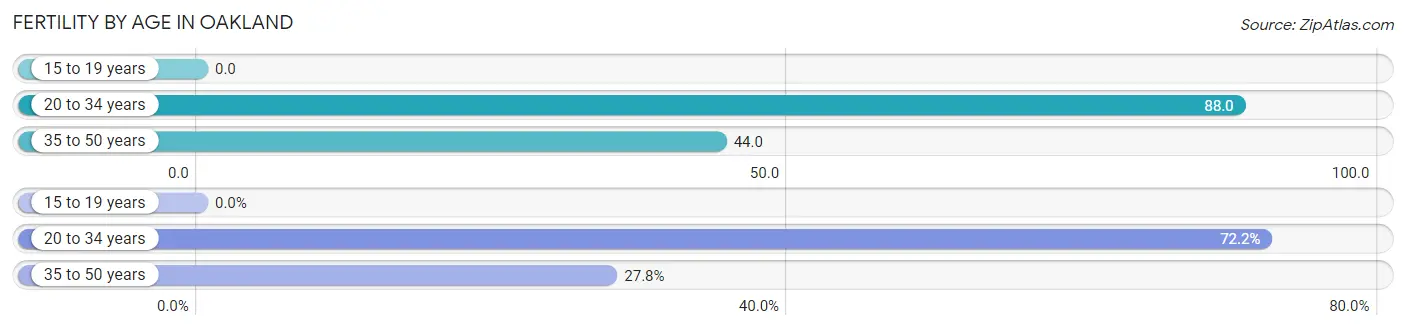
Fertility by Age in Oakland
Average fertility rate in Oakland is 56.0 births per 1,000 women. Women in the age bracket of 20 to 34 years have the highest fertility rate with 88.0 births per 1,000 women. Women in the age bracket of 20 to 34 years acount for 72.2% of all women with births.
| Age Bracket | Women with Births | Births / 1,000 Women |
| 15 to 19 years | 0 (0.0%) | 0.0 |
| 20 to 34 years | 13 (72.2%) | 88.0 |
| 35 to 50 years | 5 (27.8%) | 44.0 |
| Total | 18 (100.0%) | 56.0 |
Fertility by Age by Marriage Status in Oakland
27.8% of women with births (18) in Oakland are married. The highest percentage of unmarried women with births falls into 20 to 34 years age bracket with 100.0% of them unmarried at the time of birth, while the lowest percentage of unmarried women with births belong to 35 to 50 years age bracket with 0.0% of them unmarried.
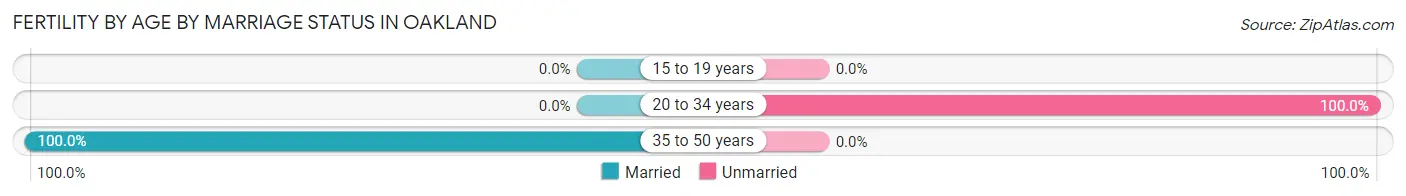
| Age Bracket | Married | Unmarried |
| 15 to 19 years | 0 (0.0%) | 0 (0.0%) |
| 20 to 34 years | 0 (0.0%) | 13 (100.0%) |
| 35 to 50 years | 5 (100.0%) | 0 (0.0%) |
| Total | 5 (27.8%) | 13 (72.2%) |
Fertility by Education in Oakland
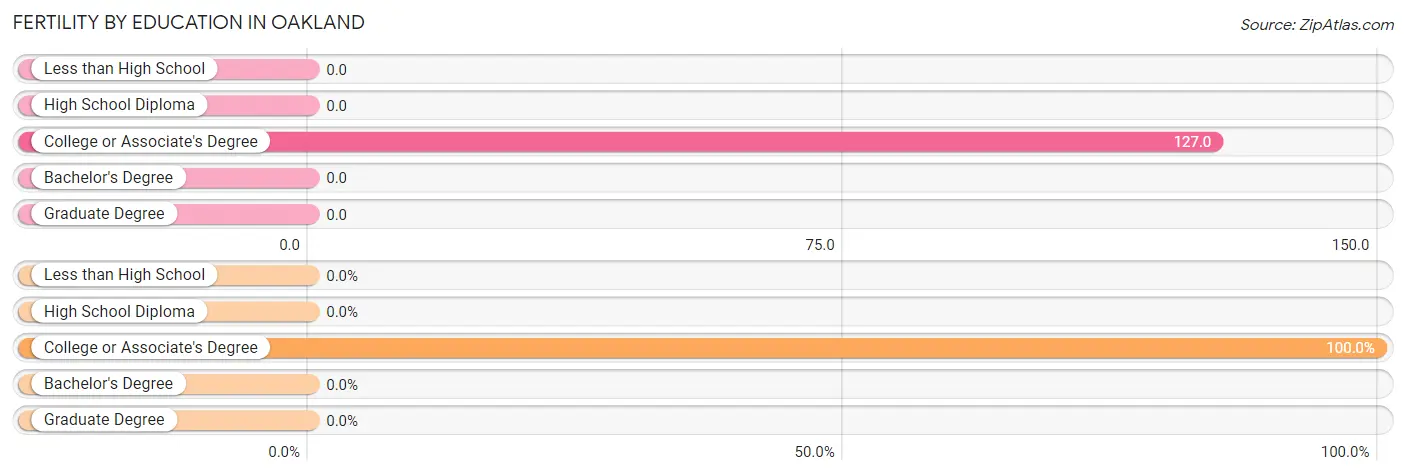
| Educational Attainment | Women with Births | Births / 1,000 Women |
| Less than High School | 0 (0.0%) | 0.0 |
| High School Diploma | 0 (0.0%) | 0.0 |
| College or Associate's Degree | 18 (100.0%) | 127.0 |
| Bachelor's Degree | 0 (0.0%) | 0.0 |
| Graduate Degree | 0 (0.0%) | 0.0 |
| Total | 18 (100.0%) | 56.0 |
Fertility by Education by Marriage Status in Oakland
72.2% of women with births in Oakland are unmarried. Women with the educational attainment of college or associate's degree are most likely to be married with 27.8% of them married at childbirth, while women with the educational attainment of college or associate's degree are least likely to be married with 72.2% of them unmarried at childbirth.
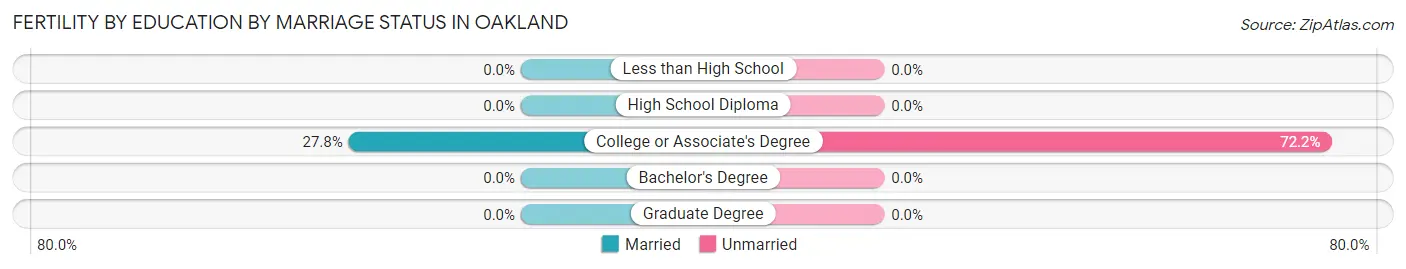
| Educational Attainment | Married | Unmarried |
| Less than High School | 0 (0.0%) | 0 (0.0%) |
| High School Diploma | 0 (0.0%) | 0 (0.0%) |
| College or Associate's Degree | 5 (27.8%) | 13 (72.2%) |
| Bachelor's Degree | 0 (0.0%) | 0 (0.0%) |
| Graduate Degree | 0 (0.0%) | 0 (0.0%) |
| Total | 5 (27.8%) | 13 (72.2%) |
Income in Oakland
Income Overview in Oakland
Per Capita Income in Oakland is $31,885, while median incomes of families and households are $82,000 and $66,406 respectively.
| Characteristic | Number | Measure |
| Per Capita Income | 1,578 | $31,885 |
| Median Family Income | 398 | $82,000 |
| Mean Family Income | 398 | $92,822 |
| Median Household Income | 611 | $66,406 |
| Mean Household Income | 611 | $77,868 |
| Income Deficit | 398 | $0 |
| Wage / Income Gap (%) | 1,578 | 9.14% |
| Wage / Income Gap ($) | 1,578 | 90.86¢ per $1 |
| Gini / Inequality Index | 1,578 | 0.42 |
Earnings by Sex in Oakland
Average Earnings in Oakland are $31,202, $33,281 for men and $30,240 for women, a difference of 9.1%.
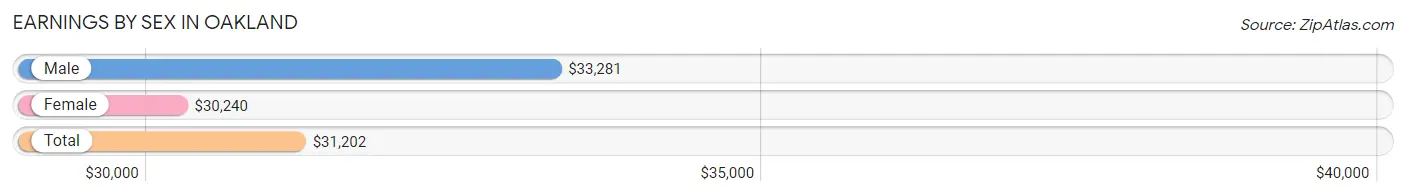
| Sex | Number | Average Earnings |
| Male | 450 (57.8%) | $33,281 |
| Female | 329 (42.2%) | $30,240 |
| Total | 779 (100.0%) | $31,202 |
Earnings by Sex by Income Bracket in Oakland
The most common earnings brackets in Oakland are $2,499 or less for men (59 | 13.1%) and $30,000 to $34,999 for women (45 | 13.7%).
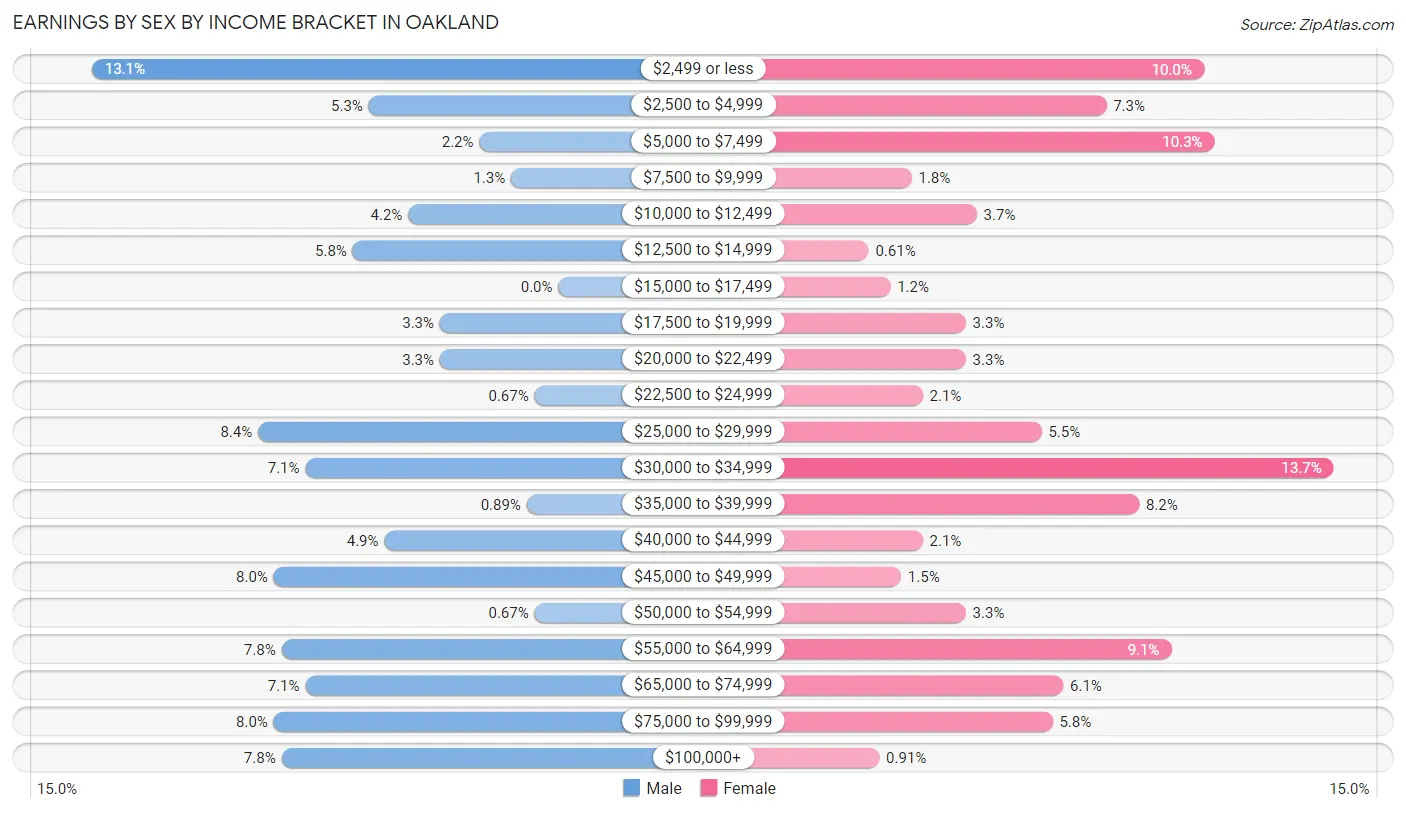
| Income | Male | Female |
| $2,499 or less | 59 (13.1%) | 33 (10.0%) |
| $2,500 to $4,999 | 24 (5.3%) | 24 (7.3%) |
| $5,000 to $7,499 | 10 (2.2%) | 34 (10.3%) |
| $7,500 to $9,999 | 6 (1.3%) | 6 (1.8%) |
| $10,000 to $12,499 | 19 (4.2%) | 12 (3.6%) |
| $12,500 to $14,999 | 26 (5.8%) | 2 (0.6%) |
| $15,000 to $17,499 | 0 (0.0%) | 4 (1.2%) |
| $17,500 to $19,999 | 15 (3.3%) | 11 (3.3%) |
| $20,000 to $22,499 | 15 (3.3%) | 11 (3.3%) |
| $22,500 to $24,999 | 3 (0.7%) | 7 (2.1%) |
| $25,000 to $29,999 | 38 (8.4%) | 18 (5.5%) |
| $30,000 to $34,999 | 32 (7.1%) | 45 (13.7%) |
| $35,000 to $39,999 | 4 (0.9%) | 27 (8.2%) |
| $40,000 to $44,999 | 22 (4.9%) | 7 (2.1%) |
| $45,000 to $49,999 | 36 (8.0%) | 5 (1.5%) |
| $50,000 to $54,999 | 3 (0.7%) | 11 (3.3%) |
| $55,000 to $64,999 | 35 (7.8%) | 30 (9.1%) |
| $65,000 to $74,999 | 32 (7.1%) | 20 (6.1%) |
| $75,000 to $99,999 | 36 (8.0%) | 19 (5.8%) |
| $100,000+ | 35 (7.8%) | 3 (0.9%) |
| Total | 450 (100.0%) | 329 (100.0%) |
Earnings by Sex by Educational Attainment in Oakland
Average earnings in Oakland are $45,500 for men and $32,404 for women, a difference of 28.8%. Men with an educational attainment of college or associate's degree enjoy the highest average annual earnings of $70,694, while those with less than high school education earn the least with $28,182. Women with an educational attainment of graduate degree earn the most with the average annual earnings of $83,571, while those with college or associate's degree education have the smallest earnings of $36,477.
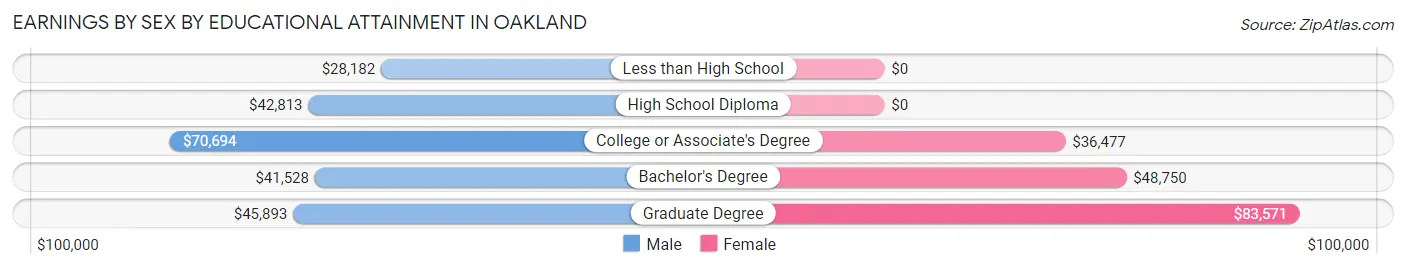
| Educational Attainment | Male Income | Female Income |
| Less than High School | $28,182 | $0 |
| High School Diploma | $42,813 | $0 |
| College or Associate's Degree | $70,694 | $36,477 |
| Bachelor's Degree | $41,528 | $48,750 |
| Graduate Degree | $45,893 | $83,571 |
| Total | $45,500 | $32,404 |
Family Income in Oakland
Family Income Brackets in Oakland
According to the Oakland family income data, there are 97 families falling into the $75,000 to $99,999 income range, which is the most common income bracket and makes up 24.4% of all families.
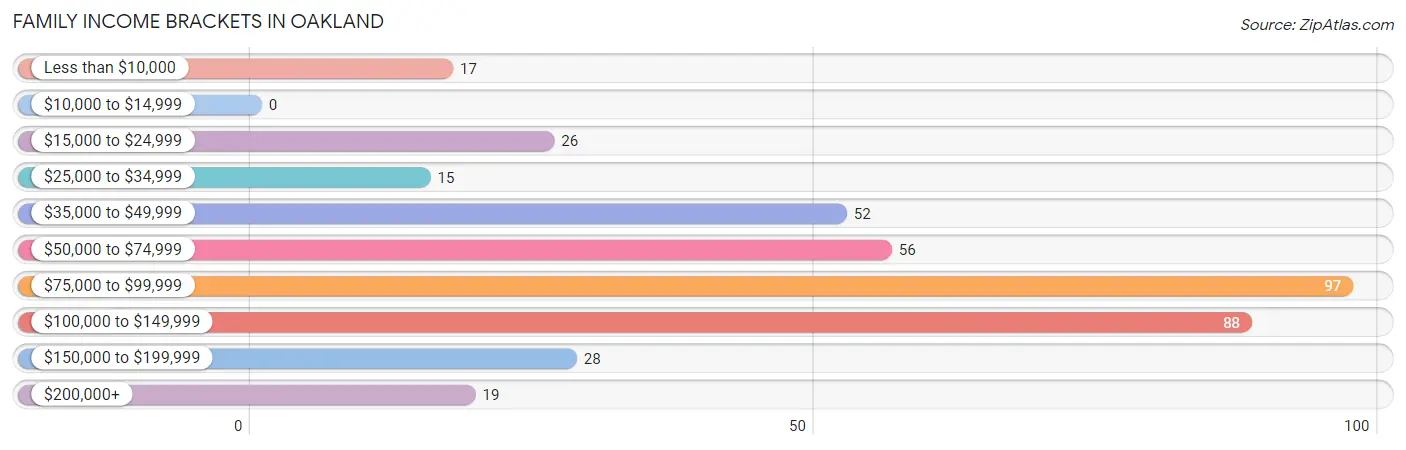
| Income Bracket | # Families | % Families |
| Less than $10,000 | 17 | 4.3% |
| $10,000 to $14,999 | 0 | 0.0% |
| $15,000 to $24,999 | 26 | 6.5% |
| $25,000 to $34,999 | 15 | 3.8% |
| $35,000 to $49,999 | 52 | 13.1% |
| $50,000 to $74,999 | 56 | 14.1% |
| $75,000 to $99,999 | 97 | 24.4% |
| $100,000 to $149,999 | 88 | 22.1% |
| $150,000 to $199,999 | 28 | 7.0% |
| $200,000+ | 19 | 4.8% |
Family Income by Famaliy Size in Oakland
5-person families (45 | 11.3%) account for the highest median family income in Oakland with $106,635 per family, while 2-person families (178 | 44.7%) have the highest median income of $40,375 per family member.
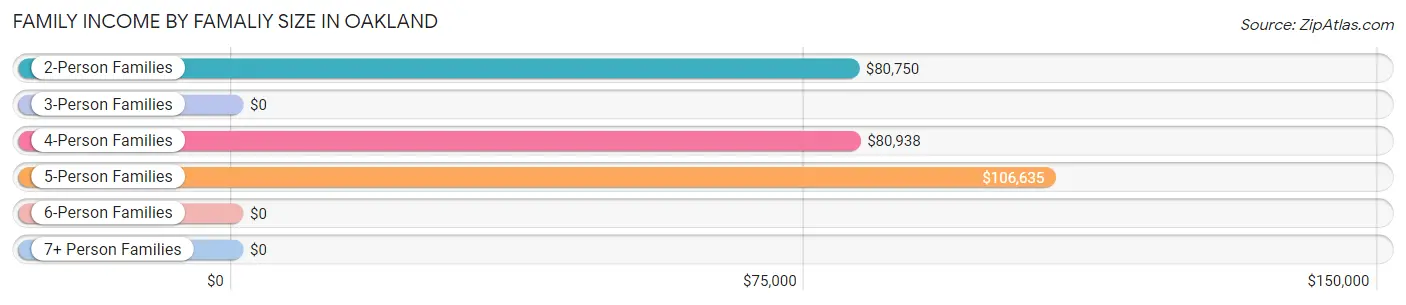
| Income Bracket | # Families | Median Income |
| 2-Person Families | 178 (44.7%) | $80,750 |
| 3-Person Families | 87 (21.9%) | $0 |
| 4-Person Families | 83 (20.8%) | $80,938 |
| 5-Person Families | 45 (11.3%) | $106,635 |
| 6-Person Families | 0 (0.0%) | $0 |
| 7+ Person Families | 5 (1.3%) | $0 |
| Total | 398 (100.0%) | $82,000 |
Family Income by Number of Earners in Oakland
The median family income in Oakland is $82,000, with families comprising 3+ earners (43) having the highest median family income of $106,442, while families with 1 earner (92) have the lowest median family income of $41,667, accounting for 10.8% and 23.1% of families, respectively.
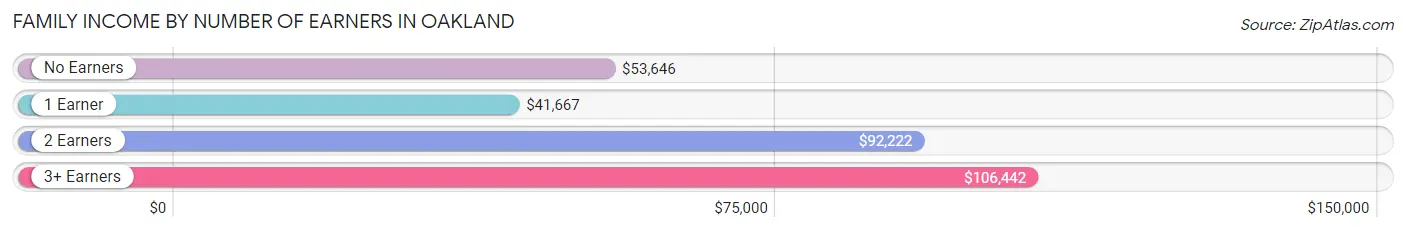
| Number of Earners | # Families | Median Income |
| No Earners | 89 (22.4%) | $53,646 |
| 1 Earner | 92 (23.1%) | $41,667 |
| 2 Earners | 174 (43.7%) | $92,222 |
| 3+ Earners | 43 (10.8%) | $106,442 |
| Total | 398 (100.0%) | $82,000 |
Household Income in Oakland
Household Income Brackets in Oakland
With 120 households falling in the category, the $75,000 to $99,999 income range is the most frequent in Oakland, accounting for 19.6% of all households. In contrast, only 17 households (2.8%) fall into the less than $10,000 income bracket, making it the least populous group.
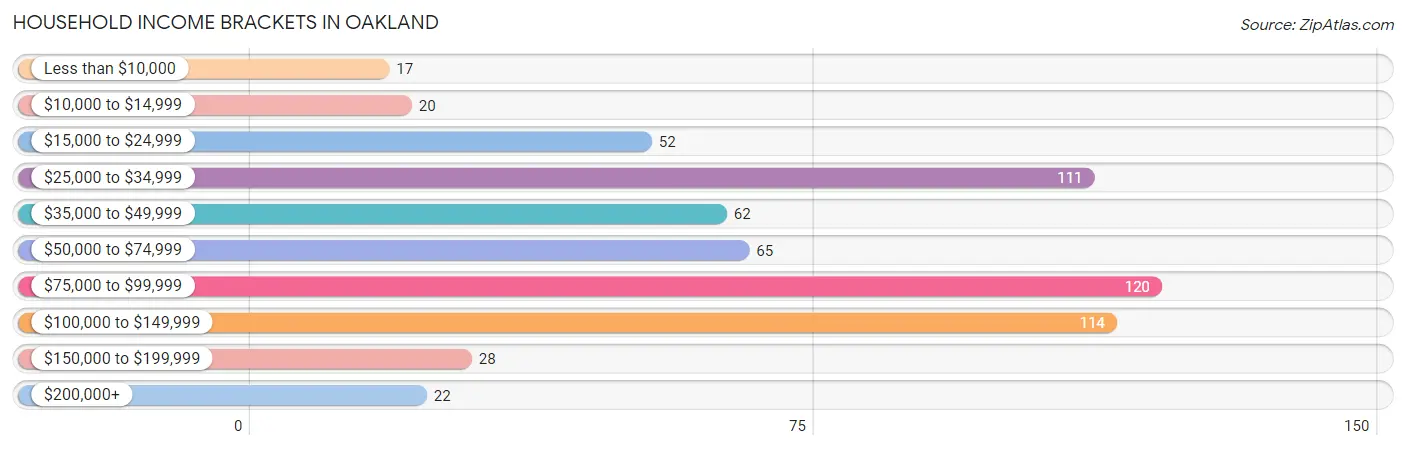
| Income Bracket | # Households | % Households |
| Less than $10,000 | 17 | 2.8% |
| $10,000 to $14,999 | 20 | 3.3% |
| $15,000 to $24,999 | 52 | 8.5% |
| $25,000 to $34,999 | 111 | 18.2% |
| $35,000 to $49,999 | 62 | 10.1% |
| $50,000 to $74,999 | 65 | 10.6% |
| $75,000 to $99,999 | 120 | 19.6% |
| $100,000 to $149,999 | 114 | 18.7% |
| $150,000 to $199,999 | 28 | 4.6% |
| $200,000+ | 22 | 3.6% |
Household Income by Householder Age in Oakland
The median household income in Oakland is $66,406, with the highest median household income of $87,708 found in the 45 to 64 years age bracket for the primary householder. A total of 221 households (36.2%) fall into this category. Meanwhile, the 15 to 24 years age bracket for the primary householder has the lowest median household income of $32,969, with 40 households (6.6%) in this group.
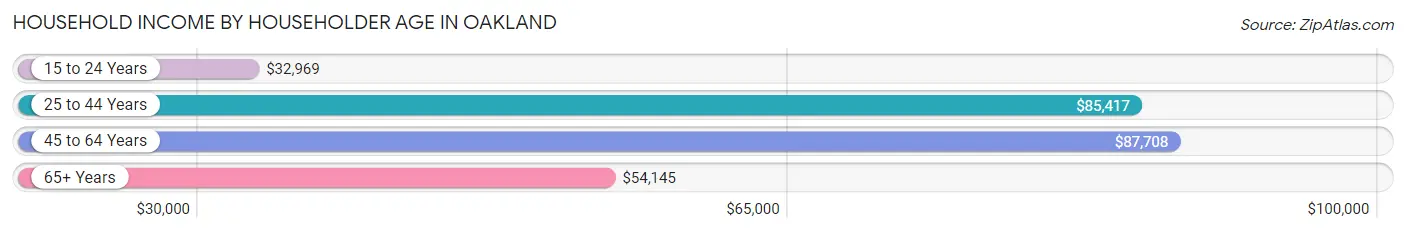
| Income Bracket | # Households | Median Income |
| 15 to 24 Years | 40 (6.6%) | $32,969 |
| 25 to 44 Years | 139 (22.8%) | $85,417 |
| 45 to 64 Years | 221 (36.2%) | $87,708 |
| 65+ Years | 211 (34.5%) | $54,145 |
| Total | 611 (100.0%) | $66,406 |
Poverty in Oakland
Income Below Poverty by Sex and Age in Oakland
With 13.4% poverty level for males and 12.3% for females among the residents of Oakland, 18 to 24 year old males and under 5 year old females are the most vulnerable to poverty, with 34 males (35.4%) and 20 females (41.7%) in their respective age groups living below the poverty level.
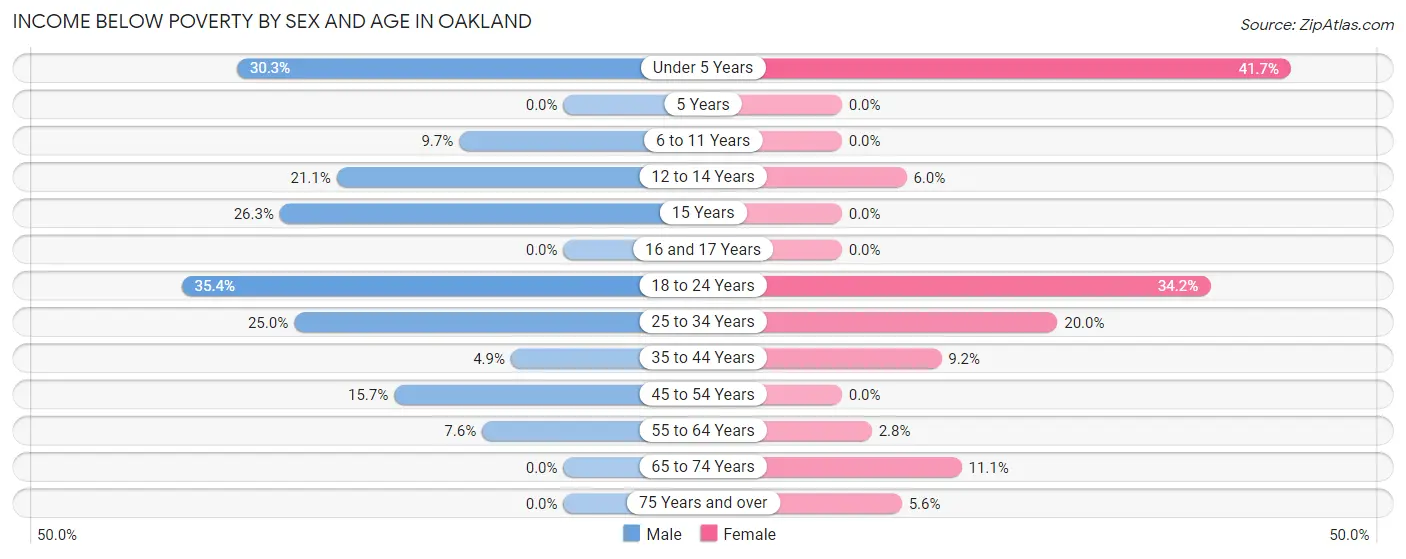
| Age Bracket | Male | Female |
| Under 5 Years | 10 (30.3%) | 20 (41.7%) |
| 5 Years | 0 (0.0%) | 0 (0.0%) |
| 6 to 11 Years | 3 (9.7%) | 0 (0.0%) |
| 12 to 14 Years | 8 (21.0%) | 3 (6.0%) |
| 15 Years | 5 (26.3%) | 0 (0.0%) |
| 16 and 17 Years | 0 (0.0%) | 0 (0.0%) |
| 18 to 24 Years | 34 (35.4%) | 41 (34.2%) |
| 25 to 34 Years | 17 (25.0%) | 9 (20.0%) |
| 35 to 44 Years | 4 (4.9%) | 6 (9.2%) |
| 45 to 54 Years | 11 (15.7%) | 0 (0.0%) |
| 55 to 64 Years | 8 (7.5%) | 2 (2.8%) |
| 65 to 74 Years | 0 (0.0%) | 11 (11.1%) |
| 75 Years and over | 0 (0.0%) | 6 (5.6%) |
| Total | 100 (13.4%) | 98 (12.3%) |
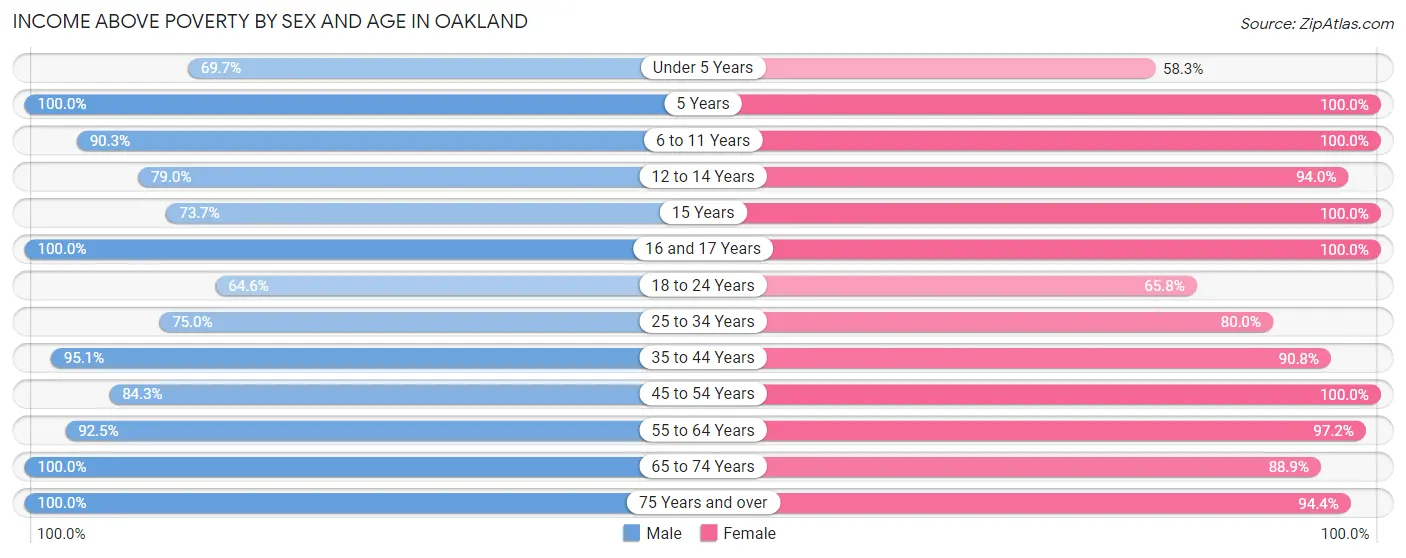
Income Above Poverty by Sex and Age in Oakland
According to the poverty statistics in Oakland, males aged 5 years and females aged 5 years are the age groups that are most secure financially, with 100.0% of males and 100.0% of females in these age groups living above the poverty line.
| Age Bracket | Male | Female |
| Under 5 Years | 23 (69.7%) | 28 (58.3%) |
| 5 Years | 2 (100.0%) | 1 (100.0%) |
| 6 to 11 Years | 28 (90.3%) | 68 (100.0%) |
| 12 to 14 Years | 30 (78.9%) | 47 (94.0%) |
| 15 Years | 14 (73.7%) | 30 (100.0%) |
| 16 and 17 Years | 34 (100.0%) | 15 (100.0%) |
| 18 to 24 Years | 62 (64.6%) | 79 (65.8%) |
| 25 to 34 Years | 51 (75.0%) | 36 (80.0%) |
| 35 to 44 Years | 78 (95.1%) | 59 (90.8%) |
| 45 to 54 Years | 59 (84.3%) | 78 (100.0%) |
| 55 to 64 Years | 98 (92.4%) | 70 (97.2%) |
| 65 to 74 Years | 75 (100.0%) | 88 (88.9%) |
| 75 Years and over | 95 (100.0%) | 102 (94.4%) |
| Total | 649 (86.7%) | 701 (87.7%) |
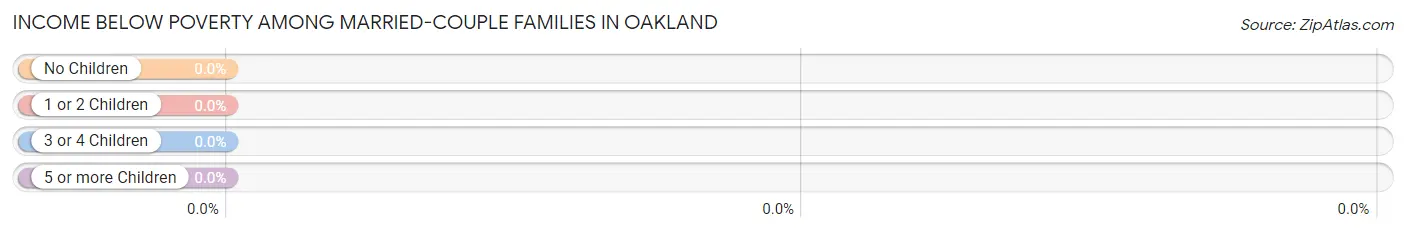
Income Below Poverty Among Married-Couple Families in Oakland
| Children | Above Poverty | Below Poverty |
| No Children | 161 (100.0%) | 0 (0.0%) |
| 1 or 2 Children | 108 (100.0%) | 0 (0.0%) |
| 3 or 4 Children | 39 (100.0%) | 0 (0.0%) |
| 5 or more Children | 1 (100.0%) | 0 (0.0%) |
| Total | 309 (100.0%) | 0 (0.0%) |
Income Below Poverty Among Single-Parent Households in Oakland
According to the poverty data in Oakland, 28.9% or 11 single-father households and 56.9% or 29 single-mother households are living below the poverty line. Among single-father households, those with 1 or 2 children have the highest poverty rate, with 11 households (33.3%) experiencing poverty. Likewise, among single-mother households, those with 1 or 2 children have the highest poverty rate, with 21 households (77.8%) falling below the poverty line.
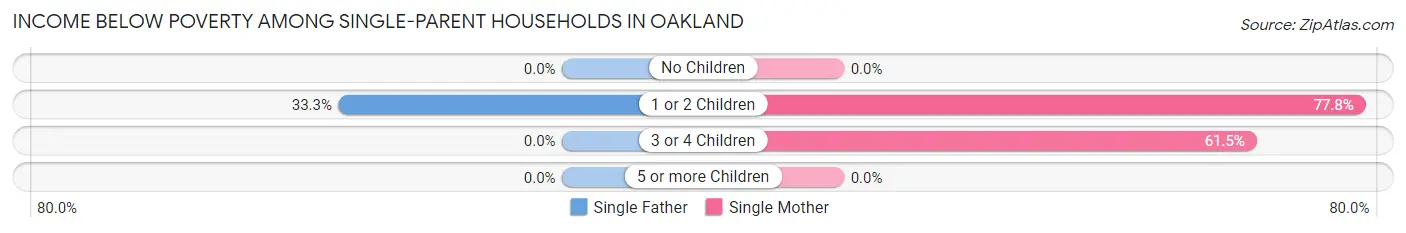
| Children | Single Father | Single Mother |
| No Children | 0 (0.0%) | 0 (0.0%) |
| 1 or 2 Children | 11 (33.3%) | 21 (77.8%) |
| 3 or 4 Children | 0 (0.0%) | 8 (61.5%) |
| 5 or more Children | 0 (0.0%) | 0 (0.0%) |
| Total | 11 (28.9%) | 29 (56.9%) |
Income Below Poverty Among Married-Couple vs Single-Parent Households in Oakland
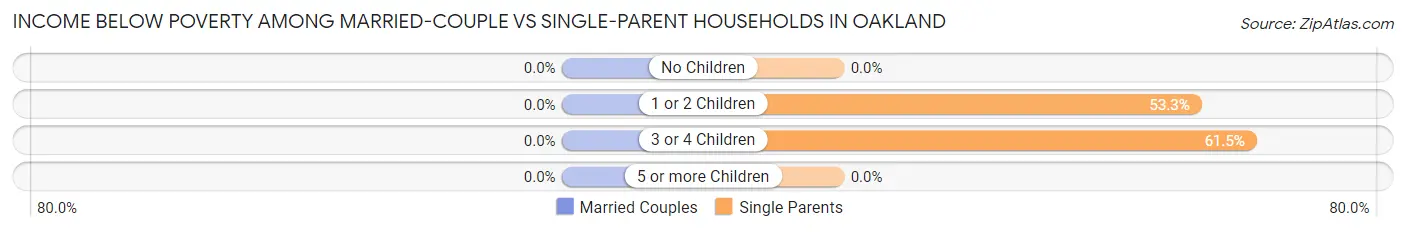
| Children | Married-Couple Families | Single-Parent Households |
| No Children | 0 (0.0%) | 0 (0.0%) |
| 1 or 2 Children | 0 (0.0%) | 32 (53.3%) |
| 3 or 4 Children | 0 (0.0%) | 8 (61.5%) |
| 5 or more Children | 0 (0.0%) | 0 (0.0%) |
| Total | 0 (0.0%) | 40 (44.9%) |
Employment Characteristics in Oakland
Employment by Class of Employer in Oakland
Among the 683 employed individuals in Oakland, private company employees (492 | 72.0%), not-for-profit organizations (95 | 13.9%), and local government employees (54 | 7.9%) make up the most common classes of employment.
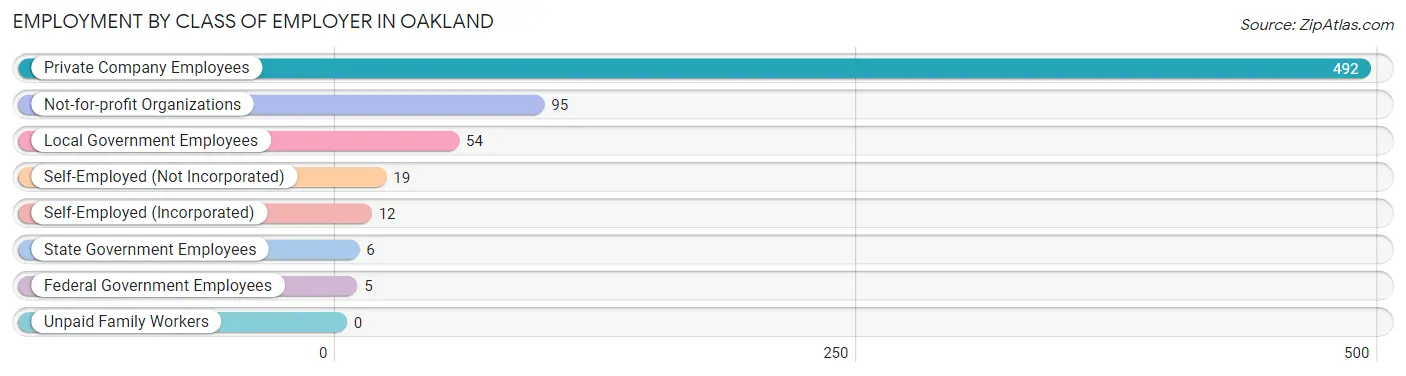
| Employer Class | # Employees | % Employees |
| Private Company Employees | 492 | 72.0% |
| Self-Employed (Incorporated) | 12 | 1.8% |
| Self-Employed (Not Incorporated) | 19 | 2.8% |
| Not-for-profit Organizations | 95 | 13.9% |
| Local Government Employees | 54 | 7.9% |
| State Government Employees | 6 | 0.9% |
| Federal Government Employees | 5 | 0.7% |
| Unpaid Family Workers | 0 | 0.0% |
| Total | 683 | 100.0% |
Employment Status by Age in Oakland
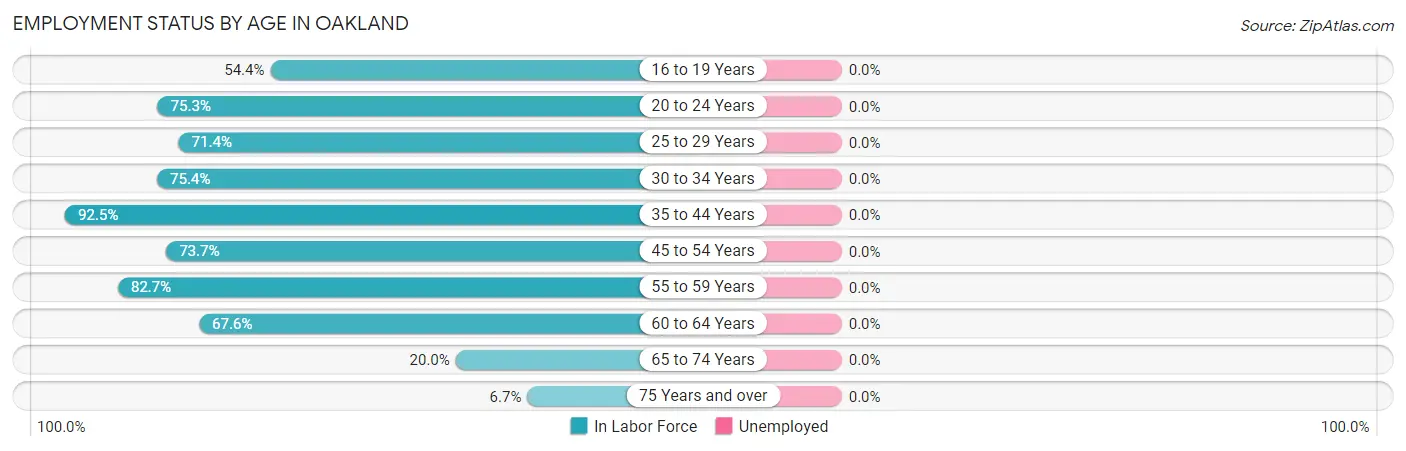
| Age Bracket | In Labor Force | Unemployed |
| 16 to 19 Years | 43 (54.4%) | 0 (0.0%) |
| 20 to 24 Years | 140 (75.3%) | 0 (0.0%) |
| 25 to 29 Years | 40 (71.4%) | 0 (0.0%) |
| 30 to 34 Years | 43 (75.4%) | 0 (0.0%) |
| 35 to 44 Years | 136 (92.5%) | 0 (0.0%) |
| 45 to 54 Years | 115 (73.7%) | 0 (0.0%) |
| 55 to 59 Years | 67 (82.7%) | 0 (0.0%) |
| 60 to 64 Years | 73 (67.6%) | 0 (0.0%) |
| 65 to 74 Years | 36 (20.0%) | 0 (0.0%) |
| 75 Years and over | 14 (6.7%) | 0 (0.0%) |
| Total | 707 (56.2%) | 0 (0.0%) |
Employment Status by Educational Attainment in Oakland
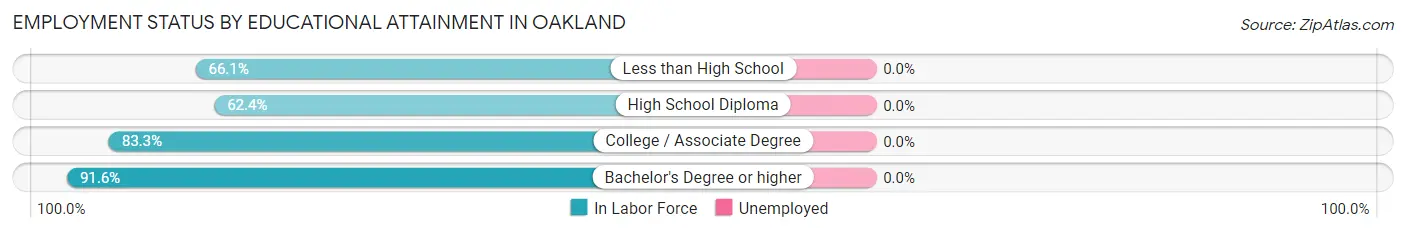
| Educational Attainment | In Labor Force | Unemployed |
| Less than High School | 39 (66.1%) | 0 (0.0%) |
| High School Diploma | 98 (62.4%) | 0 (0.0%) |
| College / Associate Degree | 195 (83.3%) | 0 (0.0%) |
| Bachelor's Degree or higher | 142 (91.6%) | 0 (0.0%) |
| Total | 474 (78.3%) | 0 (0.0%) |
Employment Occupations by Sex in Oakland
Management, Business, Science and Arts Occupations
The most common Management, Business, Science and Arts occupations in Oakland are Management (68 | 9.6%), Community & Social Service (62 | 8.8%), Education Instruction & Library (38 | 5.4%), Health Diagnosing & Treating (30 | 4.2%), and Health Technologists (26 | 3.7%).
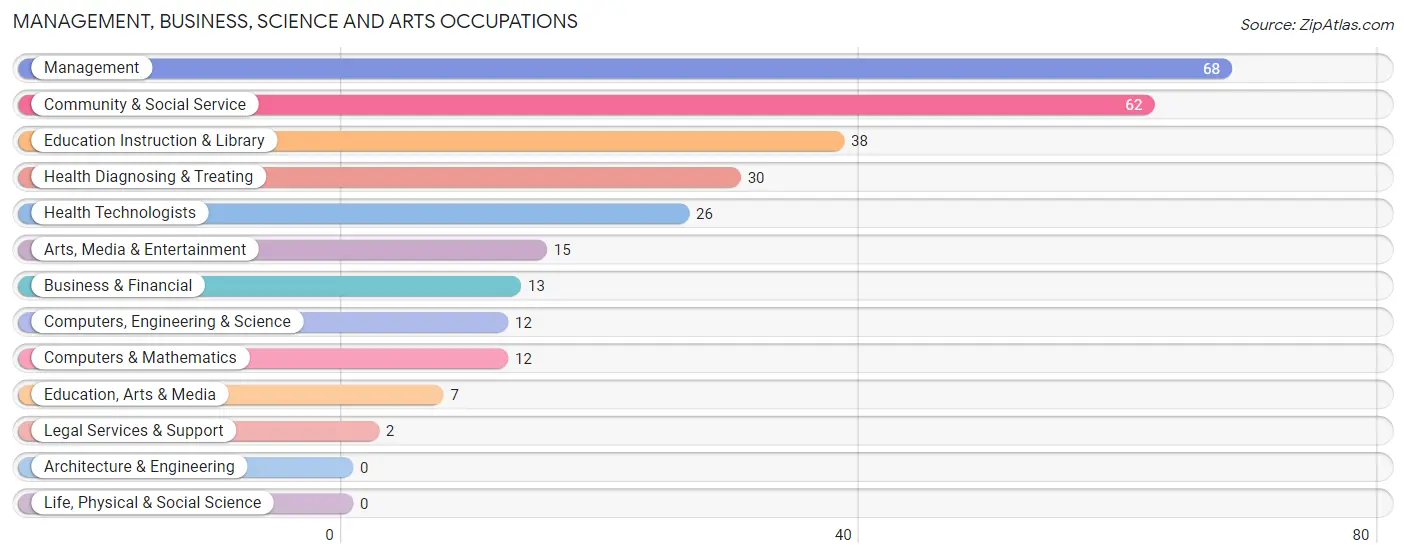
Management, Business, Science and Arts Occupations by Sex
Within the Management, Business, Science and Arts occupations in Oakland, the most male-oriented occupations are Education, Arts & Media (100.0%), Computers, Engineering & Science (83.3%), and Computers & Mathematics (83.3%), while the most female-oriented occupations are Legal Services & Support (100.0%), Education Instruction & Library (86.8%), and Health Diagnosing & Treating (86.7%).
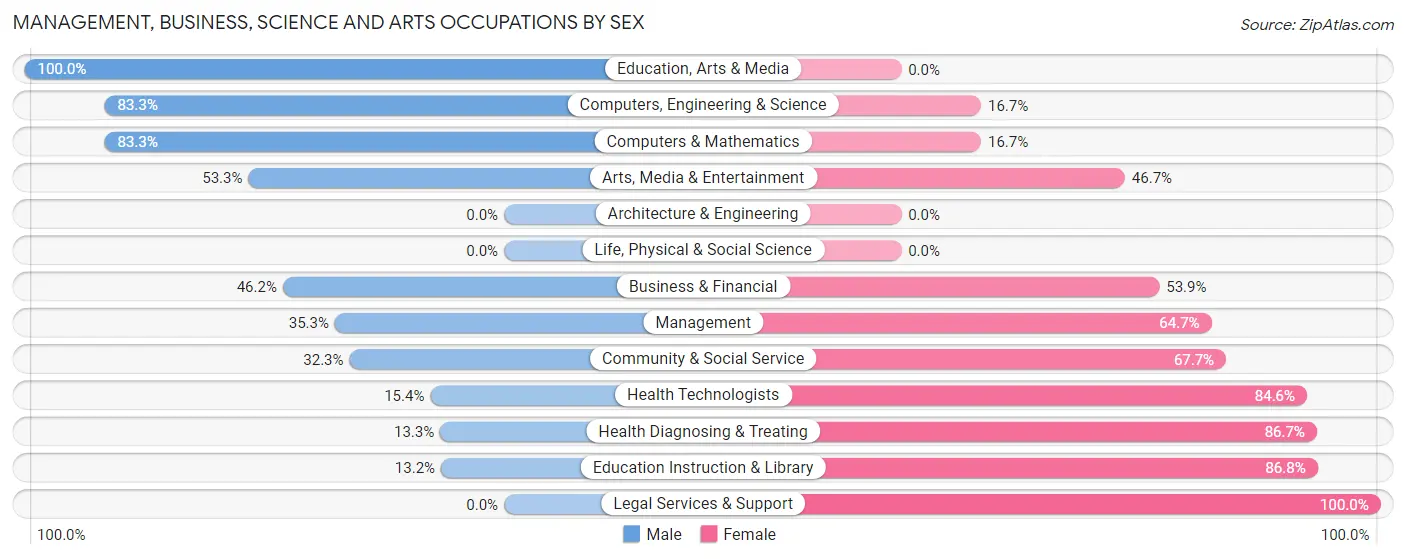
| Occupation | Male | Female |
| Management | 24 (35.3%) | 44 (64.7%) |
| Business & Financial | 6 (46.2%) | 7 (53.8%) |
| Computers, Engineering & Science | 10 (83.3%) | 2 (16.7%) |
| Computers & Mathematics | 10 (83.3%) | 2 (16.7%) |
| Architecture & Engineering | 0 (0.0%) | 0 (0.0%) |
| Life, Physical & Social Science | 0 (0.0%) | 0 (0.0%) |
| Community & Social Service | 20 (32.3%) | 42 (67.7%) |
| Education, Arts & Media | 7 (100.0%) | 0 (0.0%) |
| Legal Services & Support | 0 (0.0%) | 2 (100.0%) |
| Education Instruction & Library | 5 (13.2%) | 33 (86.8%) |
| Arts, Media & Entertainment | 8 (53.3%) | 7 (46.7%) |
| Health Diagnosing & Treating | 4 (13.3%) | 26 (86.7%) |
| Health Technologists | 4 (15.4%) | 22 (84.6%) |
| Total (Category) | 64 (34.6%) | 121 (65.4%) |
| Total (Overall) | 419 (59.3%) | 288 (40.7%) |
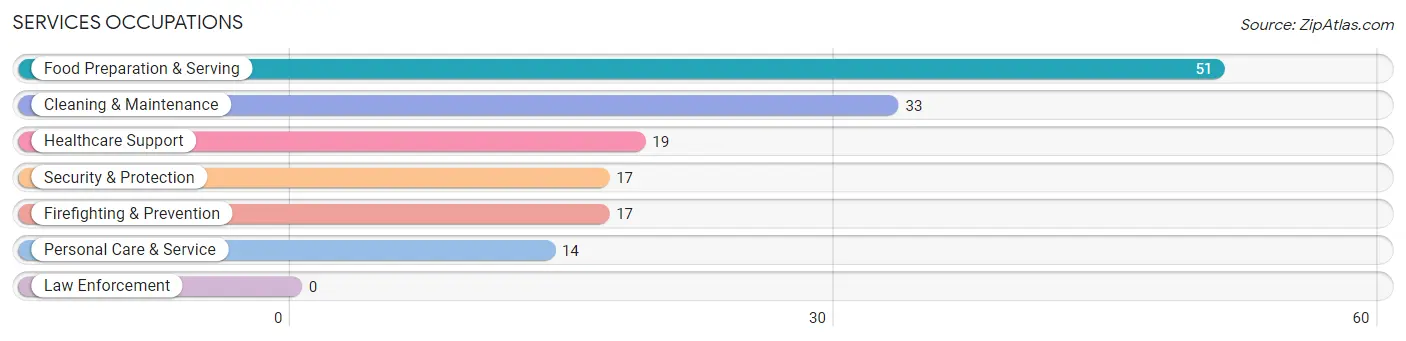
Services Occupations
The most common Services occupations in Oakland are Food Preparation & Serving (51 | 7.2%), Cleaning & Maintenance (33 | 4.7%), Healthcare Support (19 | 2.7%), Security & Protection (17 | 2.4%), and Firefighting & Prevention (17 | 2.4%).
Services Occupations by Sex
Within the Services occupations in Oakland, the most male-oriented occupations are Cleaning & Maintenance (93.9%), Security & Protection (47.1%), and Firefighting & Prevention (47.1%), while the most female-oriented occupations are Healthcare Support (100.0%), Personal Care & Service (64.3%), and Food Preparation & Serving (56.9%).
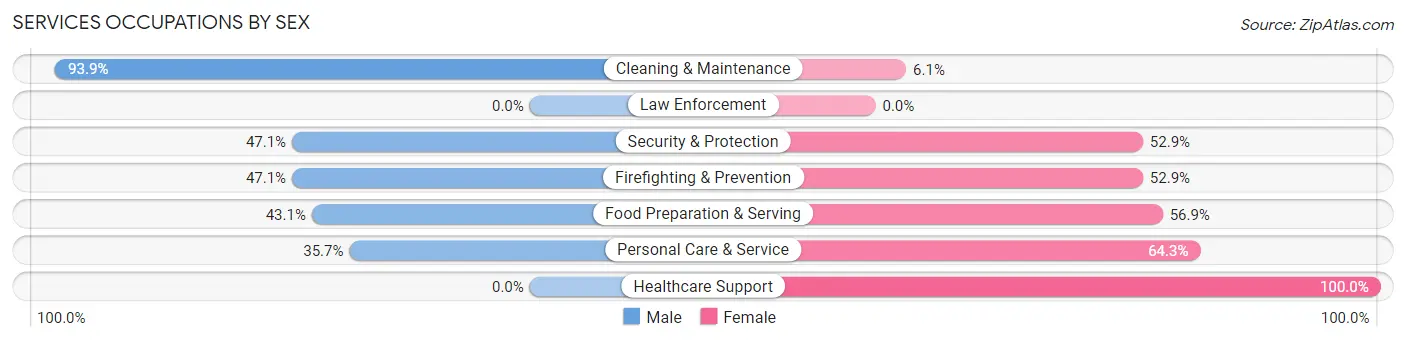
| Occupation | Male | Female |
| Healthcare Support | 0 (0.0%) | 19 (100.0%) |
| Security & Protection | 8 (47.1%) | 9 (52.9%) |
| Firefighting & Prevention | 8 (47.1%) | 9 (52.9%) |
| Law Enforcement | 0 (0.0%) | 0 (0.0%) |
| Food Preparation & Serving | 22 (43.1%) | 29 (56.9%) |
| Cleaning & Maintenance | 31 (93.9%) | 2 (6.1%) |
| Personal Care & Service | 5 (35.7%) | 9 (64.3%) |
| Total (Category) | 66 (49.2%) | 68 (50.7%) |
| Total (Overall) | 419 (59.3%) | 288 (40.7%) |
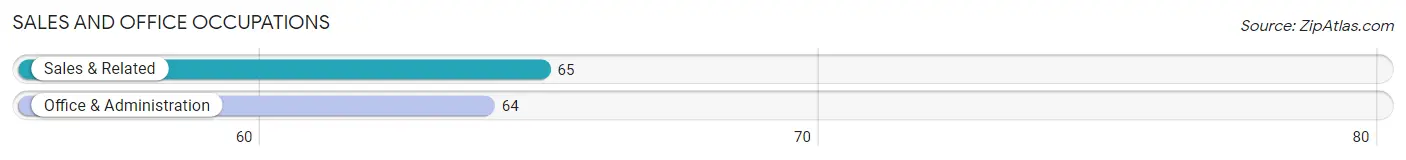
Sales and Office Occupations
The most common Sales and Office occupations in Oakland are Sales & Related (65 | 9.2%), and Office & Administration (64 | 9.0%).
Sales and Office Occupations by Sex
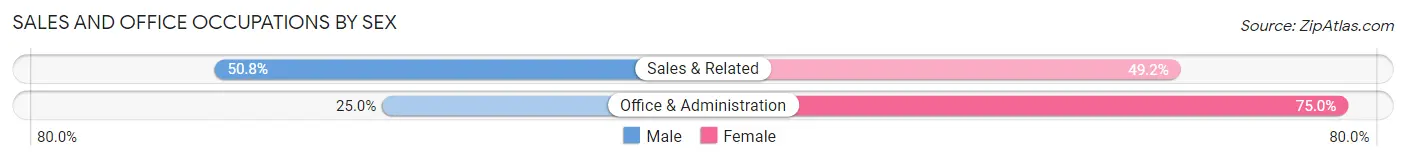
| Occupation | Male | Female |
| Sales & Related | 33 (50.8%) | 32 (49.2%) |
| Office & Administration | 16 (25.0%) | 48 (75.0%) |
| Total (Category) | 49 (38.0%) | 80 (62.0%) |
| Total (Overall) | 419 (59.3%) | 288 (40.7%) |
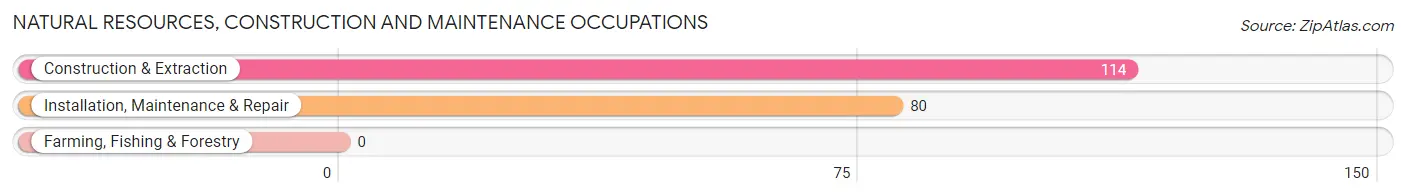
Natural Resources, Construction and Maintenance Occupations
The most common Natural Resources, Construction and Maintenance occupations in Oakland are Construction & Extraction (114 | 16.1%), and Installation, Maintenance & Repair (80 | 11.3%).
Natural Resources, Construction and Maintenance Occupations by Sex
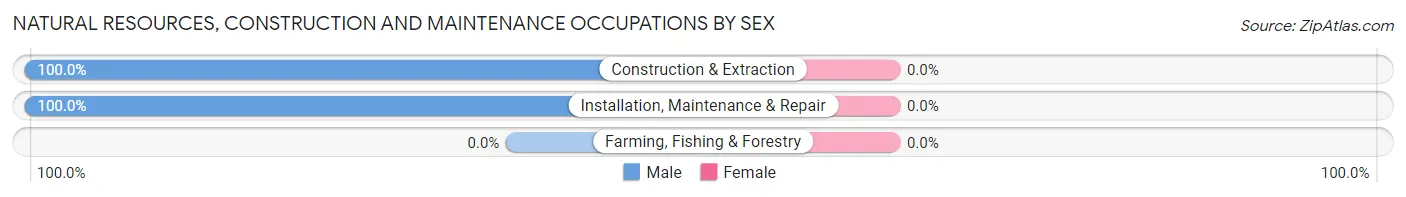
| Occupation | Male | Female |
| Farming, Fishing & Forestry | 0 (0.0%) | 0 (0.0%) |
| Construction & Extraction | 114 (100.0%) | 0 (0.0%) |
| Installation, Maintenance & Repair | 80 (100.0%) | 0 (0.0%) |
| Total (Category) | 194 (100.0%) | 0 (0.0%) |
| Total (Overall) | 419 (59.3%) | 288 (40.7%) |
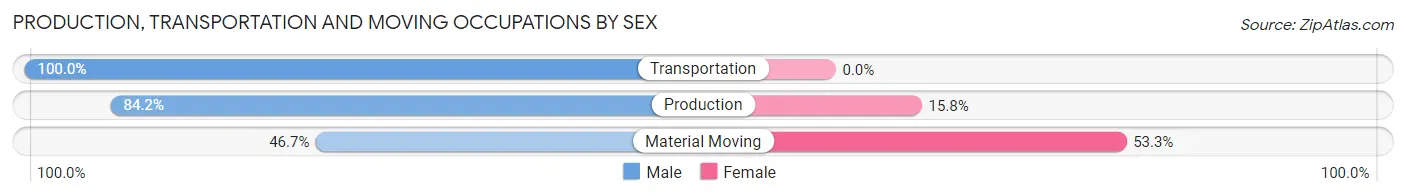
Production, Transportation and Moving Occupations
The most common Production, Transportation and Moving occupations in Oakland are Material Moving (30 | 4.2%), Production (19 | 2.7%), and Transportation (16 | 2.3%).
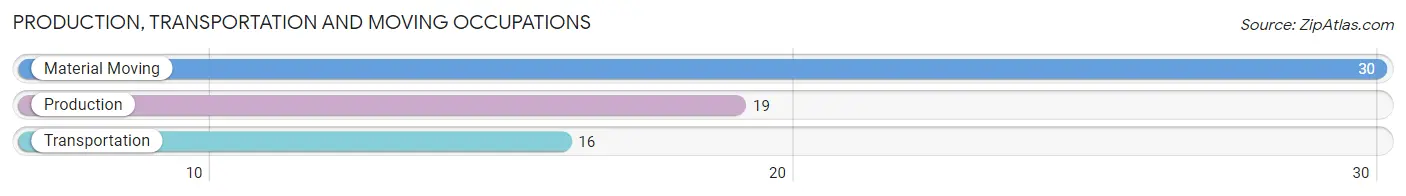
Production, Transportation and Moving Occupations by Sex
| Occupation | Male | Female |
| Production | 16 (84.2%) | 3 (15.8%) |
| Transportation | 16 (100.0%) | 0 (0.0%) |
| Material Moving | 14 (46.7%) | 16 (53.3%) |
| Total (Category) | 46 (70.8%) | 19 (29.2%) |
| Total (Overall) | 419 (59.3%) | 288 (40.7%) |
Employment Industries by Sex in Oakland
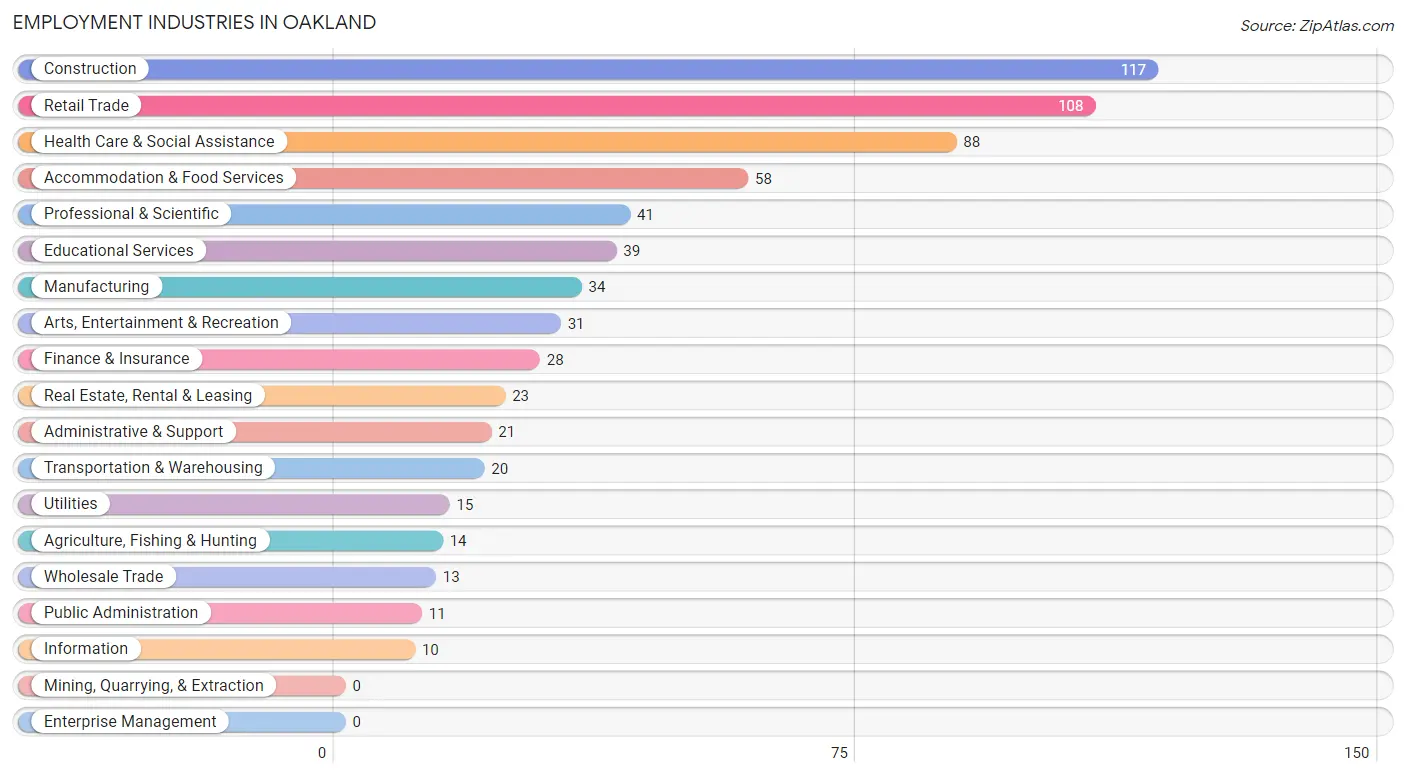
Employment Industries in Oakland
The major employment industries in Oakland include Construction (117 | 16.6%), Retail Trade (108 | 15.3%), Health Care & Social Assistance (88 | 12.4%), Accommodation & Food Services (58 | 8.2%), and Professional & Scientific (41 | 5.8%).
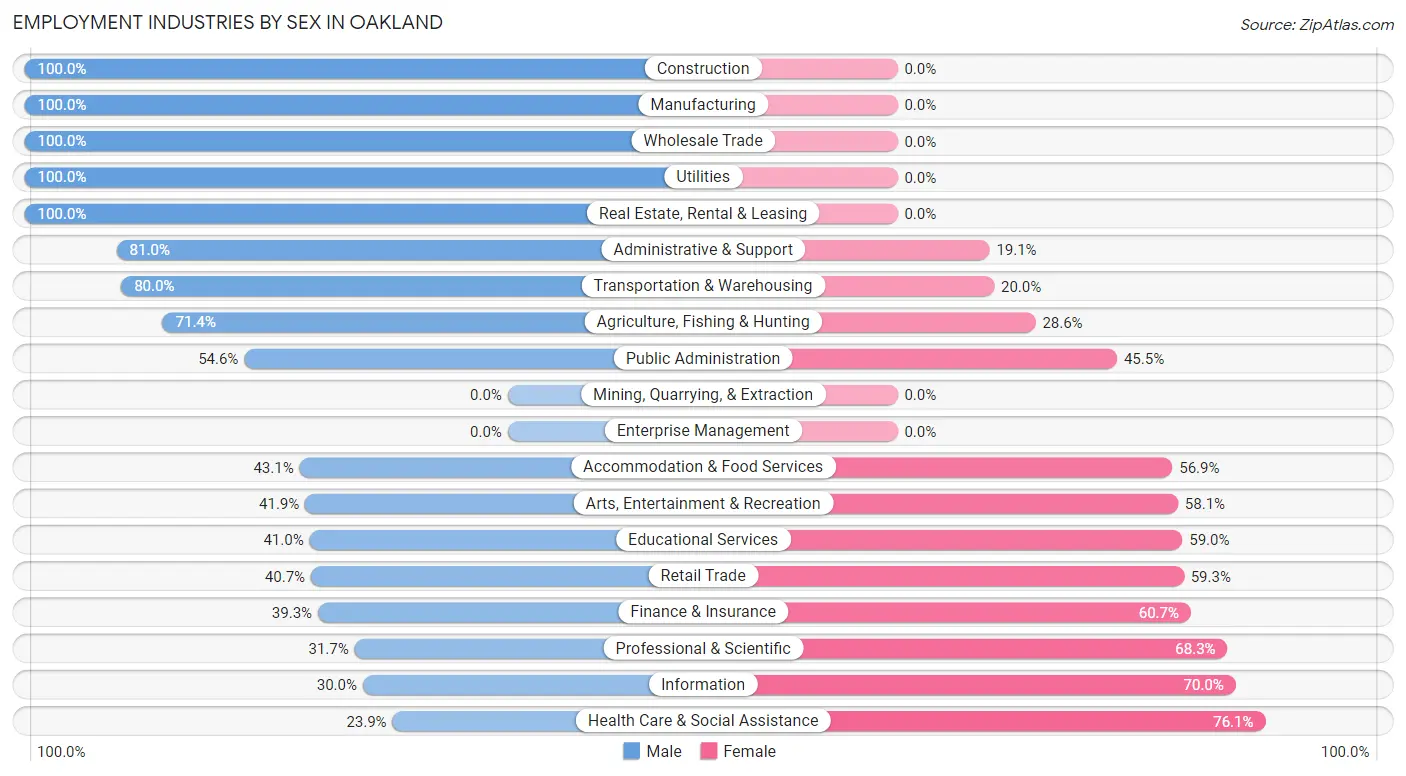
Employment Industries by Sex in Oakland
The Oakland industries that see more men than women are Construction (100.0%), Manufacturing (100.0%), and Wholesale Trade (100.0%), whereas the industries that tend to have a higher number of women are Health Care & Social Assistance (76.1%), Information (70.0%), and Professional & Scientific (68.3%).
| Industry | Male | Female |
| Agriculture, Fishing & Hunting | 10 (71.4%) | 4 (28.6%) |
| Mining, Quarrying, & Extraction | 0 (0.0%) | 0 (0.0%) |
| Construction | 117 (100.0%) | 0 (0.0%) |
| Manufacturing | 34 (100.0%) | 0 (0.0%) |
| Wholesale Trade | 13 (100.0%) | 0 (0.0%) |
| Retail Trade | 44 (40.7%) | 64 (59.3%) |
| Transportation & Warehousing | 16 (80.0%) | 4 (20.0%) |
| Utilities | 15 (100.0%) | 0 (0.0%) |
| Information | 3 (30.0%) | 7 (70.0%) |
| Finance & Insurance | 11 (39.3%) | 17 (60.7%) |
| Real Estate, Rental & Leasing | 23 (100.0%) | 0 (0.0%) |
| Professional & Scientific | 13 (31.7%) | 28 (68.3%) |
| Enterprise Management | 0 (0.0%) | 0 (0.0%) |
| Administrative & Support | 17 (80.9%) | 4 (19.1%) |
| Educational Services | 16 (41.0%) | 23 (59.0%) |
| Health Care & Social Assistance | 21 (23.9%) | 67 (76.1%) |
| Arts, Entertainment & Recreation | 13 (41.9%) | 18 (58.1%) |
| Accommodation & Food Services | 25 (43.1%) | 33 (56.9%) |
| Public Administration | 6 (54.5%) | 5 (45.5%) |
| Total | 419 (59.3%) | 288 (40.7%) |
Education in Oakland
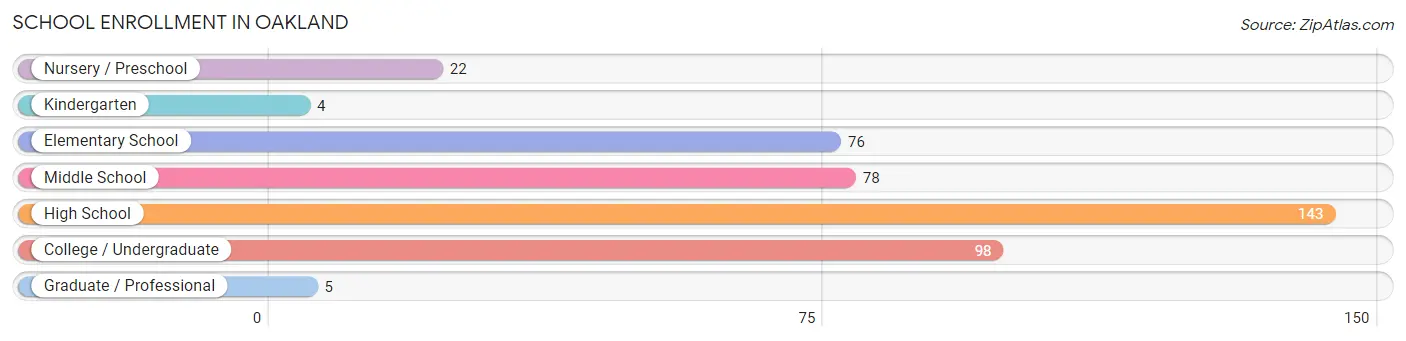
School Enrollment in Oakland
The most common levels of schooling among the 426 students in Oakland are high school (143 | 33.6%), college / undergraduate (98 | 23.0%), and middle school (78 | 18.3%).
| School Level | # Students | % Students |
| Nursery / Preschool | 22 | 5.2% |
| Kindergarten | 4 | 0.9% |
| Elementary School | 76 | 17.8% |
| Middle School | 78 | 18.3% |
| High School | 143 | 33.6% |
| College / Undergraduate | 98 | 23.0% |
| Graduate / Professional | 5 | 1.2% |
| Total | 426 | 100.0% |
School Enrollment by Age by Funding Source in Oakland
Out of a total of 426 students who are enrolled in schools in Oakland, 5 (1.2%) attend a private institution, while the remaining 421 (98.8%) are enrolled in public schools. The age group of 10 to 14 year olds has the highest likelihood of being enrolled in private schools, with 3 (2.1% in the age bracket) enrolled. Conversely, the age group of 3 to 4 year olds has the lowest likelihood of being enrolled in a private school, with 20 (100.0% in the age bracket) attending a public institution.
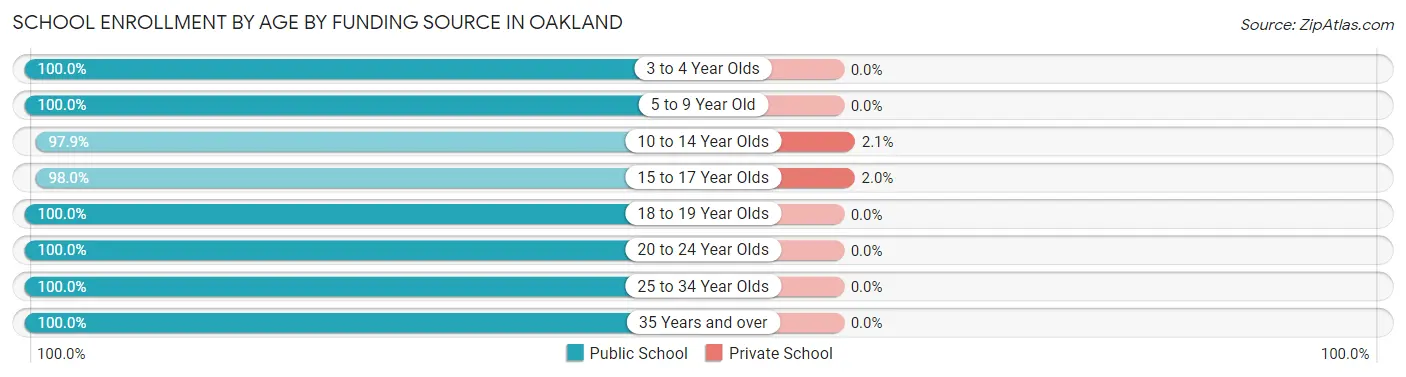
| Age Bracket | Public School | Private School |
| 3 to 4 Year Olds | 20 (100.0%) | 0 (0.0%) |
| 5 to 9 Year Old | 41 (100.0%) | 0 (0.0%) |
| 10 to 14 Year Olds | 142 (97.9%) | 3 (2.1%) |
| 15 to 17 Year Olds | 96 (98.0%) | 2 (2.0%) |
| 18 to 19 Year Olds | 21 (100.0%) | 0 (0.0%) |
| 20 to 24 Year Olds | 89 (100.0%) | 0 (0.0%) |
| 25 to 34 Year Olds | 4 (100.0%) | 0 (0.0%) |
| 35 Years and over | 8 (100.0%) | 0 (0.0%) |
| Total | 421 (98.8%) | 5 (1.2%) |
Educational Attainment by Field of Study in Oakland
Education (69 | 28.4%), business (42 | 17.3%), bio, nature & agricultural (26 | 10.7%), science & technology (25 | 10.3%), and psychology (23 | 9.5%) are the most common fields of study among 243 individuals in Oakland who have obtained a bachelor's degree or higher.
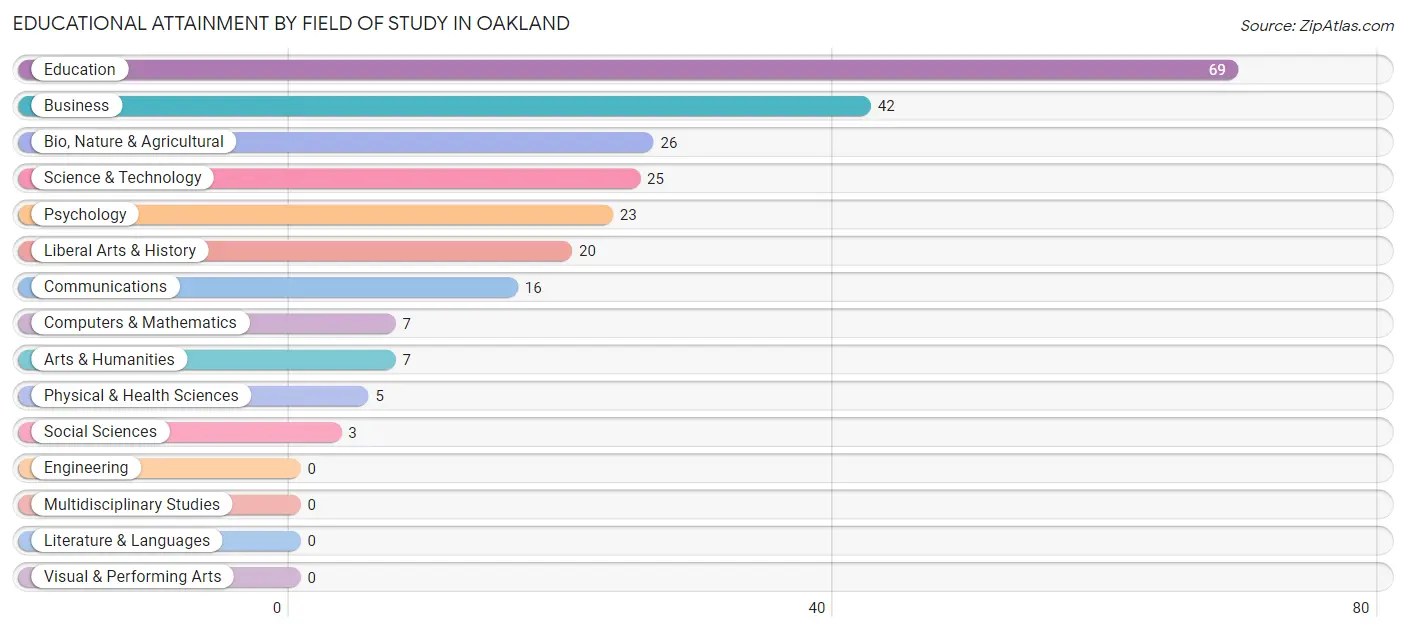
| Field of Study | # Graduates | % Graduates |
| Computers & Mathematics | 7 | 2.9% |
| Bio, Nature & Agricultural | 26 | 10.7% |
| Physical & Health Sciences | 5 | 2.1% |
| Psychology | 23 | 9.5% |
| Social Sciences | 3 | 1.2% |
| Engineering | 0 | 0.0% |
| Multidisciplinary Studies | 0 | 0.0% |
| Science & Technology | 25 | 10.3% |
| Business | 42 | 17.3% |
| Education | 69 | 28.4% |
| Literature & Languages | 0 | 0.0% |
| Liberal Arts & History | 20 | 8.2% |
| Visual & Performing Arts | 0 | 0.0% |
| Communications | 16 | 6.6% |
| Arts & Humanities | 7 | 2.9% |
| Total | 243 | 100.0% |
Transportation & Commute in Oakland
Vehicle Availability by Sex in Oakland
The most prevalent vehicle ownership categories in Oakland are males with 2 vehicles (152, accounting for 37.8%) and females with 2 vehicles (94, making up 55.3%).
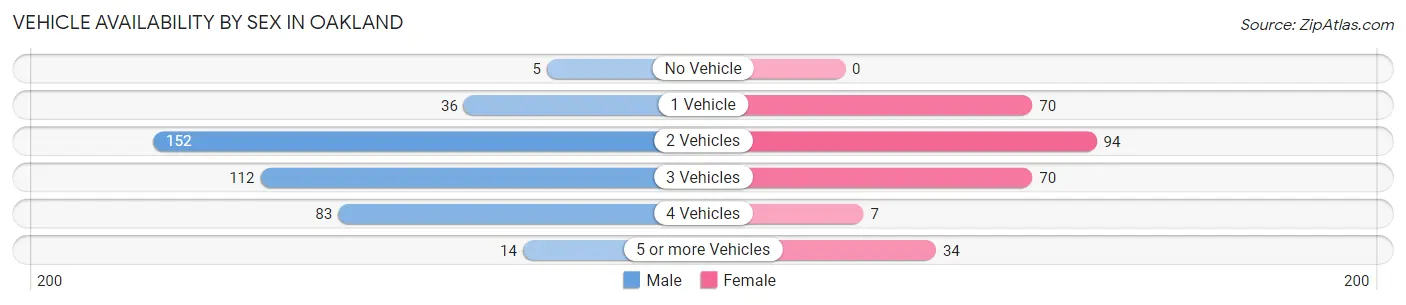
| Vehicles Available | Male | Female |
| No Vehicle | 5 (1.2%) | 0 (0.0%) |
| 1 Vehicle | 36 (9.0%) | 70 (25.5%) |
| 2 Vehicles | 152 (37.8%) | 94 (34.2%) |
| 3 Vehicles | 112 (27.9%) | 70 (25.5%) |
| 4 Vehicles | 83 (20.6%) | 7 (2.5%) |
| 5 or more Vehicles | 14 (3.5%) | 34 (12.4%) |
| Total | 402 (100.0%) | 275 (100.0%) |
Commute Time in Oakland
The most frequently occuring commute durations in Oakland are 5 to 9 minutes (198 commuters, 30.3%), 45 to 59 minutes (104 commuters, 15.9%), and less than 5 minutes (91 commuters, 13.9%).
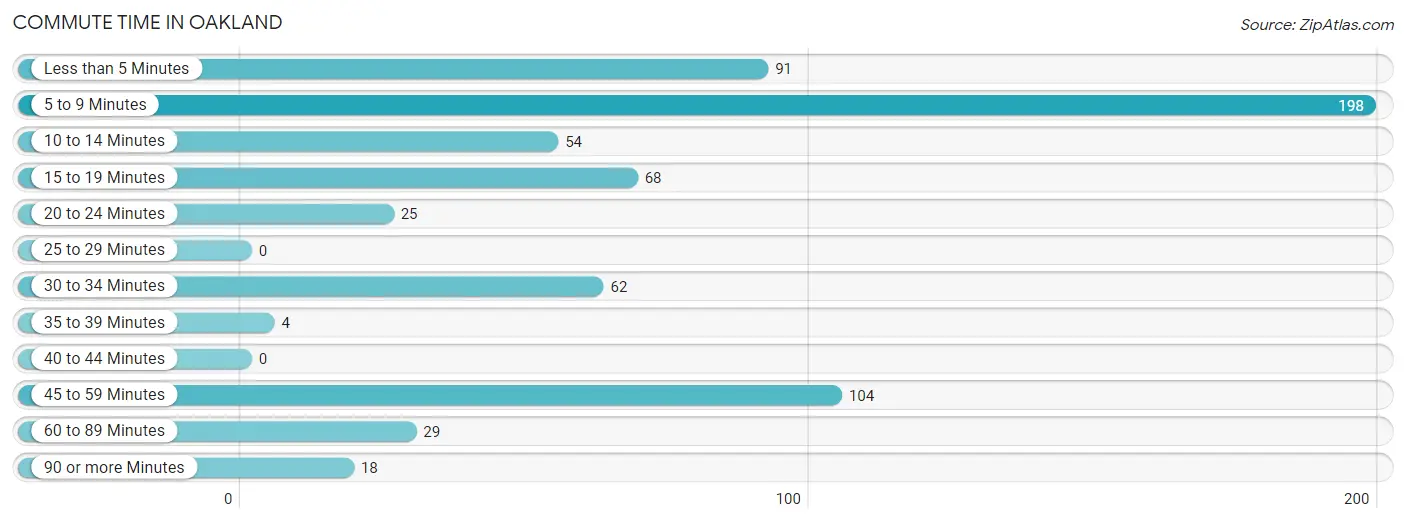
| Commute Time | # Commuters | % Commuters |
| Less than 5 Minutes | 91 | 13.9% |
| 5 to 9 Minutes | 198 | 30.3% |
| 10 to 14 Minutes | 54 | 8.3% |
| 15 to 19 Minutes | 68 | 10.4% |
| 20 to 24 Minutes | 25 | 3.8% |
| 25 to 29 Minutes | 0 | 0.0% |
| 30 to 34 Minutes | 62 | 9.5% |
| 35 to 39 Minutes | 4 | 0.6% |
| 40 to 44 Minutes | 0 | 0.0% |
| 45 to 59 Minutes | 104 | 15.9% |
| 60 to 89 Minutes | 29 | 4.4% |
| 90 or more Minutes | 18 | 2.8% |
Commute Time by Sex in Oakland
The most common commute times in Oakland are 5 to 9 minutes (111 commuters, 28.5%) for males and 5 to 9 minutes (87 commuters, 33.1%) for females.
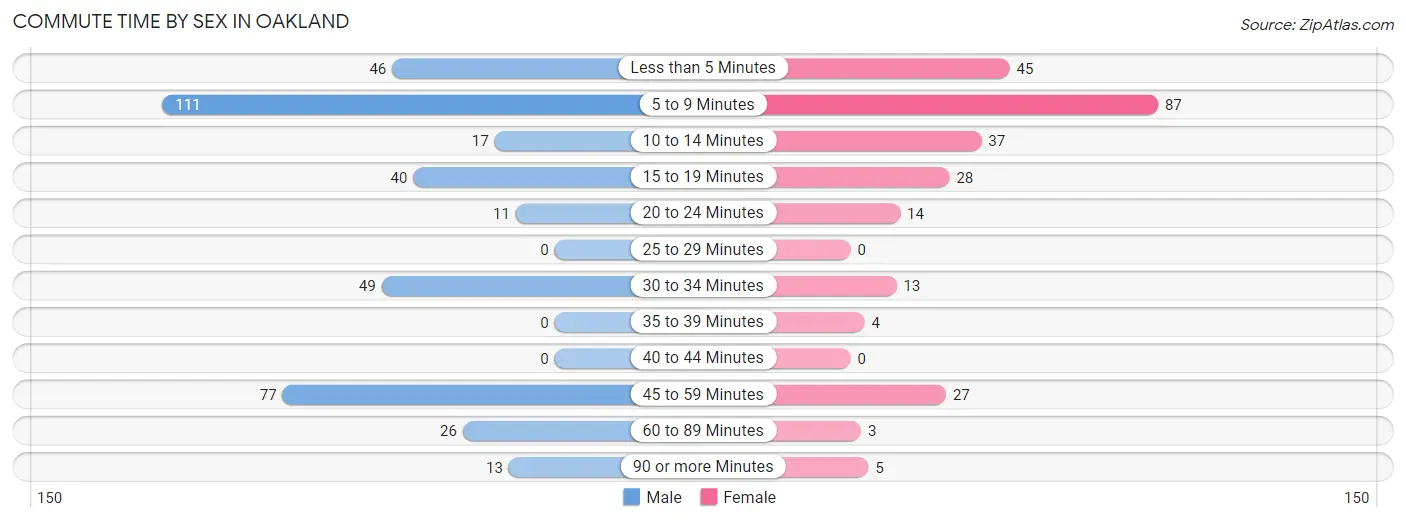
| Commute Time | Male | Female |
| Less than 5 Minutes | 46 (11.8%) | 45 (17.1%) |
| 5 to 9 Minutes | 111 (28.5%) | 87 (33.1%) |
| 10 to 14 Minutes | 17 (4.4%) | 37 (14.1%) |
| 15 to 19 Minutes | 40 (10.3%) | 28 (10.6%) |
| 20 to 24 Minutes | 11 (2.8%) | 14 (5.3%) |
| 25 to 29 Minutes | 0 (0.0%) | 0 (0.0%) |
| 30 to 34 Minutes | 49 (12.6%) | 13 (4.9%) |
| 35 to 39 Minutes | 0 (0.0%) | 4 (1.5%) |
| 40 to 44 Minutes | 0 (0.0%) | 0 (0.0%) |
| 45 to 59 Minutes | 77 (19.7%) | 27 (10.3%) |
| 60 to 89 Minutes | 26 (6.7%) | 3 (1.1%) |
| 90 or more Minutes | 13 (3.3%) | 5 (1.9%) |
Time of Departure to Work by Sex in Oakland
The most frequent times of departure to work in Oakland are 5:00 AM to 5:29 AM (70, 17.9%) for males and 7:30 AM to 7:59 AM (68, 25.9%) for females.
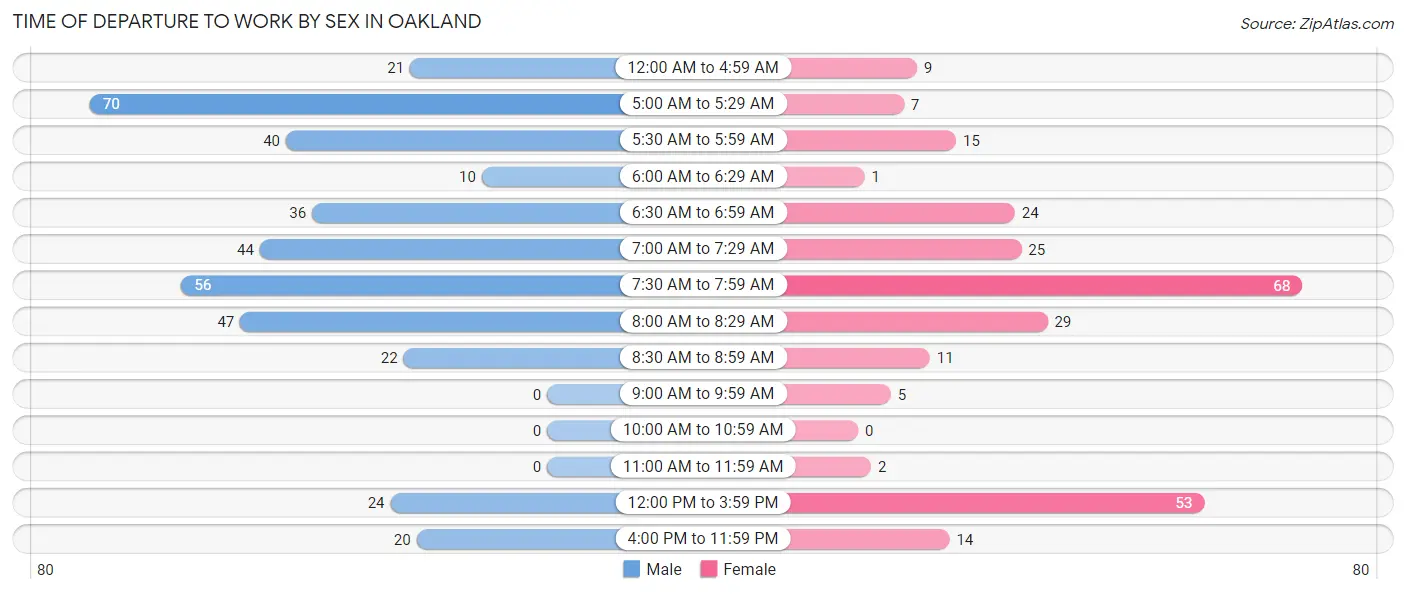
| Time of Departure | Male | Female |
| 12:00 AM to 4:59 AM | 21 (5.4%) | 9 (3.4%) |
| 5:00 AM to 5:29 AM | 70 (17.9%) | 7 (2.7%) |
| 5:30 AM to 5:59 AM | 40 (10.3%) | 15 (5.7%) |
| 6:00 AM to 6:29 AM | 10 (2.6%) | 1 (0.4%) |
| 6:30 AM to 6:59 AM | 36 (9.2%) | 24 (9.1%) |
| 7:00 AM to 7:29 AM | 44 (11.3%) | 25 (9.5%) |
| 7:30 AM to 7:59 AM | 56 (14.4%) | 68 (25.9%) |
| 8:00 AM to 8:29 AM | 47 (12.0%) | 29 (11.0%) |
| 8:30 AM to 8:59 AM | 22 (5.6%) | 11 (4.2%) |
| 9:00 AM to 9:59 AM | 0 (0.0%) | 5 (1.9%) |
| 10:00 AM to 10:59 AM | 0 (0.0%) | 0 (0.0%) |
| 11:00 AM to 11:59 AM | 0 (0.0%) | 2 (0.8%) |
| 12:00 PM to 3:59 PM | 24 (6.1%) | 53 (20.2%) |
| 4:00 PM to 11:59 PM | 20 (5.1%) | 14 (5.3%) |
| Total | 390 (100.0%) | 263 (100.0%) |
Housing Occupancy in Oakland
Occupancy by Ownership in Oakland
Of the total 611 dwellings in Oakland, owner-occupied units account for 441 (72.2%), while renter-occupied units make up 170 (27.8%).
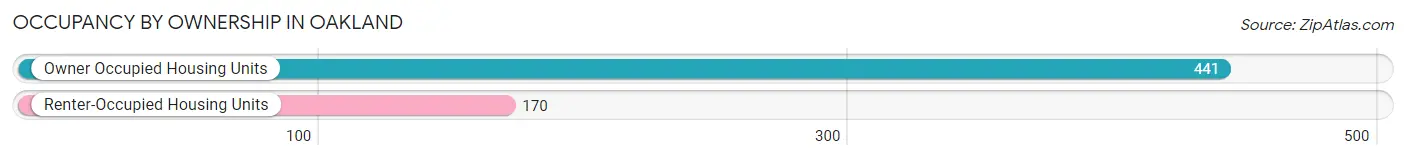
| Occupancy | # Housing Units | % Housing Units |
| Owner Occupied Housing Units | 441 | 72.2% |
| Renter-Occupied Housing Units | 170 | 27.8% |
| Total Occupied Housing Units | 611 | 100.0% |
Occupancy by Household Size in Oakland
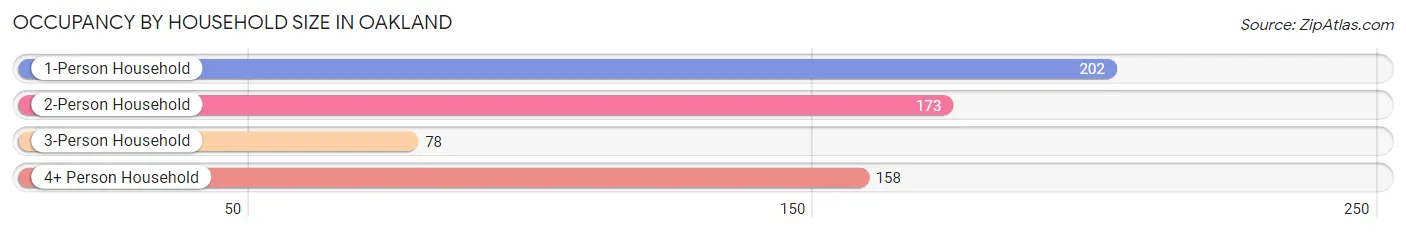
| Household Size | # Housing Units | % Housing Units |
| 1-Person Household | 202 | 33.1% |
| 2-Person Household | 173 | 28.3% |
| 3-Person Household | 78 | 12.8% |
| 4+ Person Household | 158 | 25.9% |
| Total Housing Units | 611 | 100.0% |
Occupancy by Ownership by Household Size in Oakland
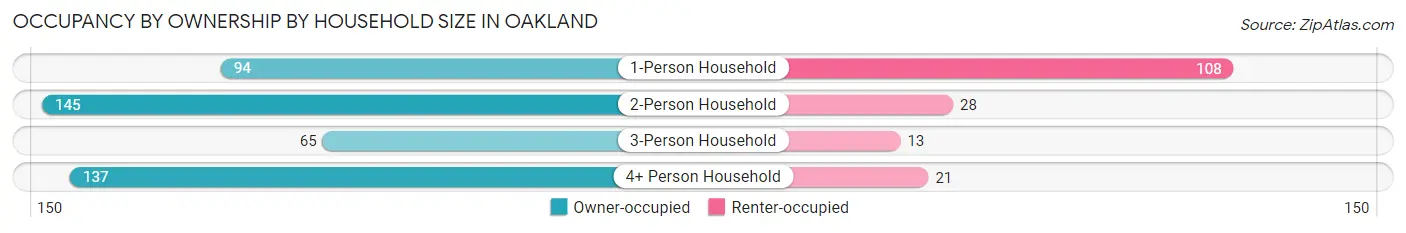
| Household Size | Owner-occupied | Renter-occupied |
| 1-Person Household | 94 (46.5%) | 108 (53.5%) |
| 2-Person Household | 145 (83.8%) | 28 (16.2%) |
| 3-Person Household | 65 (83.3%) | 13 (16.7%) |
| 4+ Person Household | 137 (86.7%) | 21 (13.3%) |
| Total Housing Units | 441 (72.2%) | 170 (27.8%) |
Occupancy by Educational Attainment in Oakland
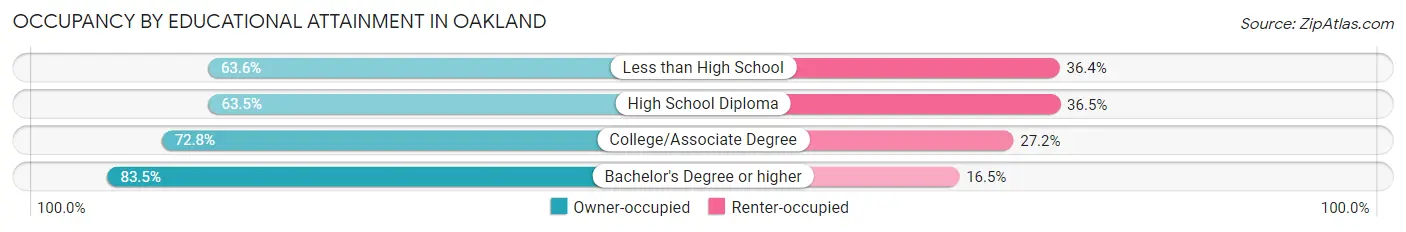
| Household Size | Owner-occupied | Renter-occupied |
| Less than High School | 42 (63.6%) | 24 (36.4%) |
| High School Diploma | 101 (63.5%) | 58 (36.5%) |
| College/Associate Degree | 166 (72.8%) | 62 (27.2%) |
| Bachelor's Degree or higher | 132 (83.5%) | 26 (16.5%) |
Occupancy by Age of Householder in Oakland
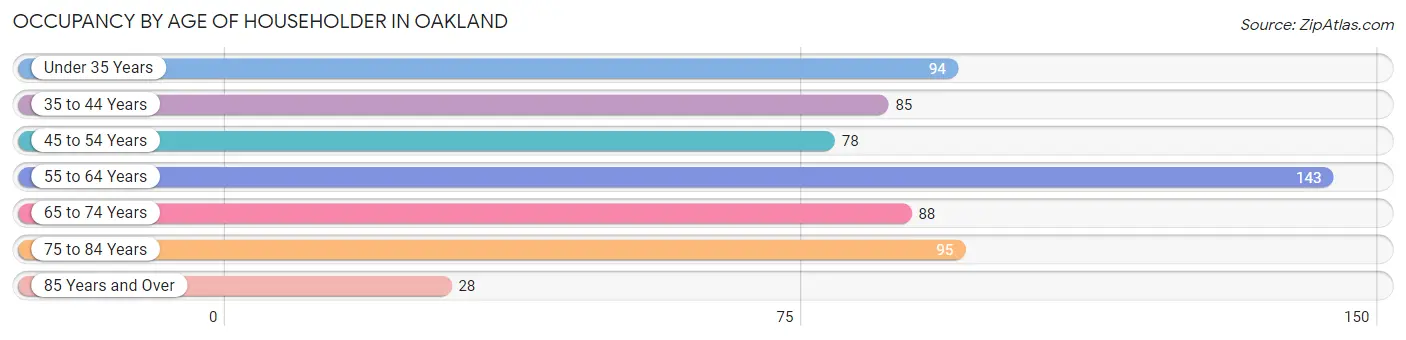
| Age Bracket | # Households | % Households |
| Under 35 Years | 94 | 15.4% |
| 35 to 44 Years | 85 | 13.9% |
| 45 to 54 Years | 78 | 12.8% |
| 55 to 64 Years | 143 | 23.4% |
| 65 to 74 Years | 88 | 14.4% |
| 75 to 84 Years | 95 | 15.5% |
| 85 Years and Over | 28 | 4.6% |
| Total | 611 | 100.0% |
Housing Finances in Oakland
Median Income by Occupancy in Oakland
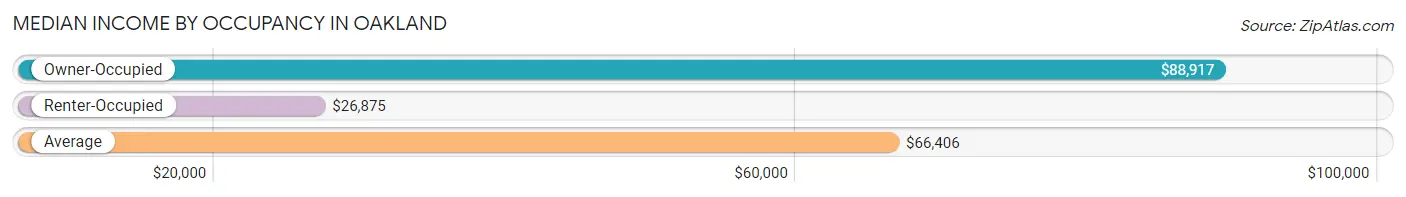
| Occupancy Type | # Households | Median Income |
| Owner-Occupied | 441 (72.2%) | $88,917 |
| Renter-Occupied | 170 (27.8%) | $26,875 |
| Average | 611 (100.0%) | $66,406 |
Occupancy by Householder Income Bracket in Oakland
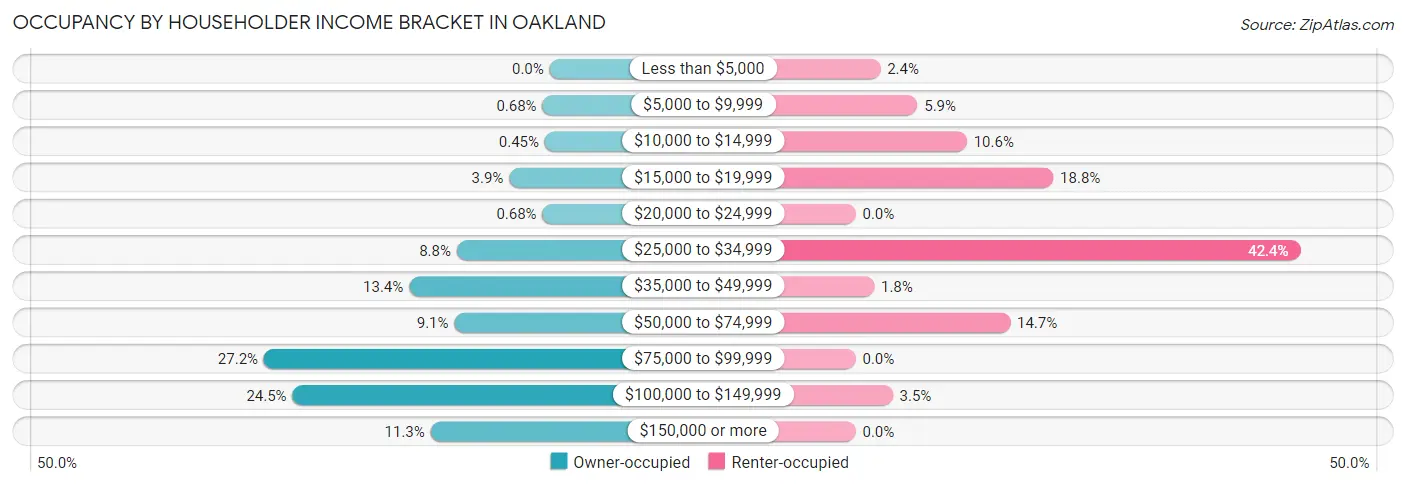
| Income Bracket | Owner-occupied | Renter-occupied |
| Less than $5,000 | 0 (0.0%) | 4 (2.4%) |
| $5,000 to $9,999 | 3 (0.7%) | 10 (5.9%) |
| $10,000 to $14,999 | 2 (0.4%) | 18 (10.6%) |
| $15,000 to $19,999 | 17 (3.8%) | 32 (18.8%) |
| $20,000 to $24,999 | 3 (0.7%) | 0 (0.0%) |
| $25,000 to $34,999 | 39 (8.8%) | 72 (42.3%) |
| $35,000 to $49,999 | 59 (13.4%) | 3 (1.8%) |
| $50,000 to $74,999 | 40 (9.1%) | 25 (14.7%) |
| $75,000 to $99,999 | 120 (27.2%) | 0 (0.0%) |
| $100,000 to $149,999 | 108 (24.5%) | 6 (3.5%) |
| $150,000 or more | 50 (11.3%) | 0 (0.0%) |
| Total | 441 (100.0%) | 170 (100.0%) |
Monthly Housing Cost Tiers in Oakland
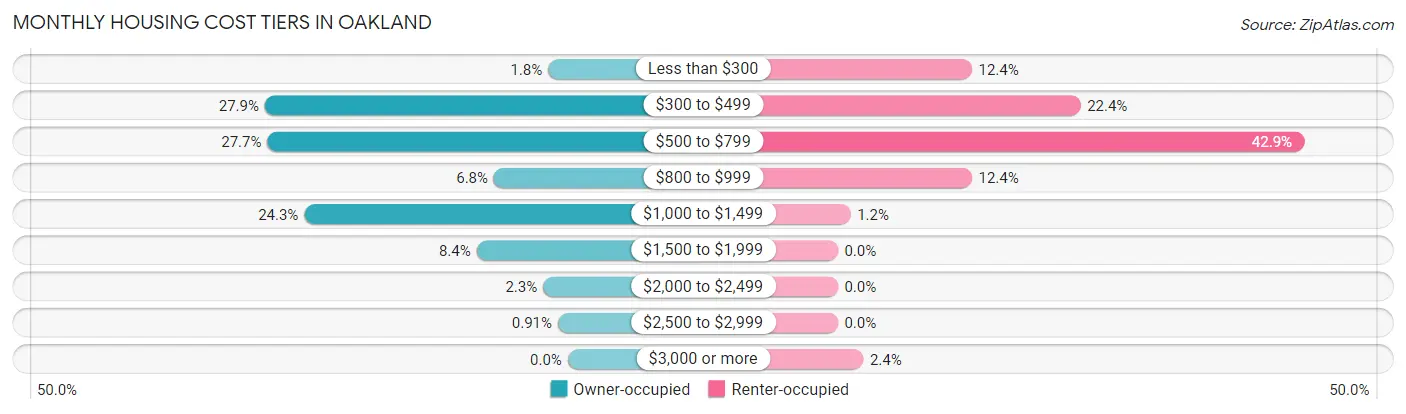
| Monthly Cost | Owner-occupied | Renter-occupied |
| Less than $300 | 8 (1.8%) | 21 (12.3%) |
| $300 to $499 | 123 (27.9%) | 38 (22.4%) |
| $500 to $799 | 122 (27.7%) | 73 (42.9%) |
| $800 to $999 | 30 (6.8%) | 21 (12.3%) |
| $1,000 to $1,499 | 107 (24.3%) | 2 (1.2%) |
| $1,500 to $1,999 | 37 (8.4%) | 0 (0.0%) |
| $2,000 to $2,499 | 10 (2.3%) | 0 (0.0%) |
| $2,500 to $2,999 | 4 (0.9%) | 0 (0.0%) |
| $3,000 or more | 0 (0.0%) | 4 (2.4%) |
| Total | 441 (100.0%) | 170 (100.0%) |
Physical Housing Characteristics in Oakland
Housing Structures in Oakland
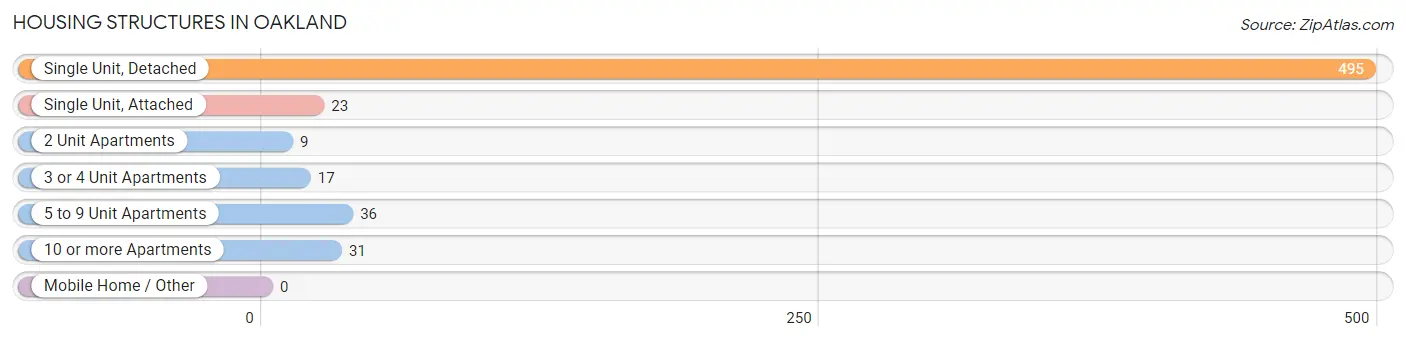
| Structure Type | # Housing Units | % Housing Units |
| Single Unit, Detached | 495 | 81.0% |
| Single Unit, Attached | 23 | 3.8% |
| 2 Unit Apartments | 9 | 1.5% |
| 3 or 4 Unit Apartments | 17 | 2.8% |
| 5 to 9 Unit Apartments | 36 | 5.9% |
| 10 or more Apartments | 31 | 5.1% |
| Mobile Home / Other | 0 | 0.0% |
| Total | 611 | 100.0% |
Housing Structures by Occupancy in Oakland
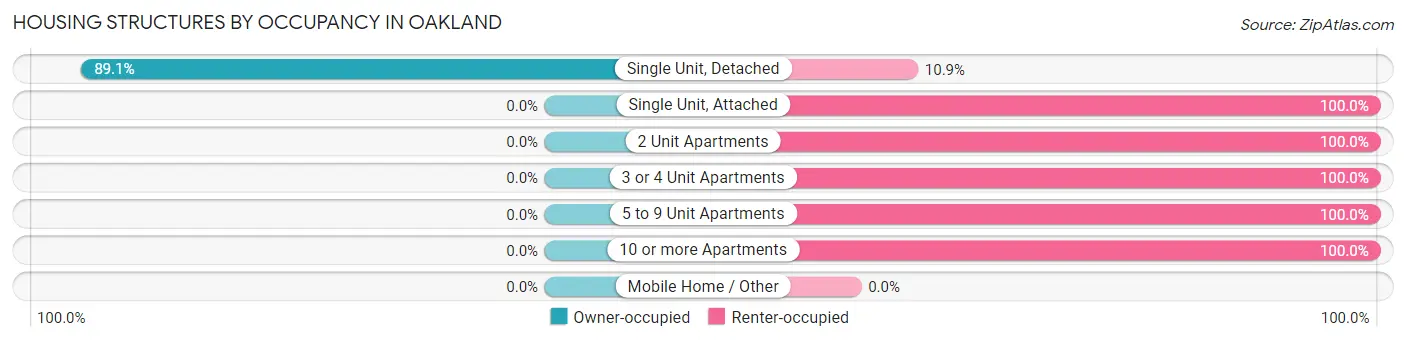
| Structure Type | Owner-occupied | Renter-occupied |
| Single Unit, Detached | 441 (89.1%) | 54 (10.9%) |
| Single Unit, Attached | 0 (0.0%) | 23 (100.0%) |
| 2 Unit Apartments | 0 (0.0%) | 9 (100.0%) |
| 3 or 4 Unit Apartments | 0 (0.0%) | 17 (100.0%) |
| 5 to 9 Unit Apartments | 0 (0.0%) | 36 (100.0%) |
| 10 or more Apartments | 0 (0.0%) | 31 (100.0%) |
| Mobile Home / Other | 0 (0.0%) | 0 (0.0%) |
| Total | 441 (72.2%) | 170 (27.8%) |
Housing Structures by Number of Rooms in Oakland
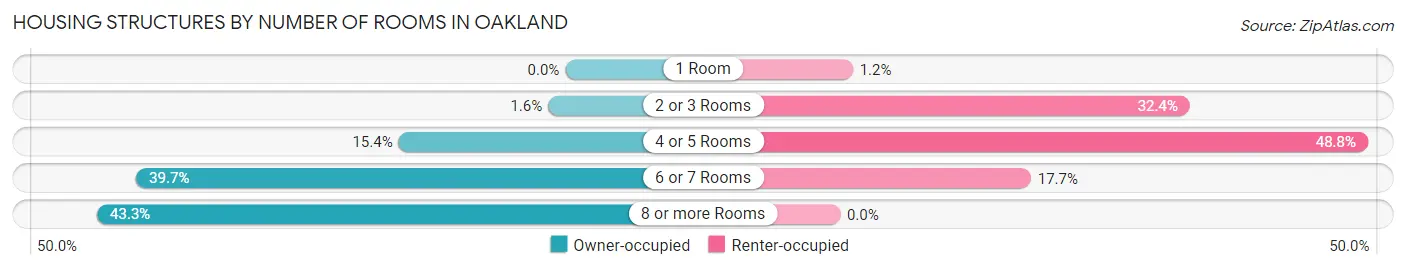
| Number of Rooms | Owner-occupied | Renter-occupied |
| 1 Room | 0 (0.0%) | 2 (1.2%) |
| 2 or 3 Rooms | 7 (1.6%) | 55 (32.4%) |
| 4 or 5 Rooms | 68 (15.4%) | 83 (48.8%) |
| 6 or 7 Rooms | 175 (39.7%) | 30 (17.6%) |
| 8 or more Rooms | 191 (43.3%) | 0 (0.0%) |
| Total | 441 (100.0%) | 170 (100.0%) |
Housing Structure by Heating Type in Oakland
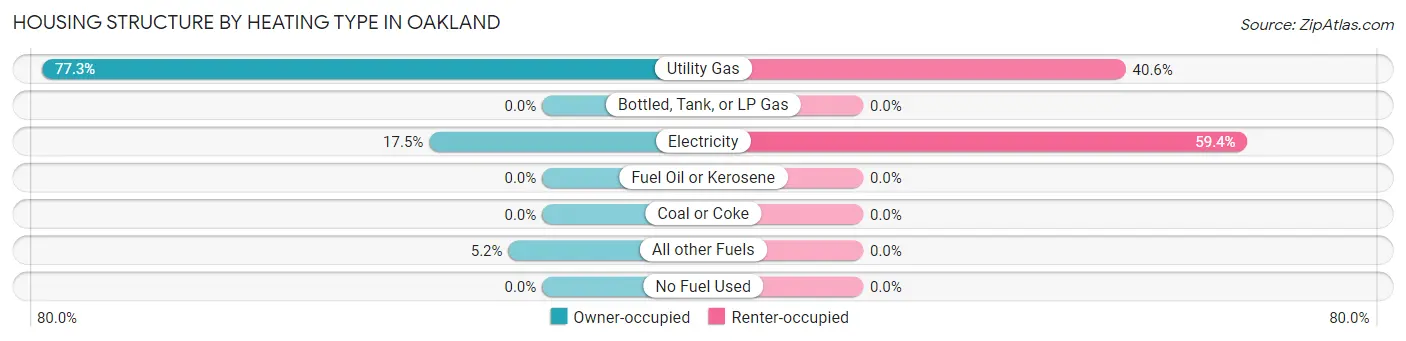
| Heating Type | Owner-occupied | Renter-occupied |
| Utility Gas | 341 (77.3%) | 69 (40.6%) |
| Bottled, Tank, or LP Gas | 0 (0.0%) | 0 (0.0%) |
| Electricity | 77 (17.5%) | 101 (59.4%) |
| Fuel Oil or Kerosene | 0 (0.0%) | 0 (0.0%) |
| Coal or Coke | 0 (0.0%) | 0 (0.0%) |
| All other Fuels | 23 (5.2%) | 0 (0.0%) |
| No Fuel Used | 0 (0.0%) | 0 (0.0%) |
| Total | 441 (100.0%) | 170 (100.0%) |
Household Vehicle Usage in Oakland
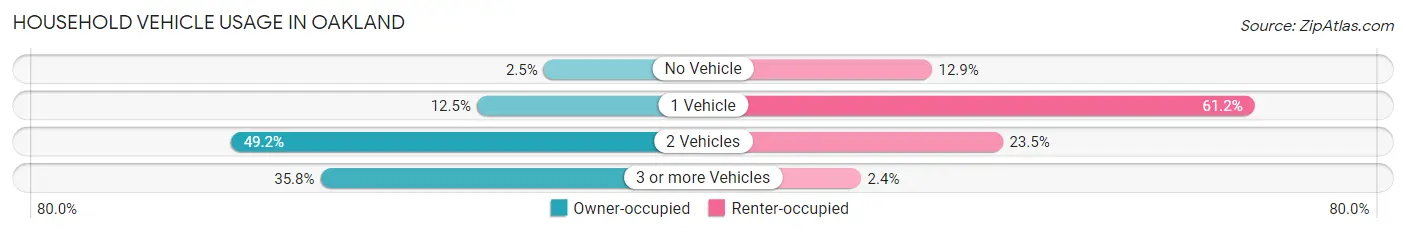
| Vehicles per Household | Owner-occupied | Renter-occupied |
| No Vehicle | 11 (2.5%) | 22 (12.9%) |
| 1 Vehicle | 55 (12.5%) | 104 (61.2%) |
| 2 Vehicles | 217 (49.2%) | 40 (23.5%) |
| 3 or more Vehicles | 158 (35.8%) | 4 (2.4%) |
| Total | 441 (100.0%) | 170 (100.0%) |
Real Estate & Mortgages in Oakland
Real Estate and Mortgage Overview in Oakland
| Characteristic | Without Mortgage | With Mortgage |
| Housing Units | 225 | 216 |
| Median Property Value | $97,000 | $164,300 |
| Median Household Income | $67,917 | $22 |
| Monthly Housing Costs | $474 | $0 |
| Real Estate Taxes | $1,780 | $1 |
Property Value by Mortgage Status in Oakland
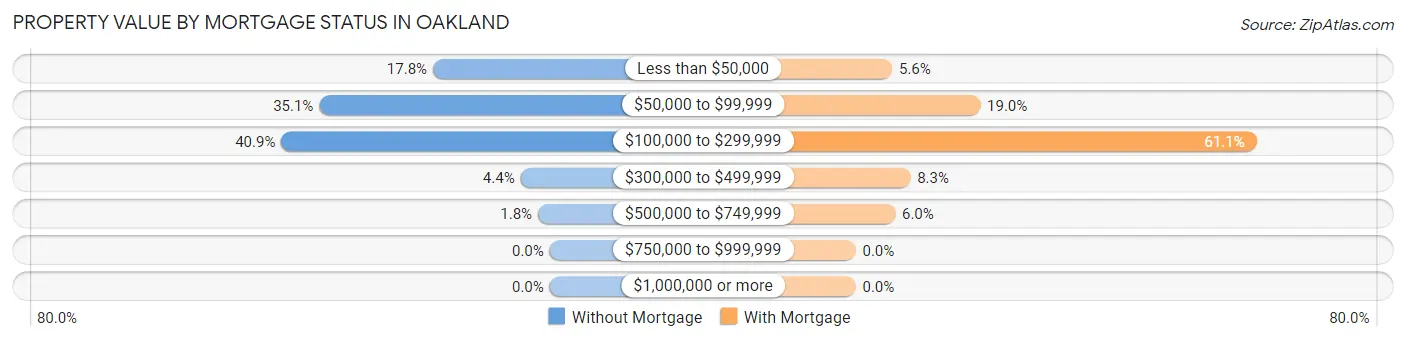
| Property Value | Without Mortgage | With Mortgage |
| Less than $50,000 | 40 (17.8%) | 12 (5.6%) |
| $50,000 to $99,999 | 79 (35.1%) | 41 (19.0%) |
| $100,000 to $299,999 | 92 (40.9%) | 132 (61.1%) |
| $300,000 to $499,999 | 10 (4.4%) | 18 (8.3%) |
| $500,000 to $749,999 | 4 (1.8%) | 13 (6.0%) |
| $750,000 to $999,999 | 0 (0.0%) | 0 (0.0%) |
| $1,000,000 or more | 0 (0.0%) | 0 (0.0%) |
| Total | 225 (100.0%) | 216 (100.0%) |
Household Income by Mortgage Status in Oakland
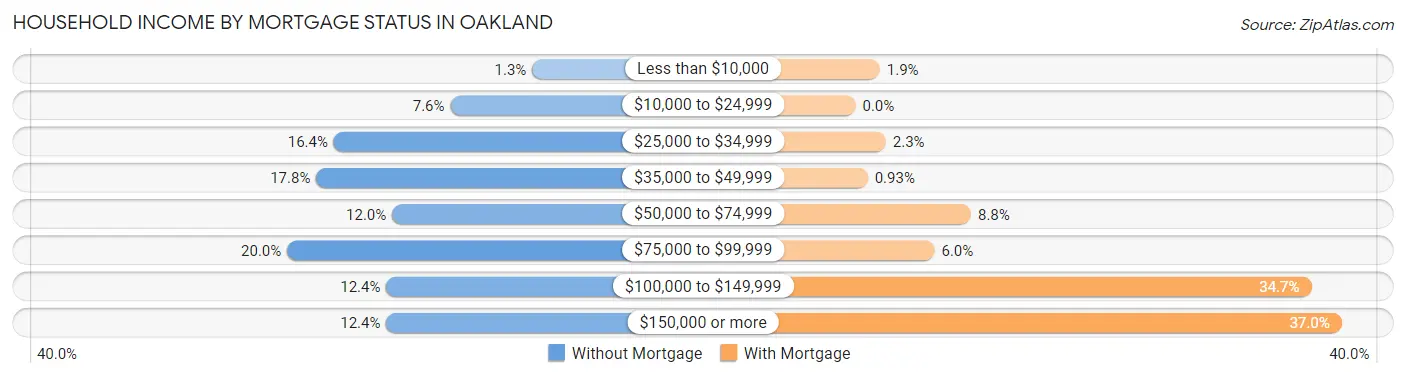
| Household Income | Without Mortgage | With Mortgage |
| Less than $10,000 | 3 (1.3%) | 4 (1.8%) |
| $10,000 to $24,999 | 17 (7.6%) | 0 (0.0%) |
| $25,000 to $34,999 | 37 (16.4%) | 5 (2.3%) |
| $35,000 to $49,999 | 40 (17.8%) | 2 (0.9%) |
| $50,000 to $74,999 | 27 (12.0%) | 19 (8.8%) |
| $75,000 to $99,999 | 45 (20.0%) | 13 (6.0%) |
| $100,000 to $149,999 | 28 (12.4%) | 75 (34.7%) |
| $150,000 or more | 28 (12.4%) | 80 (37.0%) |
| Total | 225 (100.0%) | 216 (100.0%) |
Property Value to Household Income Ratio in Oakland
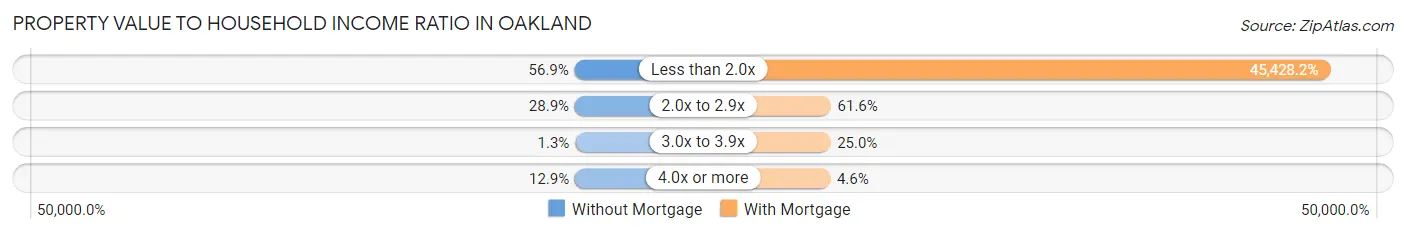
| Value-to-Income Ratio | Without Mortgage | With Mortgage |
| Less than 2.0x | 128 (56.9%) | 98,125 (45,428.2%) |
| 2.0x to 2.9x | 65 (28.9%) | 133 (61.6%) |
| 3.0x to 3.9x | 3 (1.3%) | 54 (25.0%) |
| 4.0x or more | 29 (12.9%) | 10 (4.6%) |
| Total | 225 (100.0%) | 216 (100.0%) |
Real Estate Taxes by Mortgage Status in Oakland
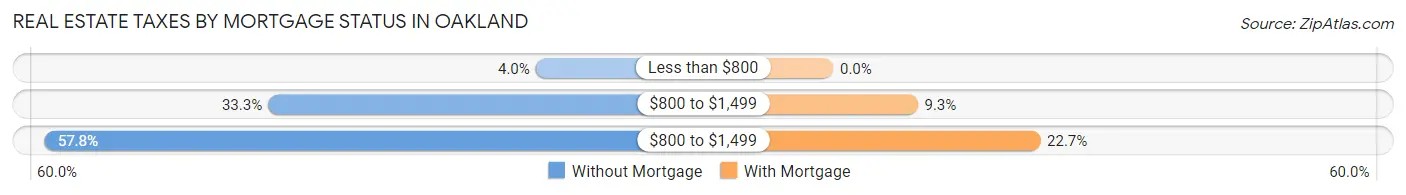
| Property Taxes | Without Mortgage | With Mortgage |
| Less than $800 | 9 (4.0%) | 0 (0.0%) |
| $800 to $1,499 | 75 (33.3%) | 20 (9.3%) |
| $800 to $1,499 | 130 (57.8%) | 49 (22.7%) |
| Total | 225 (100.0%) | 216 (100.0%) |
Health & Disability in Oakland
Health Insurance Coverage by Age in Oakland
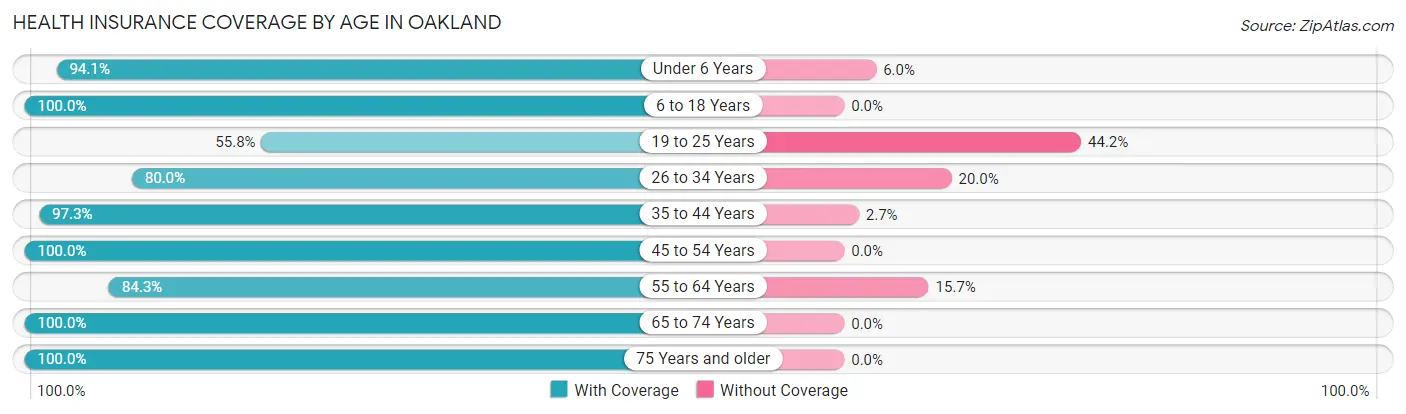
| Age Bracket | With Coverage | Without Coverage |
| Under 6 Years | 79 (94.1%) | 5 (5.9%) |
| 6 to 18 Years | 303 (100.0%) | 0 (0.0%) |
| 19 to 25 Years | 129 (55.8%) | 102 (44.2%) |
| 26 to 34 Years | 64 (80.0%) | 16 (20.0%) |
| 35 to 44 Years | 143 (97.3%) | 4 (2.7%) |
| 45 to 54 Years | 148 (100.0%) | 0 (0.0%) |
| 55 to 64 Years | 150 (84.3%) | 28 (15.7%) |
| 65 to 74 Years | 174 (100.0%) | 0 (0.0%) |
| 75 Years and older | 203 (100.0%) | 0 (0.0%) |
| Total | 1,393 (90.0%) | 155 (10.0%) |
Health Insurance Coverage by Citizenship Status in Oakland
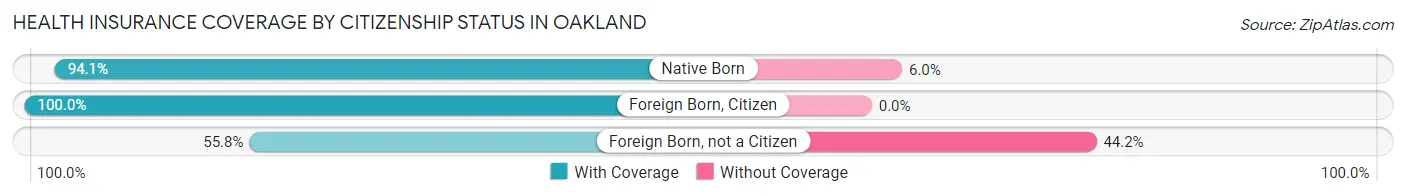
| Citizenship Status | With Coverage | Without Coverage |
| Native Born | 79 (94.1%) | 5 (5.9%) |
| Foreign Born, Citizen | 303 (100.0%) | 0 (0.0%) |
| Foreign Born, not a Citizen | 129 (55.8%) | 102 (44.2%) |
Health Insurance Coverage by Household Income in Oakland
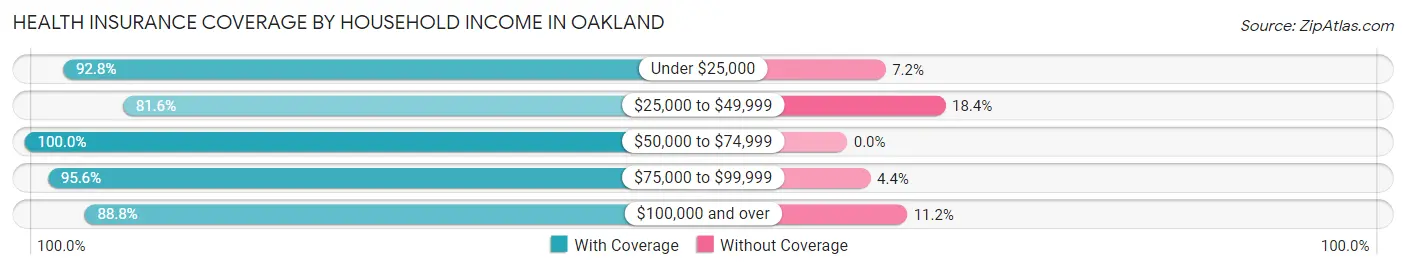
| Household Income | With Coverage | Without Coverage |
| Under $25,000 | 116 (92.8%) | 9 (7.2%) |
| $25,000 to $49,999 | 266 (81.6%) | 60 (18.4%) |
| $50,000 to $74,999 | 112 (100.0%) | 0 (0.0%) |
| $75,000 to $99,999 | 329 (95.6%) | 15 (4.4%) |
| $100,000 and over | 562 (88.8%) | 71 (11.2%) |
Public vs Private Health Insurance Coverage by Age in Oakland
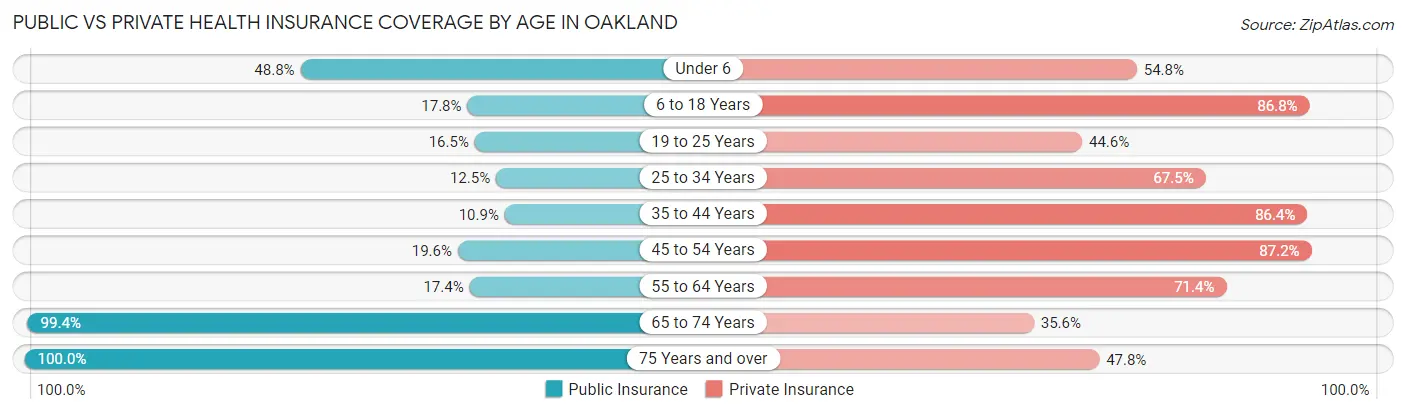
| Age Bracket | Public Insurance | Private Insurance |
| Under 6 | 41 (48.8%) | 46 (54.8%) |
| 6 to 18 Years | 54 (17.8%) | 263 (86.8%) |
| 19 to 25 Years | 38 (16.5%) | 103 (44.6%) |
| 25 to 34 Years | 10 (12.5%) | 54 (67.5%) |
| 35 to 44 Years | 16 (10.9%) | 127 (86.4%) |
| 45 to 54 Years | 29 (19.6%) | 129 (87.2%) |
| 55 to 64 Years | 31 (17.4%) | 127 (71.4%) |
| 65 to 74 Years | 173 (99.4%) | 62 (35.6%) |
| 75 Years and over | 203 (100.0%) | 97 (47.8%) |
| Total | 595 (38.4%) | 1,008 (65.1%) |
Disability Status by Sex by Age in Oakland
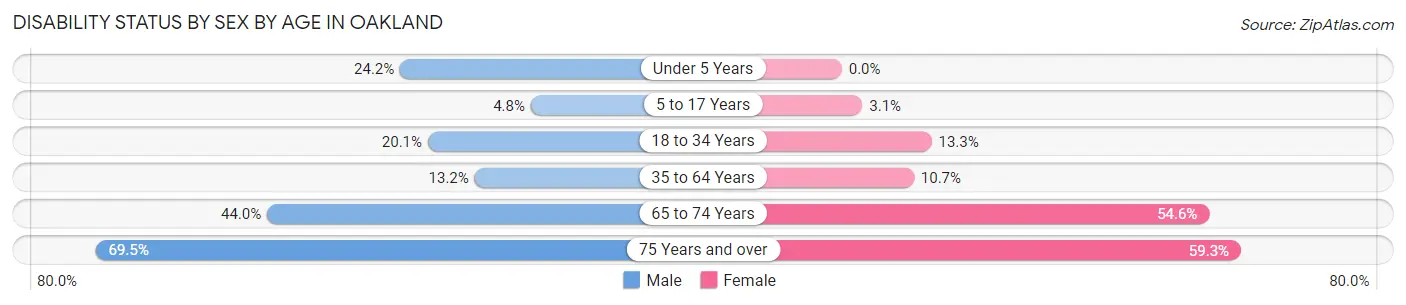
| Age Bracket | Male | Female |
| Under 5 Years | 8 (24.2%) | 0 (0.0%) |
| 5 to 17 Years | 6 (4.8%) | 5 (3.0%) |
| 18 to 34 Years | 33 (20.1%) | 22 (13.3%) |
| 35 to 64 Years | 34 (13.2%) | 23 (10.7%) |
| 65 to 74 Years | 33 (44.0%) | 54 (54.5%) |
| 75 Years and over | 66 (69.5%) | 64 (59.3%) |
Disability Class by Sex by Age in Oakland
Disability Class: Hearing Difficulty
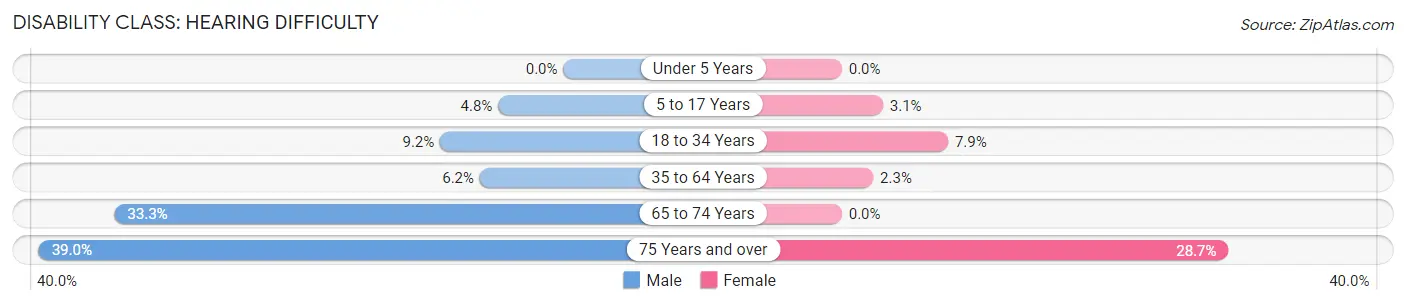
| Age Bracket | Male | Female |
| Under 5 Years | 0 (0.0%) | 0 (0.0%) |
| 5 to 17 Years | 6 (4.8%) | 5 (3.0%) |
| 18 to 34 Years | 15 (9.1%) | 13 (7.9%) |
| 35 to 64 Years | 16 (6.2%) | 5 (2.3%) |
| 65 to 74 Years | 25 (33.3%) | 0 (0.0%) |
| 75 Years and over | 37 (39.0%) | 31 (28.7%) |
Disability Class: Vision Difficulty
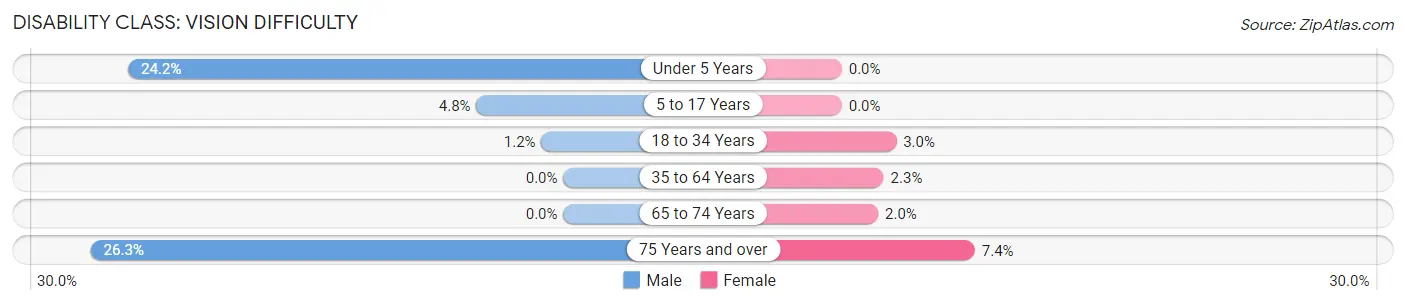
| Age Bracket | Male | Female |
| Under 5 Years | 8 (24.2%) | 0 (0.0%) |
| 5 to 17 Years | 6 (4.8%) | 0 (0.0%) |
| 18 to 34 Years | 2 (1.2%) | 5 (3.0%) |
| 35 to 64 Years | 0 (0.0%) | 5 (2.3%) |
| 65 to 74 Years | 0 (0.0%) | 2 (2.0%) |
| 75 Years and over | 25 (26.3%) | 8 (7.4%) |
Disability Class: Cognitive Difficulty
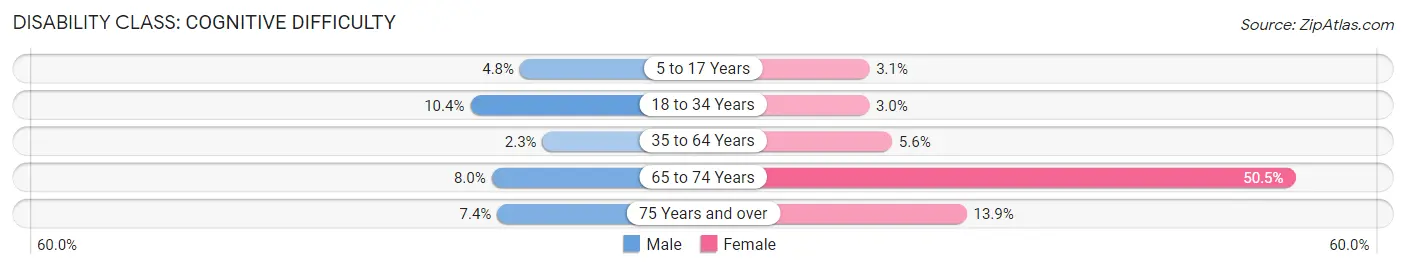
| Age Bracket | Male | Female |
| 5 to 17 Years | 6 (4.8%) | 5 (3.0%) |
| 18 to 34 Years | 17 (10.4%) | 5 (3.0%) |
| 35 to 64 Years | 6 (2.3%) | 12 (5.6%) |
| 65 to 74 Years | 6 (8.0%) | 50 (50.5%) |
| 75 Years and over | 7 (7.4%) | 15 (13.9%) |
Disability Class: Ambulatory Difficulty
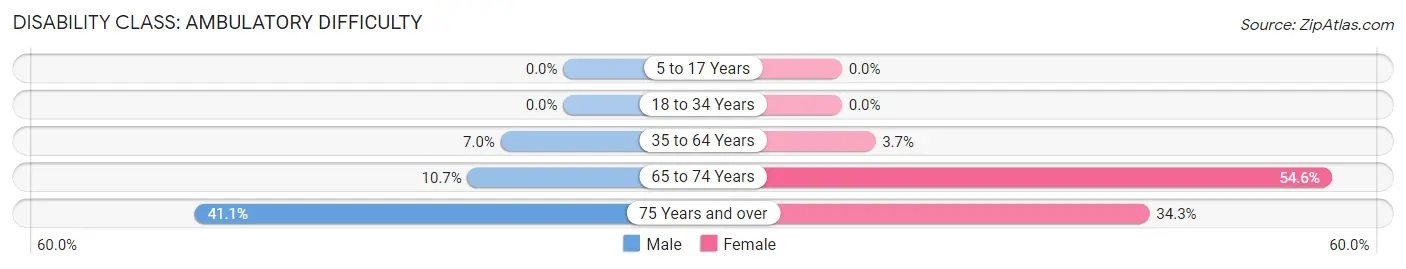
| Age Bracket | Male | Female |
| 5 to 17 Years | 0 (0.0%) | 0 (0.0%) |
| 18 to 34 Years | 0 (0.0%) | 0 (0.0%) |
| 35 to 64 Years | 18 (7.0%) | 8 (3.7%) |
| 65 to 74 Years | 8 (10.7%) | 54 (54.5%) |
| 75 Years and over | 39 (41.0%) | 37 (34.3%) |
Disability Class: Self-Care Difficulty
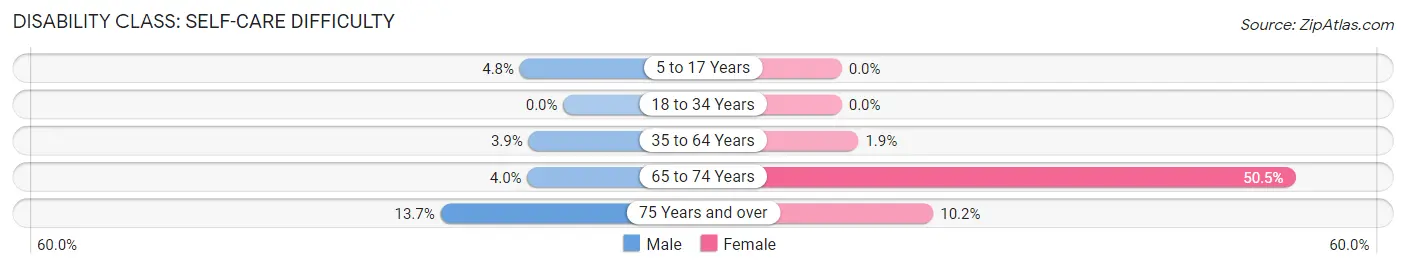
| Age Bracket | Male | Female |
| 5 to 17 Years | 6 (4.8%) | 0 (0.0%) |
| 18 to 34 Years | 0 (0.0%) | 0 (0.0%) |
| 35 to 64 Years | 10 (3.9%) | 4 (1.9%) |
| 65 to 74 Years | 3 (4.0%) | 50 (50.5%) |
| 75 Years and over | 13 (13.7%) | 11 (10.2%) |
Technology Access in Oakland
Computing Device Access in Oakland
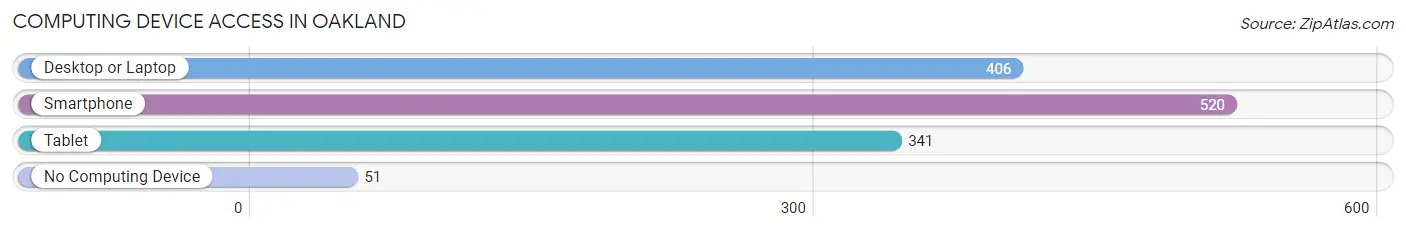
| Device Type | # Households | % Households |
| Desktop or Laptop | 406 | 66.4% |
| Smartphone | 520 | 85.1% |
| Tablet | 341 | 55.8% |
| No Computing Device | 51 | 8.4% |
| Total | 611 | 100.0% |
Internet Access in Oakland
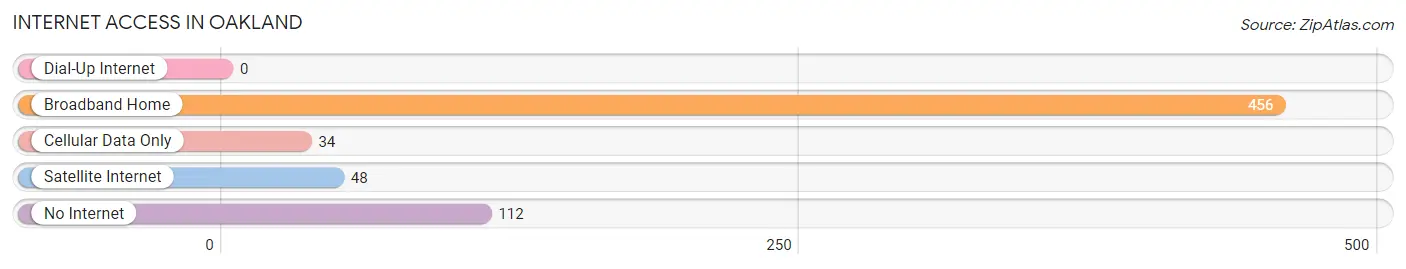
| Internet Type | # Households | % Households |
| Dial-Up Internet | 0 | 0.0% |
| Broadband Home | 456 | 74.6% |
| Cellular Data Only | 34 | 5.6% |
| Satellite Internet | 48 | 7.9% |
| No Internet | 112 | 18.3% |
| Total | 611 | 100.0% |
Oakland Summary
Oakland, Nebraska is a small city located in Burt County, in the northeastern corner of the state. It is situated on the banks of the Missouri River, and is the county seat of Burt County. The city has a population of 1,845, according to the 2010 census.
History
Oakland was founded in 1854 by a group of settlers from Ohio. The city was named after the oak trees that grew in the area. The city was incorporated in 1856, and the first post office was established in 1857.
Oakland was an important stop on the Pony Express route, and the city was also a major stop on the Union Pacific Railroad. The railroad brought many new settlers to the area, and Oakland quickly grew into a thriving community.
In the late 19th century, Oakland was a major center for the lumber industry. The city was home to several sawmills, and the lumber industry provided many jobs for the residents of Oakland.
Geography
Oakland is located in the northeastern corner of Nebraska, on the banks of the Missouri River. The city is situated at an elevation of 1,072 feet above sea level.
The city has a total area of 1.2 square miles, all of which is land. The climate in Oakland is characterized by hot, humid summers and cold, dry winters.
Economy
Oakland’s economy is largely based on agriculture. The city is home to several farms, and the surrounding area is known for its production of corn, soybeans, and wheat.
The city is also home to several manufacturing companies, including a furniture factory, a plastics factory, and a metal fabrication plant.
Demographics
According to the 2010 census, Oakland has a population of 1,845. The racial makeup of the city is 94.3% White, 0.7% African American, 0.3% Native American, 0.2% Asian, 0.1% Pacific Islander, and 4.4% from other races.
The median household income in Oakland is $41,944, and the median family income is $50,938. The per capita income in Oakland is $20,845.
Conclusion
Oakland, Nebraska is a small city located in Burt County, in the northeastern corner of the state. It was founded in 1854, and has a population of 1,845, according to the 2010 census. The city’s economy is largely based on agriculture, and it is also home to several manufacturing companies. Oakland has a median household income of $41,944, and a median family income of $50,938.
Common Questions
What is the Total Population of Oakland?
Total Population of Oakland is 1,578.
What is the Total Male Population of Oakland?
Total Male Population of Oakland is 761.
What is the Total Female Population of Oakland?
Total Female Population of Oakland is 817.
What is the Ratio of Males per 100 Females in Oakland?
There are 93.15 Males per 100 Females in Oakland.
What is the Ratio of Females per 100 Males in Oakland?
There are 107.36 Females per 100 Males in Oakland.
What is the Median Population Age in Oakland?
Median Population Age in Oakland is 40.8 Years.
What is the Average Family Size in Oakland
Average Family Size in Oakland is 3.0 People.
What is the Average Household Size in Oakland
Average Household Size in Oakland is 2.5 People.
What is Per Capita Income in Oakland?
Per Capita income in Oakland is $31,885.
What is the Median Family Income in Oakland?
Median Family Income in Oakland is $82,000.
What is the Median Household income in Oakland?
Median Household Income in Oakland is $66,406.
What is Income or Wage Gap in Oakland?
Income or Wage Gap in Oakland is 9.1%.
Women in Oakland earn 90.9 cents for every dollar earned by a man.
What is Inequality or Gini Index in Oakland?
Inequality or Gini Index in Oakland is 0.42.
How Large is the Labor Force in Oakland?
There are 707 People in the Labor Forcein in Oakland.
What is the Percentage of People in the Labor Force in Oakland?
56.2% of People are in the Labor Force in Oakland.