Churchill, MT
Churchill Map
Churchill Overview
1,081
TOTAL POPULATION
553
MALE POPULATION
528
FEMALE POPULATION
104.73
MALES / 100 FEMALES
95.48
FEMALES / 100 MALES
40.1
MEDIAN AGE
3.3
AVG FAMILY SIZE
2.9
AVG HOUSEHOLD SIZE
$36,968
PER CAPITA INCOME
$114,000
AVG FAMILY INCOME
$90,250
AVG HOUSEHOLD INCOME
43.8%
WAGE / INCOME GAP [ % ]
56.2¢/ $1
WAGE / INCOME GAP [ $ ]
0.39
INEQUALITY / GINI INDEX
541
LABOR FORCE [ PEOPLE ]
69.1%
PERCENT IN LABOR FORCE
0.6%
UNEMPLOYMENT RATE
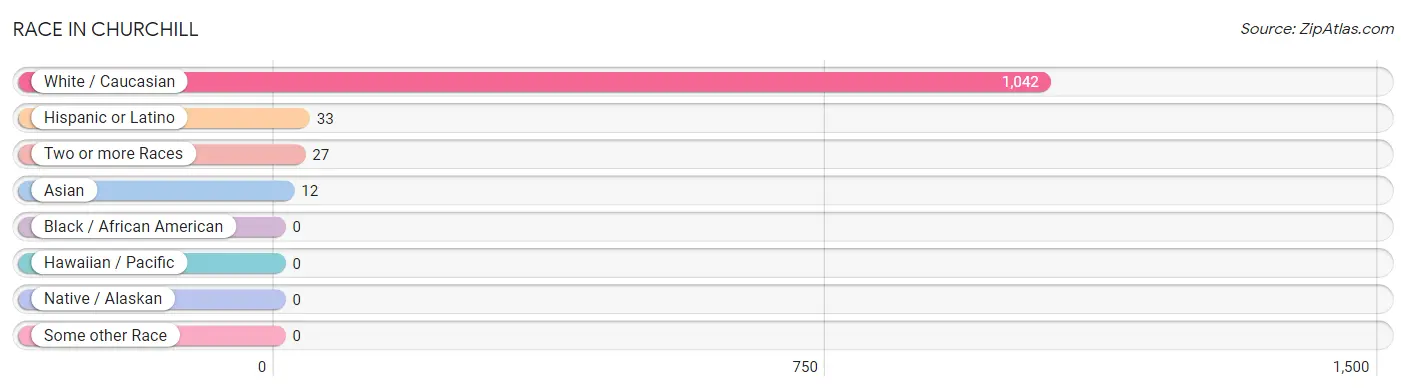
Race in Churchill
The most populous races in Churchill are White / Caucasian (1,042 | 96.4%), Hispanic or Latino (33 | 3.0%), and Two or more Races (27 | 2.5%).
| Race | # Population | % Population |
| Asian | 12 | 1.1% |
| Black / African American | 0 | 0.0% |
| Hawaiian / Pacific | 0 | 0.0% |
| Hispanic or Latino | 33 | 3.0% |
| Native / Alaskan | 0 | 0.0% |
| White / Caucasian | 1,042 | 96.4% |
| Two or more Races | 27 | 2.5% |
| Some other Race | 0 | 0.0% |
| Total | 1,081 | 100.0% |
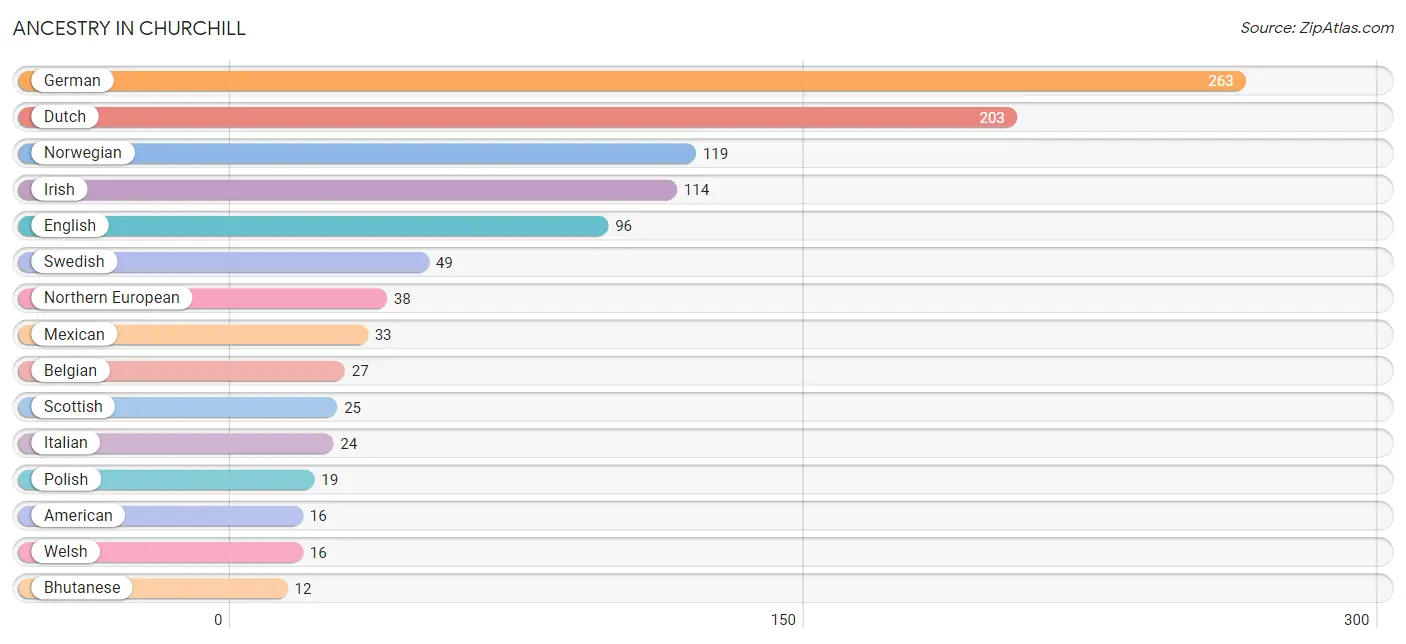
Ancestry in Churchill
The most populous ancestries reported in Churchill are German (263 | 24.3%), Dutch (203 | 18.8%), Norwegian (119 | 11.0%), Irish (114 | 10.5%), and English (96 | 8.9%), together accounting for 73.6% of all Churchill residents.
| Ancestry | # Population | % Population |
| American | 16 | 1.5% |
| Austrian | 5 | 0.5% |
| Belgian | 27 | 2.5% |
| Bhutanese | 12 | 1.1% |
| Canadian | 3 | 0.3% |
| Danish | 2 | 0.2% |
| Dutch | 203 | 18.8% |
| English | 96 | 8.9% |
| European | 6 | 0.6% |
| French | 6 | 0.6% |
| French Canadian | 11 | 1.0% |
| German | 263 | 24.3% |
| German Russian | 3 | 0.3% |
| Hungarian | 5 | 0.5% |
| Irish | 114 | 10.5% |
| Italian | 24 | 2.2% |
| Mexican | 33 | 3.0% |
| Northern European | 38 | 3.5% |
| Norwegian | 119 | 11.0% |
| Polish | 19 | 1.8% |
| Scandinavian | 7 | 0.6% |
| Scotch-Irish | 7 | 0.6% |
| Scottish | 25 | 2.3% |
| Slovene | 12 | 1.1% |
| Swedish | 49 | 4.5% |
| Swiss | 3 | 0.3% |
| Welsh | 16 | 1.5% |
| Yugoslavian | 3 | 0.3% | View All 28 Rows |
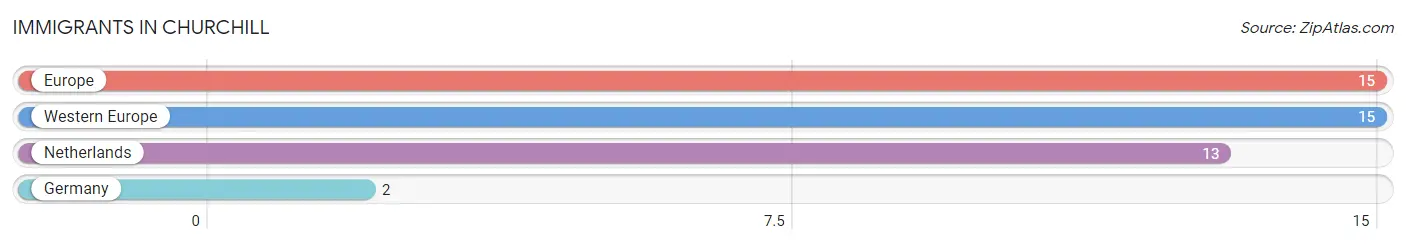
Immigrants in Churchill
The most numerous immigrant groups reported in Churchill came from Europe (15 | 1.4%), Western Europe (15 | 1.4%), Netherlands (13 | 1.2%), and Germany (2 | 0.2%), together accounting for 4.2% of all Churchill residents.
| Immigration Origin | # Population | % Population |
| Europe | 15 | 1.4% |
| Germany | 2 | 0.2% |
| Netherlands | 13 | 1.2% |
| Western Europe | 15 | 1.4% | View All 4 Rows |
Sex and Age in Churchill
Sex and Age in Churchill
The most populous age groups in Churchill are 5 to 9 Years (97 | 17.5%) for men and 55 to 59 Years (67 | 12.7%) for women.
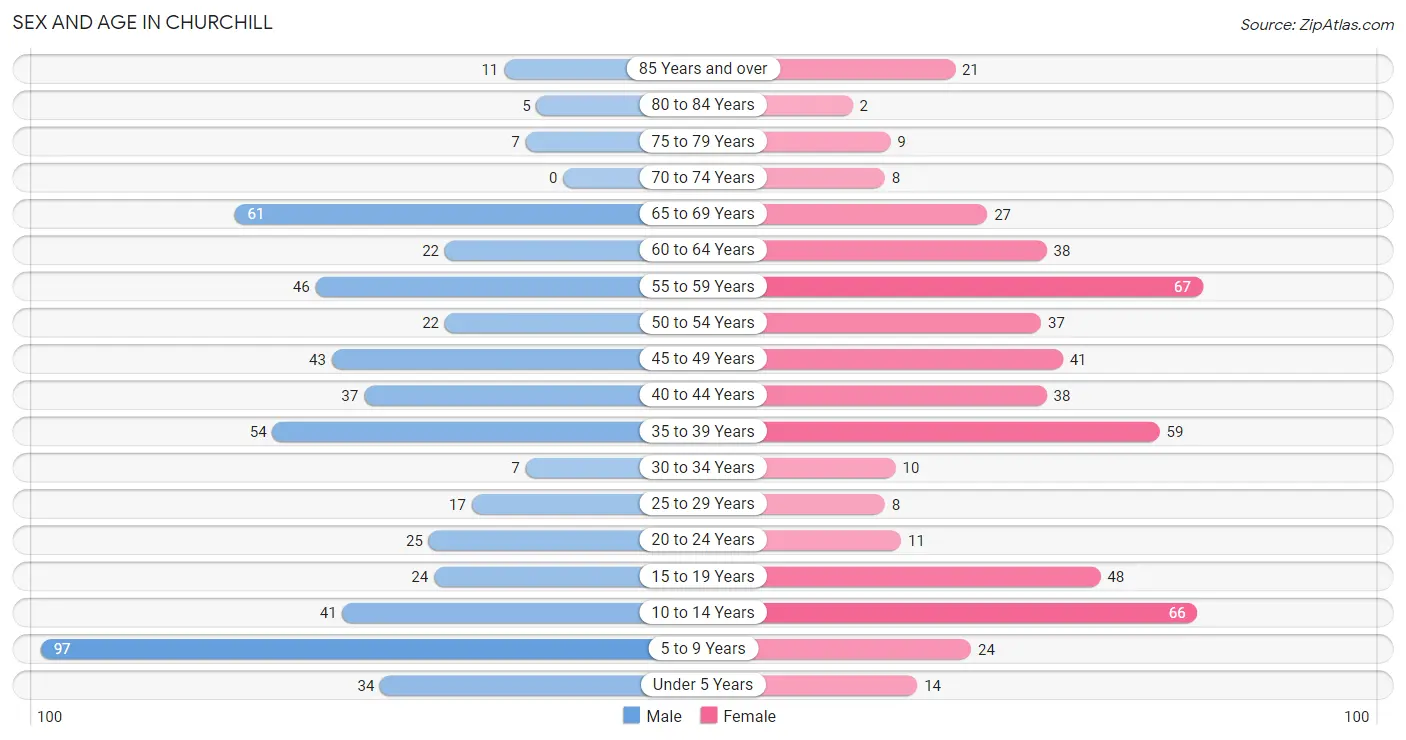
| Age Bracket | Male | Female |
| Under 5 Years | 34 (6.1%) | 14 (2.6%) |
| 5 to 9 Years | 97 (17.5%) | 24 (4.5%) |
| 10 to 14 Years | 41 (7.4%) | 66 (12.5%) |
| 15 to 19 Years | 24 (4.3%) | 48 (9.1%) |
| 20 to 24 Years | 25 (4.5%) | 11 (2.1%) |
| 25 to 29 Years | 17 (3.1%) | 8 (1.5%) |
| 30 to 34 Years | 7 (1.3%) | 10 (1.9%) |
| 35 to 39 Years | 54 (9.8%) | 59 (11.2%) |
| 40 to 44 Years | 37 (6.7%) | 38 (7.2%) |
| 45 to 49 Years | 43 (7.8%) | 41 (7.8%) |
| 50 to 54 Years | 22 (4.0%) | 37 (7.0%) |
| 55 to 59 Years | 46 (8.3%) | 67 (12.7%) |
| 60 to 64 Years | 22 (4.0%) | 38 (7.2%) |
| 65 to 69 Years | 61 (11.0%) | 27 (5.1%) |
| 70 to 74 Years | 0 (0.0%) | 8 (1.5%) |
| 75 to 79 Years | 7 (1.3%) | 9 (1.7%) |
| 80 to 84 Years | 5 (0.9%) | 2 (0.4%) |
| 85 Years and over | 11 (2.0%) | 21 (4.0%) |
| Total | 553 (100.0%) | 528 (100.0%) |
Families and Households in Churchill
Median Family Size in Churchill
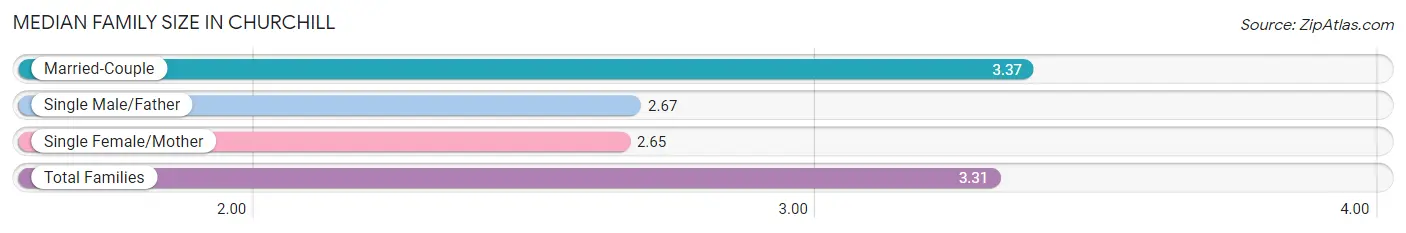
The median family size in Churchill is 3.31 persons per family, with married-couple families (273 | 92.2%) accounting for the largest median family size of 3.37 persons per family. On the other hand, single female/mother families (17 | 5.7%) represent the smallest median family size with 2.65 persons per family.
| Family Type | # Families | Family Size |
| Married-Couple | 273 (92.2%) | 3.37 |
| Single Male/Father | 6 (2.0%) | 2.67 |
| Single Female/Mother | 17 (5.7%) | 2.65 |
| Total Families | 296 (100.0%) | 3.31 |
Median Household Size in Churchill
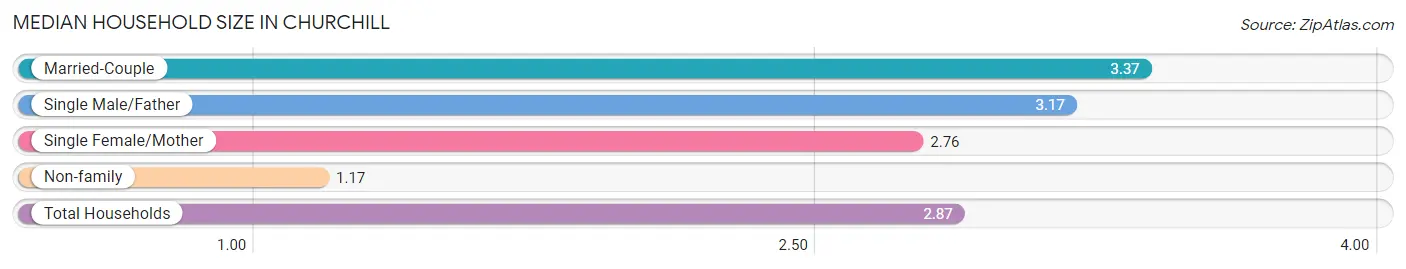
The median household size in Churchill is 2.87 persons per household, with married-couple households (273 | 72.4%) accounting for the largest median household size of 3.37 persons per household. non-family households (81 | 21.5%) represent the smallest median household size with 1.17 persons per household.
| Household Type | # Households | Household Size |
| Married-Couple | 273 (72.4%) | 3.37 |
| Single Male/Father | 6 (1.6%) | 3.17 |
| Single Female/Mother | 17 (4.5%) | 2.76 |
| Non-family | 81 (21.5%) | 1.17 |
| Total Households | 377 (100.0%) | 2.87 |
Household Size by Marriage Status in Churchill
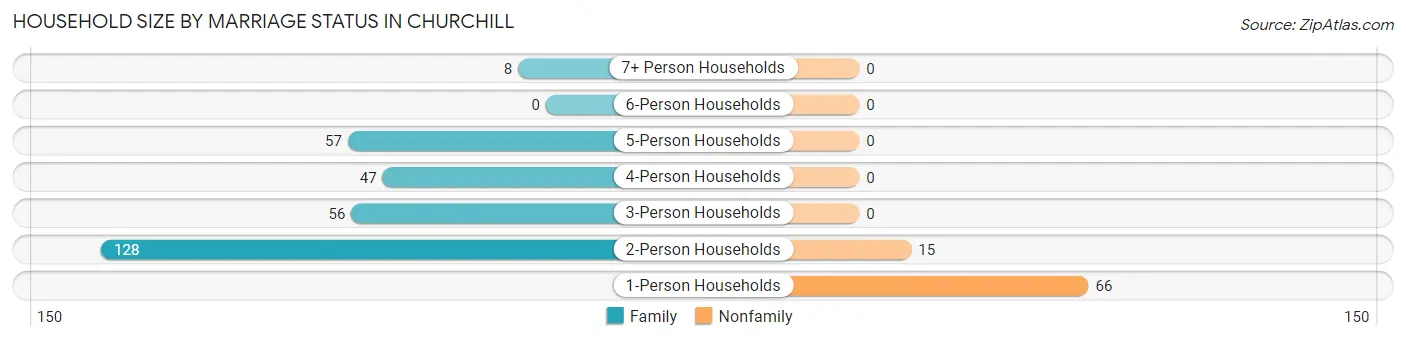
Out of a total of 377 households in Churchill, 296 (78.5%) are family households, while 81 (21.5%) are nonfamily households. The most numerous type of family households are 2-person households, comprising 128, and the most common type of nonfamily households are 1-person households, comprising 66.
| Household Size | Family Households | Nonfamily Households |
| 1-Person Households | - | 66 (17.5%) |
| 2-Person Households | 128 (34.0%) | 15 (4.0%) |
| 3-Person Households | 56 (14.8%) | 0 (0.0%) |
| 4-Person Households | 47 (12.5%) | 0 (0.0%) |
| 5-Person Households | 57 (15.1%) | 0 (0.0%) |
| 6-Person Households | 0 (0.0%) | 0 (0.0%) |
| 7+ Person Households | 8 (2.1%) | 0 (0.0%) |
| Total | 296 (78.5%) | 81 (21.5%) |
Female Fertility in Churchill
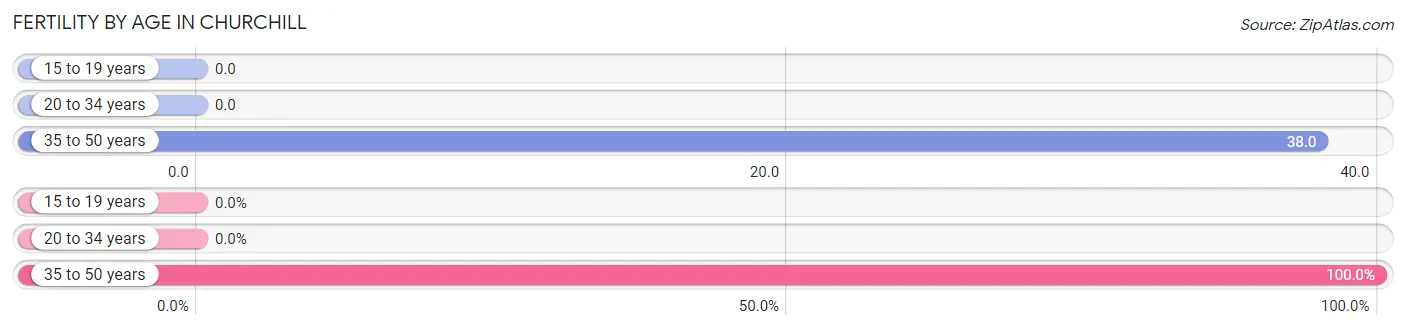
Fertility by Age in Churchill
Average fertility rate in Churchill is 26.0 births per 1,000 women. Women in the age bracket of 35 to 50 years have the highest fertility rate with 38.0 births per 1,000 women. Women in the age bracket of 35 to 50 years acount for 100.0% of all women with births.
| Age Bracket | Women with Births | Births / 1,000 Women |
| 15 to 19 years | 0 (0.0%) | 0.0 |
| 20 to 34 years | 0 (0.0%) | 0.0 |
| 35 to 50 years | 6 (100.0%) | 38.0 |
| Total | 6 (100.0%) | 26.0 |
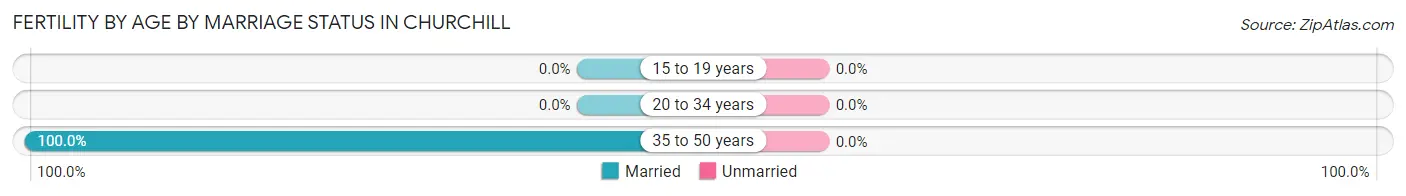
Fertility by Age by Marriage Status in Churchill
| Age Bracket | Married | Unmarried |
| 15 to 19 years | 0 (0.0%) | 0 (0.0%) |
| 20 to 34 years | 0 (0.0%) | 0 (0.0%) |
| 35 to 50 years | 6 (100.0%) | 0 (0.0%) |
| Total | 6 (100.0%) | 0 (0.0%) |
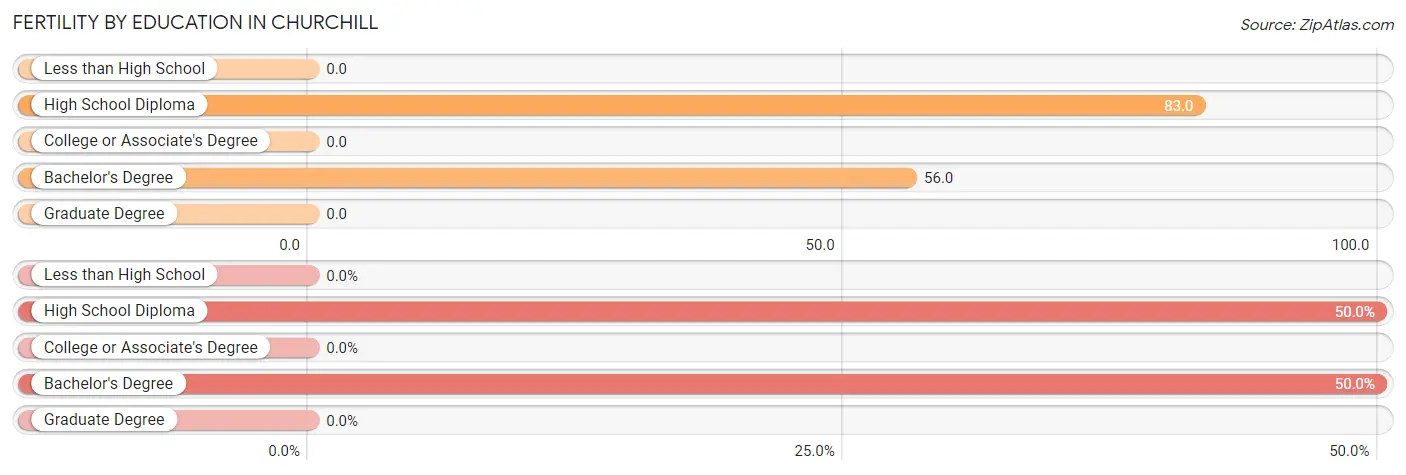
Fertility by Education in Churchill
| Educational Attainment | Women with Births | Births / 1,000 Women |
| Less than High School | 0 (0.0%) | 0.0 |
| High School Diploma | 3 (50.0%) | 83.0 |
| College or Associate's Degree | 0 (0.0%) | 0.0 |
| Bachelor's Degree | 3 (50.0%) | 56.0 |
| Graduate Degree | 0 (0.0%) | 0.0 |
| Total | 6 (100.0%) | 26.0 |
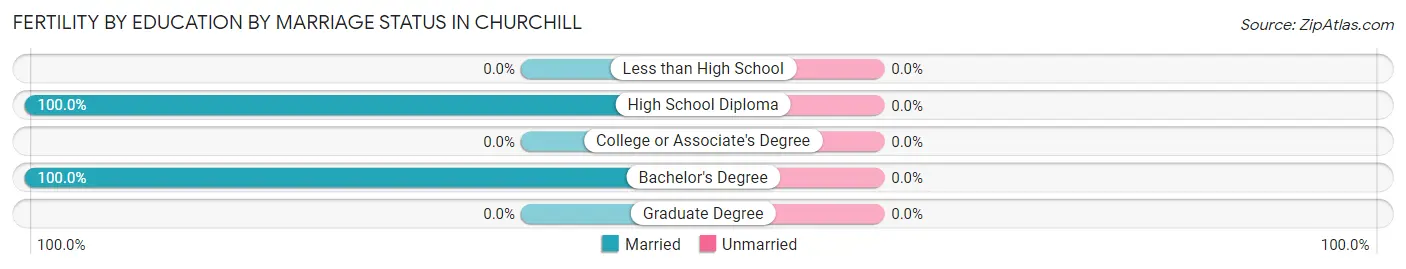
Fertility by Education by Marriage Status in Churchill
| Educational Attainment | Married | Unmarried |
| Less than High School | 0 (0.0%) | 0 (0.0%) |
| High School Diploma | 3 (100.0%) | 0 (0.0%) |
| College or Associate's Degree | 0 (0.0%) | 0 (0.0%) |
| Bachelor's Degree | 3 (100.0%) | 0 (0.0%) |
| Graduate Degree | 0 (0.0%) | 0 (0.0%) |
| Total | 6 (100.0%) | 0 (0.0%) |
Income in Churchill
Income Overview in Churchill
Per Capita Income in Churchill is $36,968, while median incomes of families and households are $114,000 and $90,250 respectively.
| Characteristic | Number | Measure |
| Per Capita Income | 1,081 | $36,968 |
| Median Family Income | 296 | $114,000 |
| Mean Family Income | 296 | $121,854 |
| Median Household Income | 377 | $90,250 |
| Mean Household Income | 377 | $104,506 |
| Income Deficit | 296 | $0 |
| Wage / Income Gap (%) | 1,081 | 43.79% |
| Wage / Income Gap ($) | 1,081 | 56.21¢ per $1 |
| Gini / Inequality Index | 1,081 | 0.39 |
Earnings by Sex in Churchill
Average Earnings in Churchill are $45,917, $63,500 for men and $35,694 for women, a difference of 43.8%.
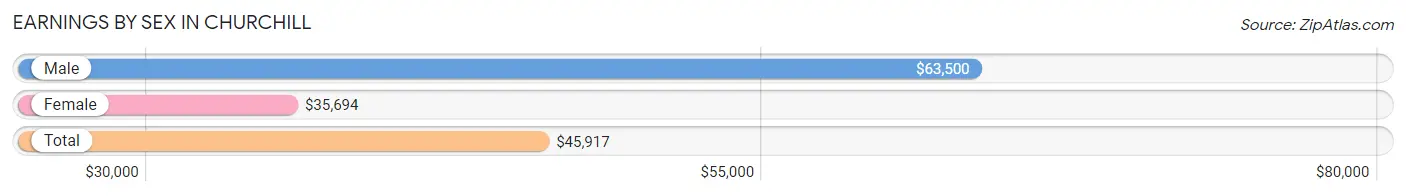
| Sex | Number | Average Earnings |
| Male | 300 (53.7%) | $63,500 |
| Female | 259 (46.3%) | $35,694 |
| Total | 559 (100.0%) | $45,917 |
Earnings by Sex by Income Bracket in Churchill
The most common earnings brackets in Churchill are $75,000 to $99,999 for men (65 | 21.7%) and $40,000 to $44,999 for women (33 | 12.7%).
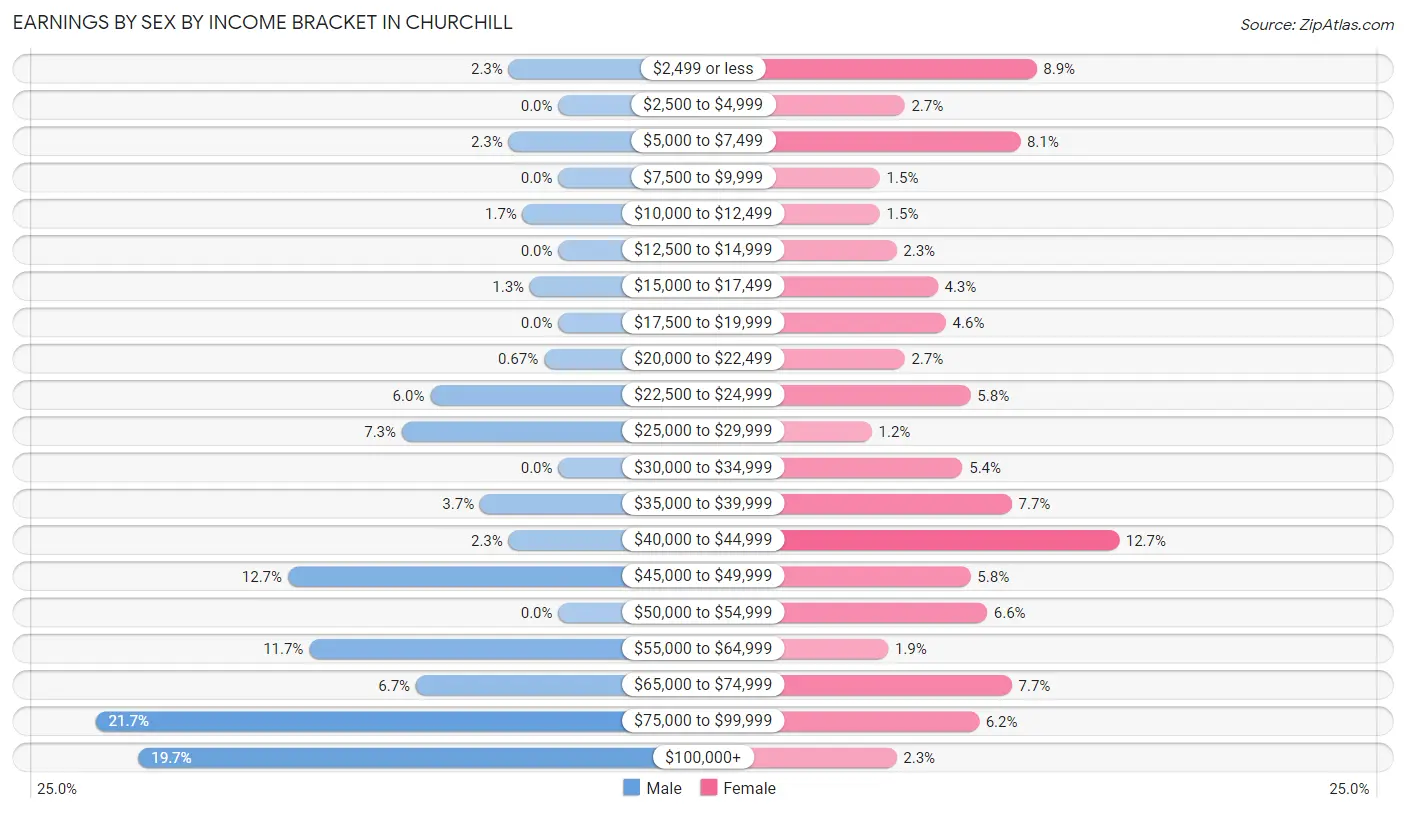
| Income | Male | Female |
| $2,499 or less | 7 (2.3%) | 23 (8.9%) |
| $2,500 to $4,999 | 0 (0.0%) | 7 (2.7%) |
| $5,000 to $7,499 | 7 (2.3%) | 21 (8.1%) |
| $7,500 to $9,999 | 0 (0.0%) | 4 (1.5%) |
| $10,000 to $12,499 | 5 (1.7%) | 4 (1.5%) |
| $12,500 to $14,999 | 0 (0.0%) | 6 (2.3%) |
| $15,000 to $17,499 | 4 (1.3%) | 11 (4.3%) |
| $17,500 to $19,999 | 0 (0.0%) | 12 (4.6%) |
| $20,000 to $22,499 | 2 (0.7%) | 7 (2.7%) |
| $22,500 to $24,999 | 18 (6.0%) | 15 (5.8%) |
| $25,000 to $29,999 | 22 (7.3%) | 3 (1.2%) |
| $30,000 to $34,999 | 0 (0.0%) | 14 (5.4%) |
| $35,000 to $39,999 | 11 (3.7%) | 20 (7.7%) |
| $40,000 to $44,999 | 7 (2.3%) | 33 (12.7%) |
| $45,000 to $49,999 | 38 (12.7%) | 15 (5.8%) |
| $50,000 to $54,999 | 0 (0.0%) | 17 (6.6%) |
| $55,000 to $64,999 | 35 (11.7%) | 5 (1.9%) |
| $65,000 to $74,999 | 20 (6.7%) | 20 (7.7%) |
| $75,000 to $99,999 | 65 (21.7%) | 16 (6.2%) |
| $100,000+ | 59 (19.7%) | 6 (2.3%) |
| Total | 300 (100.0%) | 259 (100.0%) |
Earnings by Sex by Educational Attainment in Churchill
Average earnings in Churchill are $71,528 for men and $39,091 for women, a difference of 45.4%. Men with an educational attainment of graduate degree enjoy the highest average annual earnings of $103,750, while those with bachelor's degree education earn the least with $56,750. Women with an educational attainment of graduate degree earn the most with the average annual earnings of $63,333, while those with bachelor's degree education have the smallest earnings of $32,222.
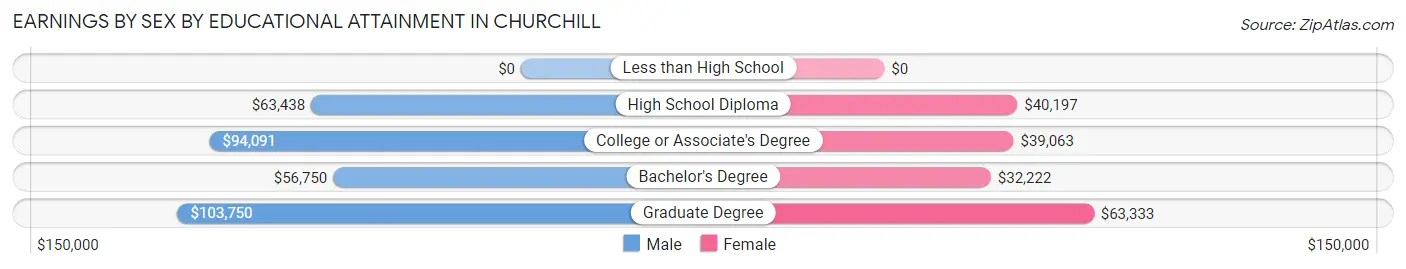
| Educational Attainment | Male Income | Female Income |
| Less than High School | - | - |
| High School Diploma | $63,438 | $40,197 |
| College or Associate's Degree | $94,091 | $39,063 |
| Bachelor's Degree | $56,750 | $32,222 |
| Graduate Degree | $103,750 | $63,333 |
| Total | $71,528 | $39,091 |
Family Income in Churchill
Family Income Brackets in Churchill
According to the Churchill family income data, there are 68 families falling into the $100,000 to $149,999 income range, which is the most common income bracket and makes up 23.0% of all families. Conversely, the $10,000 to $14,999 income bracket is the least frequent group with only 2 families (0.7%) belonging to this category.
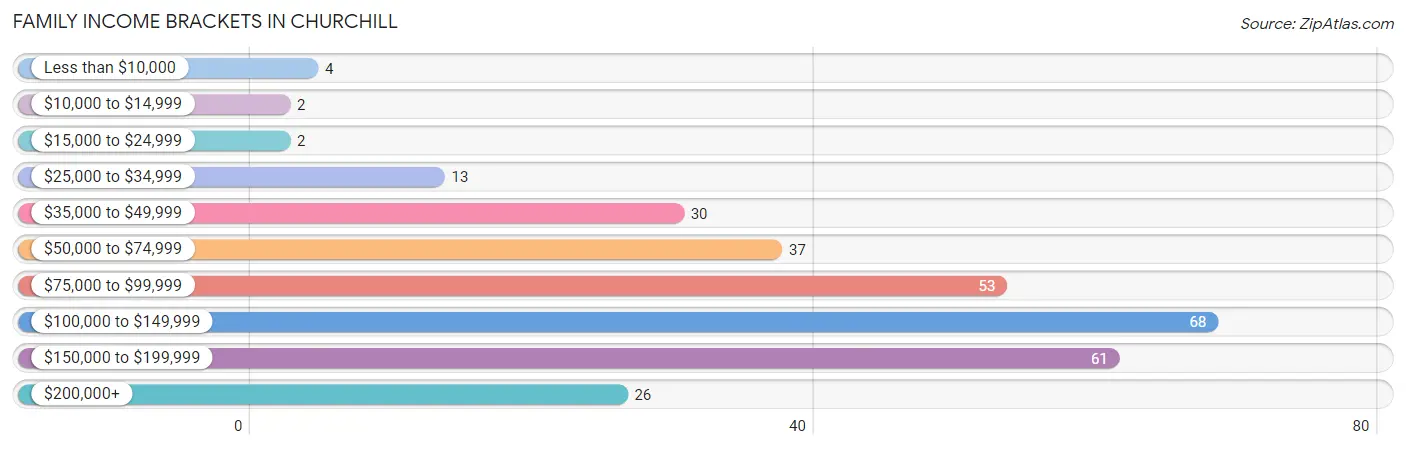
| Income Bracket | # Families | % Families |
| Less than $10,000 | 4 | 1.4% |
| $10,000 to $14,999 | 2 | 0.7% |
| $15,000 to $24,999 | 2 | 0.7% |
| $25,000 to $34,999 | 13 | 4.4% |
| $35,000 to $49,999 | 30 | 10.1% |
| $50,000 to $74,999 | 37 | 12.5% |
| $75,000 to $99,999 | 53 | 17.9% |
| $100,000 to $149,999 | 68 | 23.0% |
| $150,000 to $199,999 | 61 | 20.6% |
| $200,000+ | 26 | 8.8% |
Family Income by Famaliy Size in Churchill
3-person families (60 | 20.3%) account for the highest median family income in Churchill with $139,688 per family, while 3-person families (60 | 20.3%) have the highest median income of $46,563 per family member.
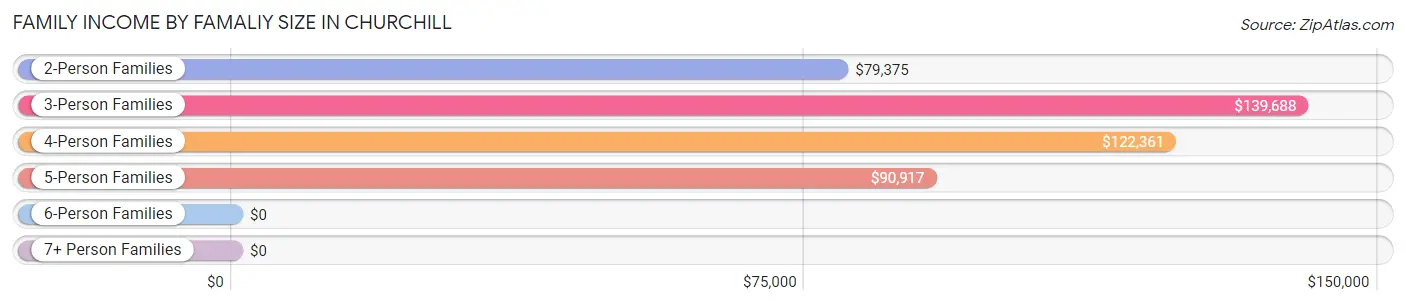
| Income Bracket | # Families | Median Income |
| 2-Person Families | 128 (43.2%) | $79,375 |
| 3-Person Families | 60 (20.3%) | $139,688 |
| 4-Person Families | 45 (15.2%) | $122,361 |
| 5-Person Families | 55 (18.6%) | $90,917 |
| 6-Person Families | 0 (0.0%) | $0 |
| 7+ Person Families | 8 (2.7%) | $0 |
| Total | 296 (100.0%) | $114,000 |
Family Income by Number of Earners in Churchill
The median family income in Churchill is $114,000, with families comprising 3+ earners (45) having the highest median family income of $135,417, while families with no earners (40) have the lowest median family income of $46,184, accounting for 15.2% and 13.5% of families, respectively.
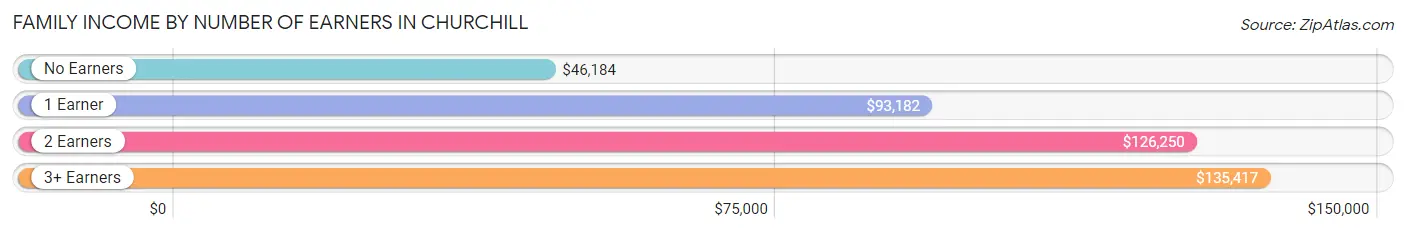
| Number of Earners | # Families | Median Income |
| No Earners | 40 (13.5%) | $46,184 |
| 1 Earner | 60 (20.3%) | $93,182 |
| 2 Earners | 151 (51.0%) | $126,250 |
| 3+ Earners | 45 (15.2%) | $135,417 |
| Total | 296 (100.0%) | $114,000 |
Household Income in Churchill
Household Income Brackets in Churchill
With 75 households falling in the category, the $100,000 to $149,999 income range is the most frequent in Churchill, accounting for 19.9% of all households. In contrast, only 2 households (0.5%) fall into the $10,000 to $14,999 income bracket, making it the least populous group.
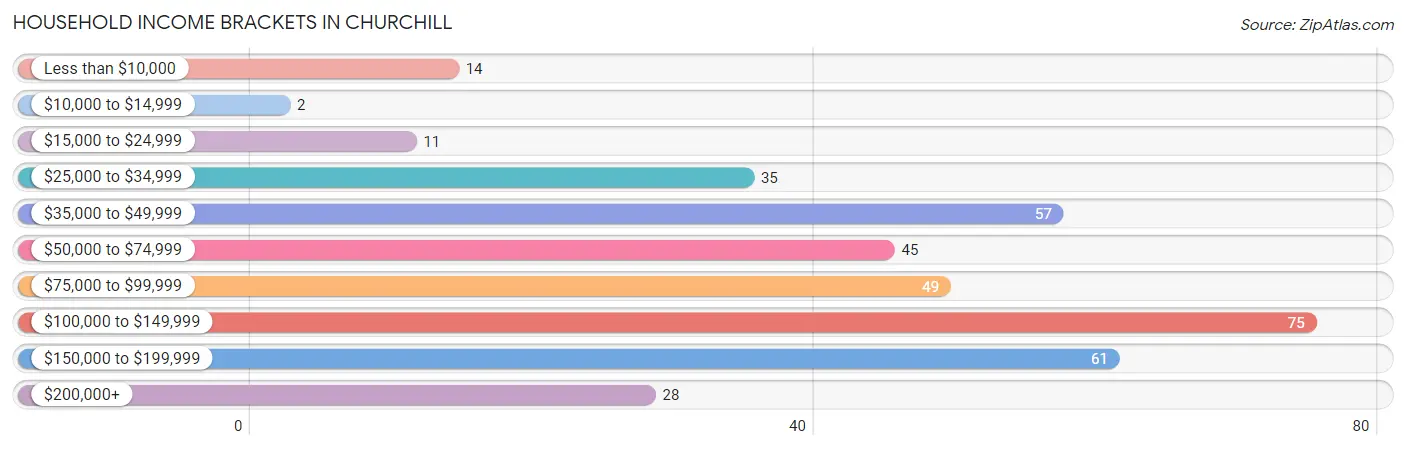
| Income Bracket | # Households | % Households |
| Less than $10,000 | 14 | 3.7% |
| $10,000 to $14,999 | 2 | 0.5% |
| $15,000 to $24,999 | 11 | 2.9% |
| $25,000 to $34,999 | 35 | 9.3% |
| $35,000 to $49,999 | 57 | 15.1% |
| $50,000 to $74,999 | 45 | 11.9% |
| $75,000 to $99,999 | 49 | 13.0% |
| $100,000 to $149,999 | 75 | 19.9% |
| $150,000 to $199,999 | 61 | 16.2% |
| $200,000+ | 28 | 7.4% |
Household Income by Householder Age in Churchill
The median household income in Churchill is $90,250, with the highest median household income of $122,396 found in the 25 to 44 years age bracket for the primary householder. A total of 103 households (27.3%) fall into this category.
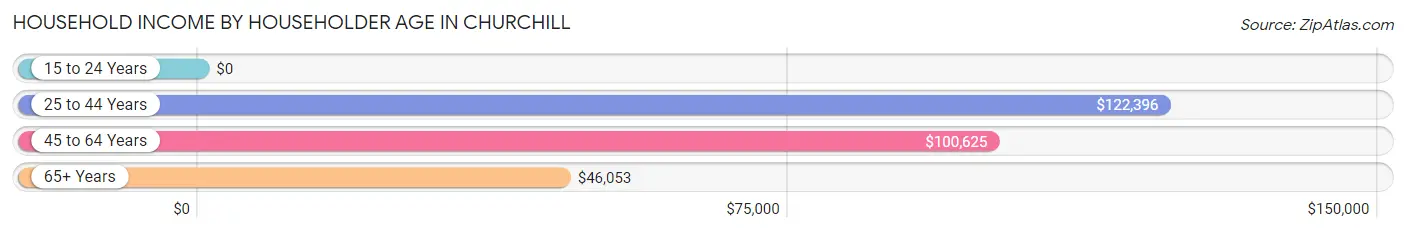
| Income Bracket | # Households | Median Income |
| 15 to 24 Years | 0 (0.0%) | $0 |
| 25 to 44 Years | 103 (27.3%) | $122,396 |
| 45 to 64 Years | 154 (40.8%) | $100,625 |
| 65+ Years | 120 (31.8%) | $46,053 |
| Total | 377 (100.0%) | $90,250 |
Poverty in Churchill
Income Below Poverty by Sex and Age in Churchill
With 2.4% poverty level for males and 5.9% for females among the residents of Churchill, 16 and 17 year old males and 75 year old and over females are the most vulnerable to poverty, with 2 males (20.0%) and 10 females (31.2%) in their respective age groups living below the poverty level.
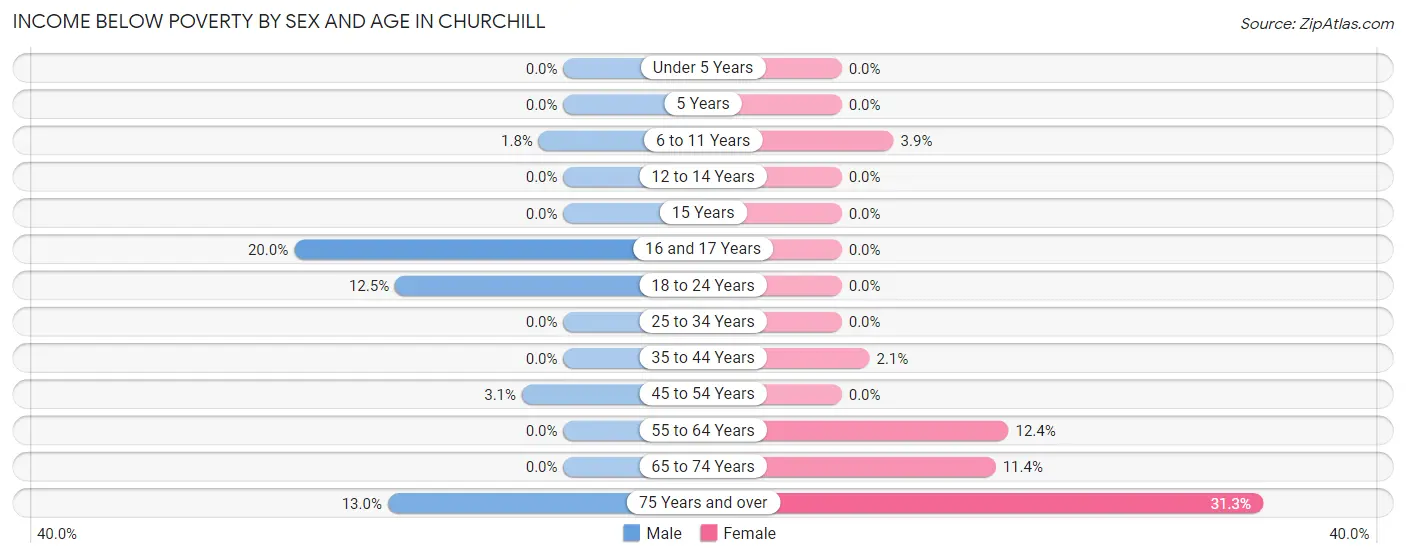
| Age Bracket | Male | Female |
| Under 5 Years | 0 (0.0%) | 0 (0.0%) |
| 5 Years | 0 (0.0%) | 0 (0.0%) |
| 6 to 11 Years | 2 (1.8%) | 2 (3.8%) |
| 12 to 14 Years | 0 (0.0%) | 0 (0.0%) |
| 15 Years | 0 (0.0%) | 0 (0.0%) |
| 16 and 17 Years | 2 (20.0%) | 0 (0.0%) |
| 18 to 24 Years | 4 (12.5%) | 0 (0.0%) |
| 25 to 34 Years | 0 (0.0%) | 0 (0.0%) |
| 35 to 44 Years | 0 (0.0%) | 2 (2.1%) |
| 45 to 54 Years | 2 (3.1%) | 0 (0.0%) |
| 55 to 64 Years | 0 (0.0%) | 13 (12.4%) |
| 65 to 74 Years | 0 (0.0%) | 4 (11.4%) |
| 75 Years and over | 3 (13.0%) | 10 (31.2%) |
| Total | 13 (2.4%) | 31 (5.9%) |
Income Above Poverty by Sex and Age in Churchill
According to the poverty statistics in Churchill, males aged under 5 years and females aged under 5 years are the age groups that are most secure financially, with 100.0% of males and 100.0% of females in these age groups living above the poverty line.
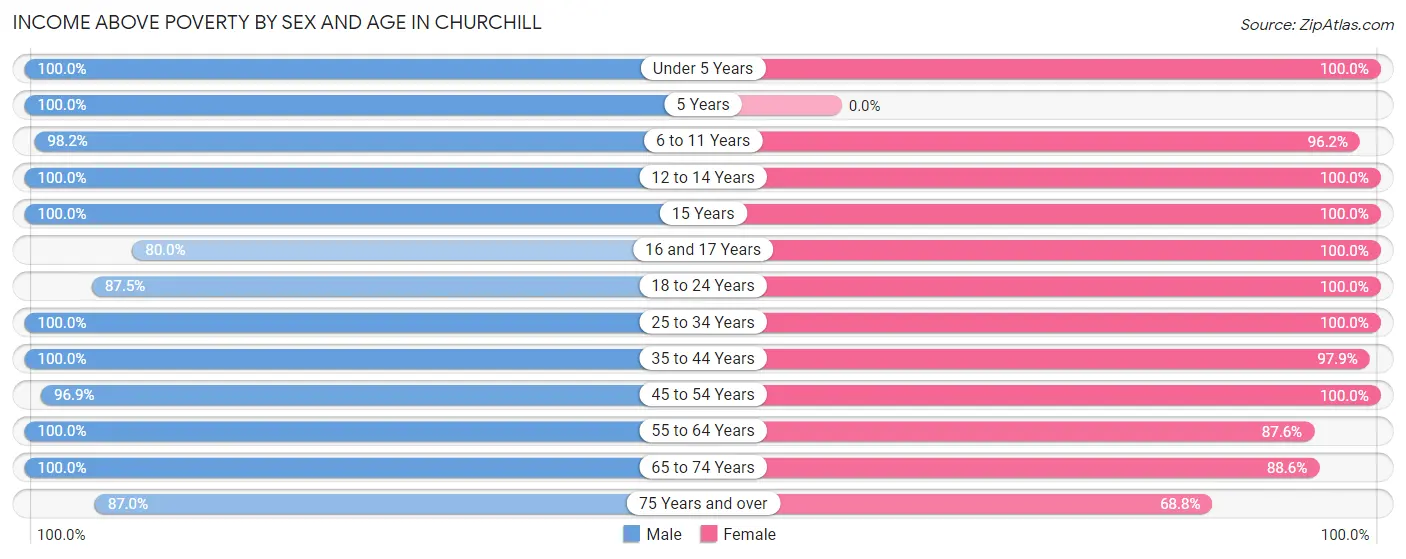
| Age Bracket | Male | Female |
| Under 5 Years | 34 (100.0%) | 14 (100.0%) |
| 5 Years | 10 (100.0%) | 0 (0.0%) |
| 6 to 11 Years | 107 (98.2%) | 50 (96.2%) |
| 12 to 14 Years | 19 (100.0%) | 38 (100.0%) |
| 15 Years | 7 (100.0%) | 15 (100.0%) |
| 16 and 17 Years | 8 (80.0%) | 27 (100.0%) |
| 18 to 24 Years | 28 (87.5%) | 17 (100.0%) |
| 25 to 34 Years | 24 (100.0%) | 18 (100.0%) |
| 35 to 44 Years | 91 (100.0%) | 95 (97.9%) |
| 45 to 54 Years | 63 (96.9%) | 78 (100.0%) |
| 55 to 64 Years | 68 (100.0%) | 92 (87.6%) |
| 65 to 74 Years | 61 (100.0%) | 31 (88.6%) |
| 75 Years and over | 20 (87.0%) | 22 (68.8%) |
| Total | 540 (97.7%) | 497 (94.1%) |
Income Below Poverty Among Married-Couple Families in Churchill
The poverty statistics for married-couple families in Churchill show that 2.2% or 6 of the total 273 families live below the poverty line. Families with no children have the highest poverty rate of 2.8%, comprising of 4 families. On the other hand, families with 3 or 4 children have the lowest poverty rate of 0.0%, which includes 0 families.
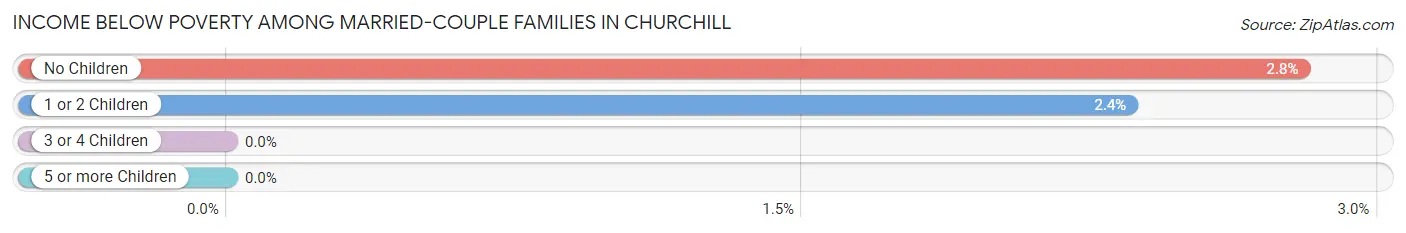
| Children | Above Poverty | Below Poverty |
| No Children | 139 (97.2%) | 4 (2.8%) |
| 1 or 2 Children | 83 (97.7%) | 2 (2.4%) |
| 3 or 4 Children | 37 (100.0%) | 0 (0.0%) |
| 5 or more Children | 8 (100.0%) | 0 (0.0%) |
| Total | 267 (97.8%) | 6 (2.2%) |
Income Below Poverty Among Single-Parent Households in Churchill
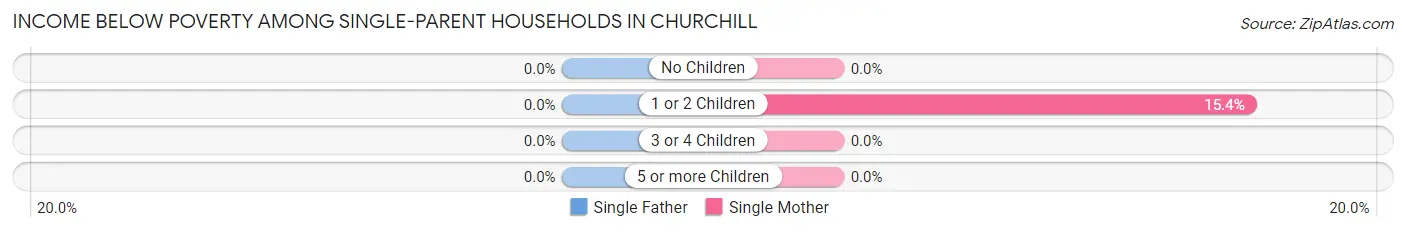
| Children | Single Father | Single Mother |
| No Children | 0 (0.0%) | 0 (0.0%) |
| 1 or 2 Children | 0 (0.0%) | 2 (15.4%) |
| 3 or 4 Children | 0 (0.0%) | 0 (0.0%) |
| 5 or more Children | 0 (0.0%) | 0 (0.0%) |
| Total | 0 (0.0%) | 2 (11.8%) |
Income Below Poverty Among Married-Couple vs Single-Parent Households in Churchill
The poverty data for Churchill shows that 6 of the married-couple family households (2.2%) and 2 of the single-parent households (8.7%) are living below the poverty level. Within the married-couple family households, those with no children have the highest poverty rate, with 4 households (2.8%) falling below the poverty line. Among the single-parent households, those with 1 or 2 children have the highest poverty rate, with 2 household (11.8%) living below poverty.
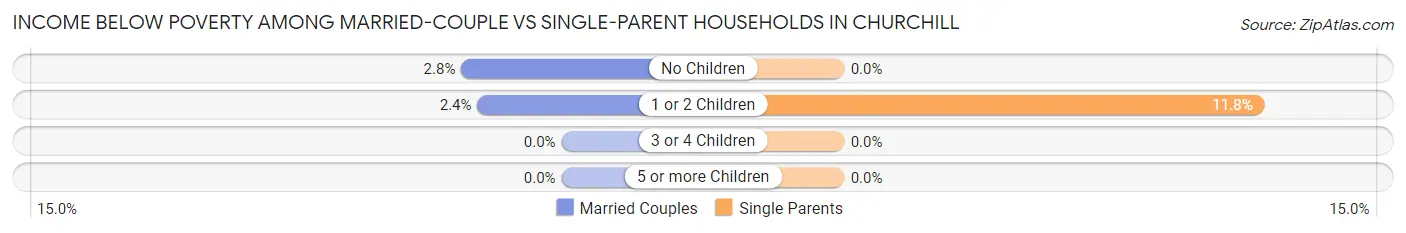
| Children | Married-Couple Families | Single-Parent Households |
| No Children | 4 (2.8%) | 0 (0.0%) |
| 1 or 2 Children | 2 (2.4%) | 2 (11.8%) |
| 3 or 4 Children | 0 (0.0%) | 0 (0.0%) |
| 5 or more Children | 0 (0.0%) | 0 (0.0%) |
| Total | 6 (2.2%) | 2 (8.7%) |
Employment Characteristics in Churchill
Employment by Class of Employer in Churchill
Among the 530 employed individuals in Churchill, private company employees (329 | 62.1%), not-for-profit organizations (50 | 9.4%), and self-employed (not incorporated) (45 | 8.5%) make up the most common classes of employment.
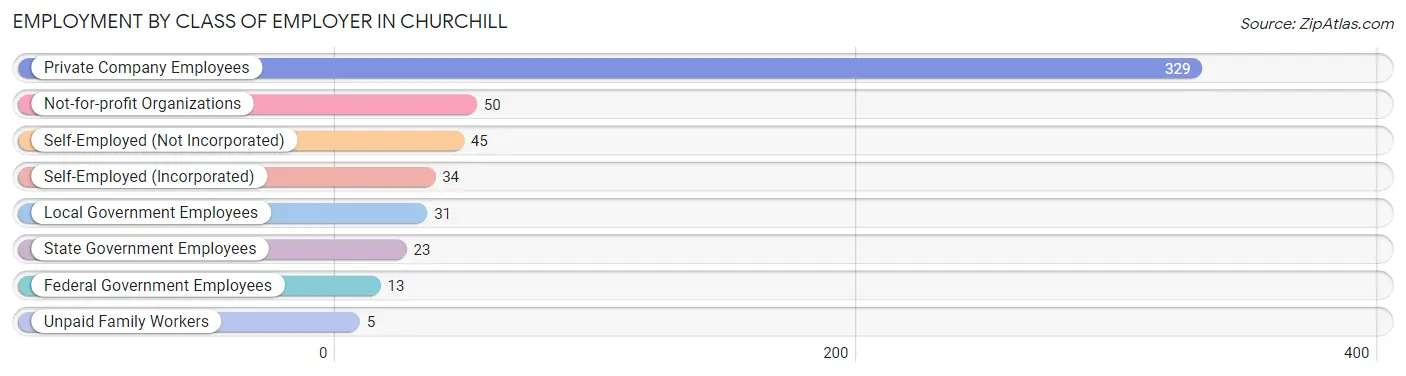
| Employer Class | # Employees | % Employees |
| Private Company Employees | 329 | 62.1% |
| Self-Employed (Incorporated) | 34 | 6.4% |
| Self-Employed (Not Incorporated) | 45 | 8.5% |
| Not-for-profit Organizations | 50 | 9.4% |
| Local Government Employees | 31 | 5.9% |
| State Government Employees | 23 | 4.3% |
| Federal Government Employees | 13 | 2.5% |
| Unpaid Family Workers | 5 | 0.9% |
| Total | 530 | 100.0% |
Employment Status by Age in Churchill
According to the labor force statistics for Churchill, out of the total population over 16 years of age (783), 69.1% or 541 individuals are in the labor force, with 0.6% or 3 of them unemployed. The age group with the highest labor force participation rate is 20 to 24 years, with 100.0% or 36 individuals in the labor force. Within the labor force, the 30 to 34 years age range has the highest percentage of unemployed individuals, with 11.8% or 2 of them being unemployed.
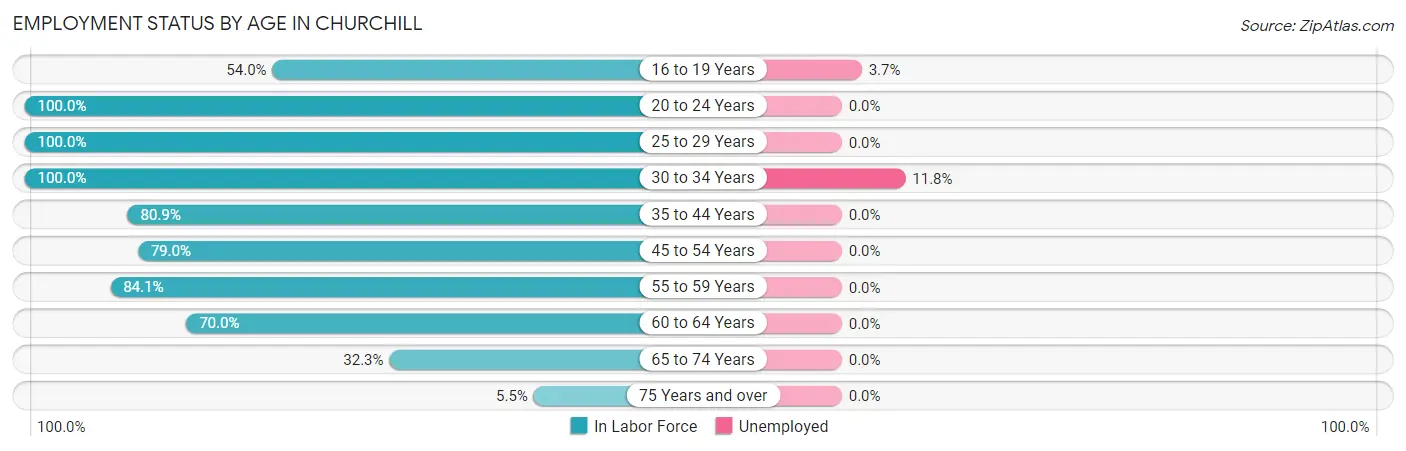
| Age Bracket | In Labor Force | Unemployed |
| 16 to 19 Years | 27 (54.0%) | 1 (3.7%) |
| 20 to 24 Years | 36 (100.0%) | 0 (0.0%) |
| 25 to 29 Years | 25 (100.0%) | 0 (0.0%) |
| 30 to 34 Years | 17 (100.0%) | 2 (11.8%) |
| 35 to 44 Years | 152 (80.9%) | 0 (0.0%) |
| 45 to 54 Years | 113 (79.0%) | 0 (0.0%) |
| 55 to 59 Years | 95 (84.1%) | 0 (0.0%) |
| 60 to 64 Years | 42 (70.0%) | 0 (0.0%) |
| 65 to 74 Years | 31 (32.3%) | 0 (0.0%) |
| 75 Years and over | 3 (5.5%) | 0 (0.0%) |
| Total | 541 (69.1%) | 3 (0.6%) |
Employment Status by Educational Attainment in Churchill
According to labor force statistics for Churchill, 81.3% of individuals (444) out of the total population between 25 and 64 years of age (546) are in the labor force, with 0.5% or 2 of them being unemployed. The group with the highest labor force participation rate are those with the educational attainment of less than high school, with 100.0% or 2 individuals in the labor force. Within the labor force, individuals with less than high school education have the highest percentage of unemployment, with 100.0% or 2 of them being unemployed.
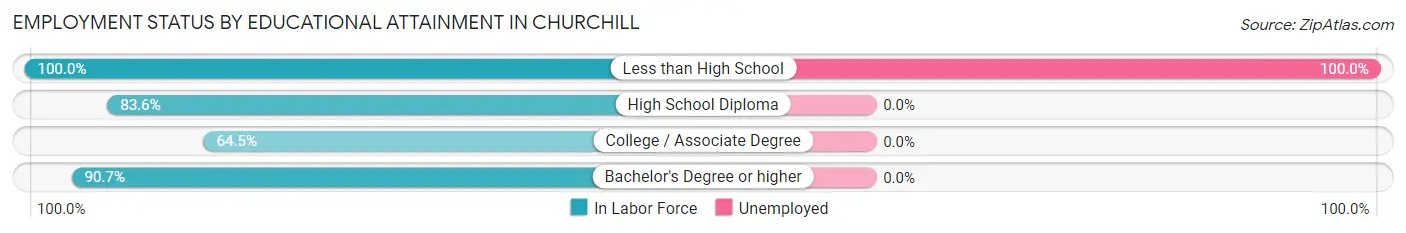
| Educational Attainment | In Labor Force | Unemployed |
| Less than High School | 2 (100.0%) | 2 (100.0%) |
| High School Diploma | 92 (83.6%) | 0 (0.0%) |
| College / Associate Degree | 107 (64.5%) | 0 (0.0%) |
| Bachelor's Degree or higher | 243 (90.7%) | 0 (0.0%) |
| Total | 444 (81.3%) | 3 (0.5%) |
Employment Occupations by Sex in Churchill
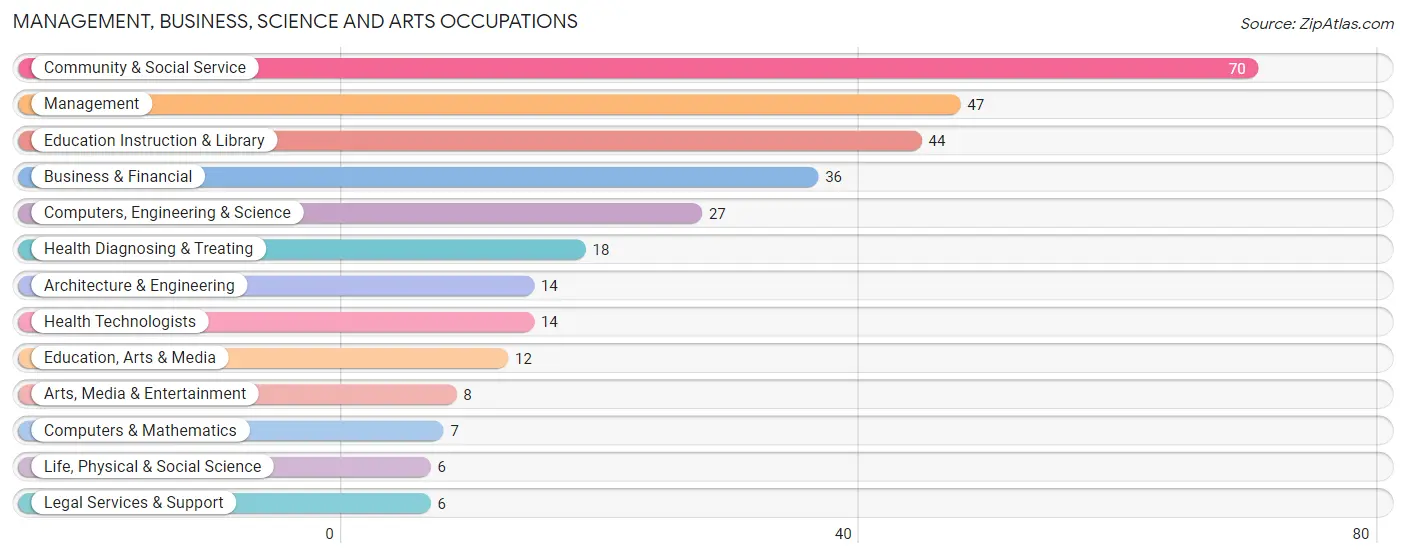
Management, Business, Science and Arts Occupations
The most common Management, Business, Science and Arts occupations in Churchill are Community & Social Service (70 | 13.0%), Management (47 | 8.7%), Education Instruction & Library (44 | 8.2%), Business & Financial (36 | 6.7%), and Computers, Engineering & Science (27 | 5.0%).
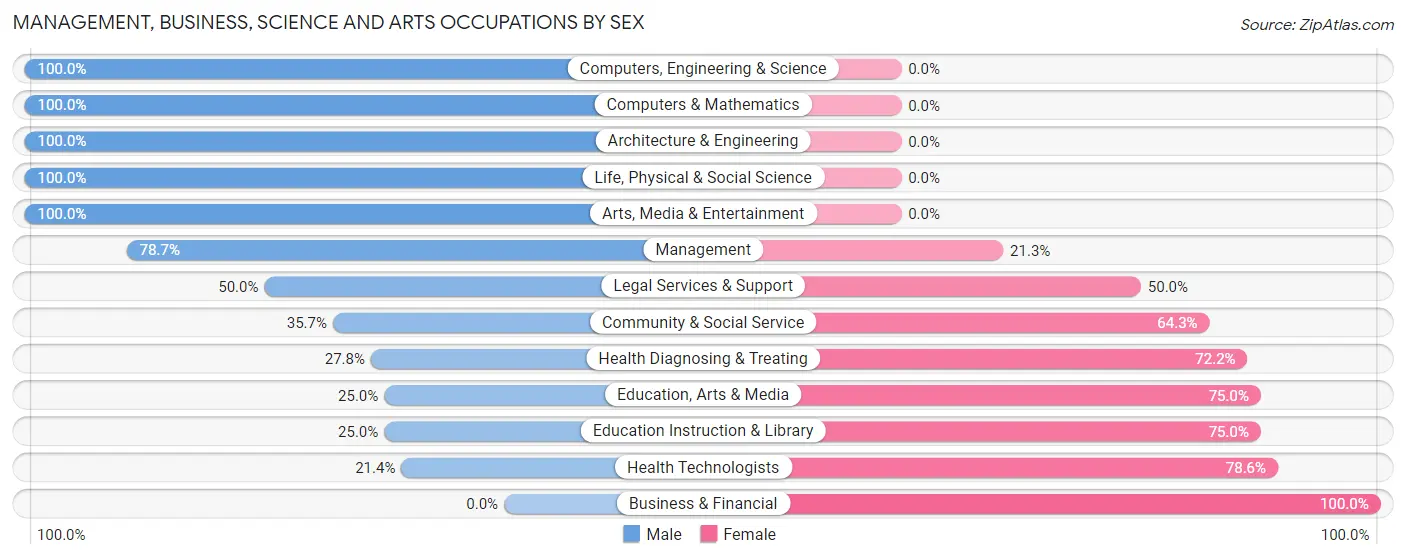
Management, Business, Science and Arts Occupations by Sex
Within the Management, Business, Science and Arts occupations in Churchill, the most male-oriented occupations are Computers, Engineering & Science (100.0%), Computers & Mathematics (100.0%), and Architecture & Engineering (100.0%), while the most female-oriented occupations are Business & Financial (100.0%), Health Technologists (78.6%), and Education, Arts & Media (75.0%).
| Occupation | Male | Female |
| Management | 37 (78.7%) | 10 (21.3%) |
| Business & Financial | 0 (0.0%) | 36 (100.0%) |
| Computers, Engineering & Science | 27 (100.0%) | 0 (0.0%) |
| Computers & Mathematics | 7 (100.0%) | 0 (0.0%) |
| Architecture & Engineering | 14 (100.0%) | 0 (0.0%) |
| Life, Physical & Social Science | 6 (100.0%) | 0 (0.0%) |
| Community & Social Service | 25 (35.7%) | 45 (64.3%) |
| Education, Arts & Media | 3 (25.0%) | 9 (75.0%) |
| Legal Services & Support | 3 (50.0%) | 3 (50.0%) |
| Education Instruction & Library | 11 (25.0%) | 33 (75.0%) |
| Arts, Media & Entertainment | 8 (100.0%) | 0 (0.0%) |
| Health Diagnosing & Treating | 5 (27.8%) | 13 (72.2%) |
| Health Technologists | 3 (21.4%) | 11 (78.6%) |
| Total (Category) | 94 (47.5%) | 104 (52.5%) |
| Total (Overall) | 291 (54.1%) | 247 (45.9%) |
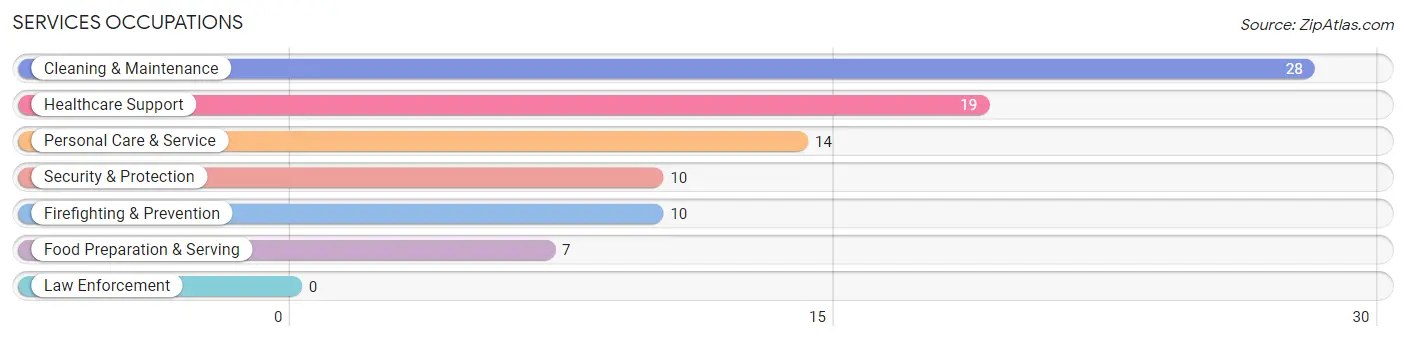
Services Occupations
The most common Services occupations in Churchill are Cleaning & Maintenance (28 | 5.2%), Healthcare Support (19 | 3.5%), Personal Care & Service (14 | 2.6%), Security & Protection (10 | 1.9%), and Firefighting & Prevention (10 | 1.9%).
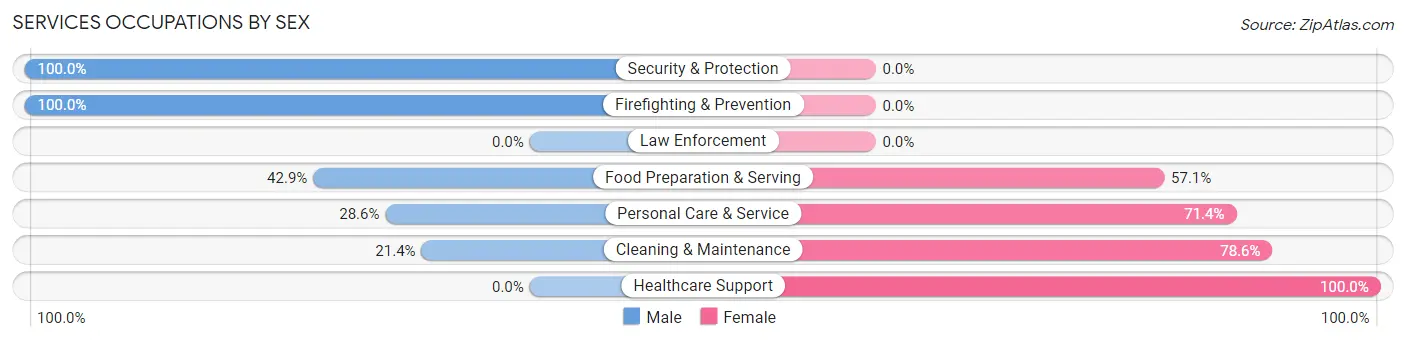
Services Occupations by Sex
Within the Services occupations in Churchill, the most male-oriented occupations are Security & Protection (100.0%), Firefighting & Prevention (100.0%), and Food Preparation & Serving (42.9%), while the most female-oriented occupations are Healthcare Support (100.0%), Cleaning & Maintenance (78.6%), and Personal Care & Service (71.4%).
| Occupation | Male | Female |
| Healthcare Support | 0 (0.0%) | 19 (100.0%) |
| Security & Protection | 10 (100.0%) | 0 (0.0%) |
| Firefighting & Prevention | 10 (100.0%) | 0 (0.0%) |
| Law Enforcement | 0 (0.0%) | 0 (0.0%) |
| Food Preparation & Serving | 3 (42.9%) | 4 (57.1%) |
| Cleaning & Maintenance | 6 (21.4%) | 22 (78.6%) |
| Personal Care & Service | 4 (28.6%) | 10 (71.4%) |
| Total (Category) | 23 (29.5%) | 55 (70.5%) |
| Total (Overall) | 291 (54.1%) | 247 (45.9%) |
Sales and Office Occupations
The most common Sales and Office occupations in Churchill are Sales & Related (56 | 10.4%), and Office & Administration (55 | 10.2%).
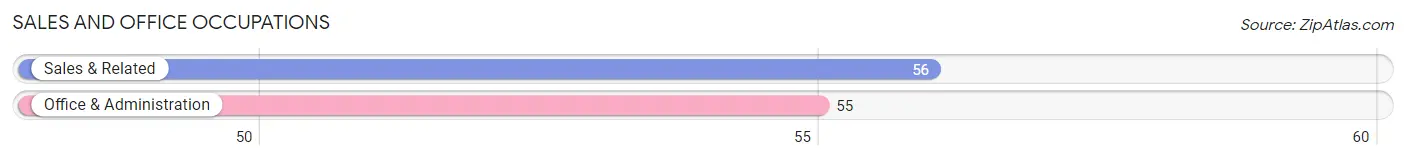
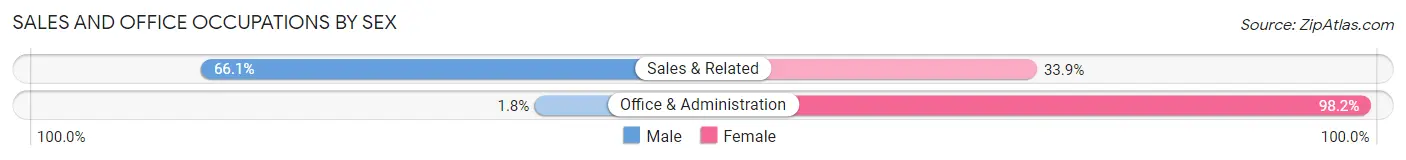
Sales and Office Occupations by Sex
| Occupation | Male | Female |
| Sales & Related | 37 (66.1%) | 19 (33.9%) |
| Office & Administration | 1 (1.8%) | 54 (98.2%) |
| Total (Category) | 38 (34.2%) | 73 (65.8%) |
| Total (Overall) | 291 (54.1%) | 247 (45.9%) |
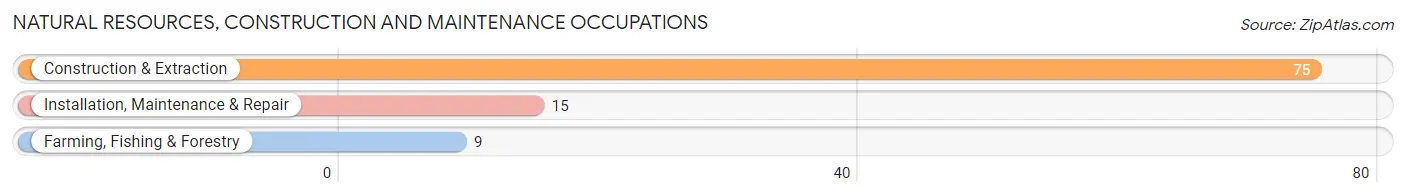
Natural Resources, Construction and Maintenance Occupations
The most common Natural Resources, Construction and Maintenance occupations in Churchill are Construction & Extraction (75 | 13.9%), Installation, Maintenance & Repair (15 | 2.8%), and Farming, Fishing & Forestry (9 | 1.7%).
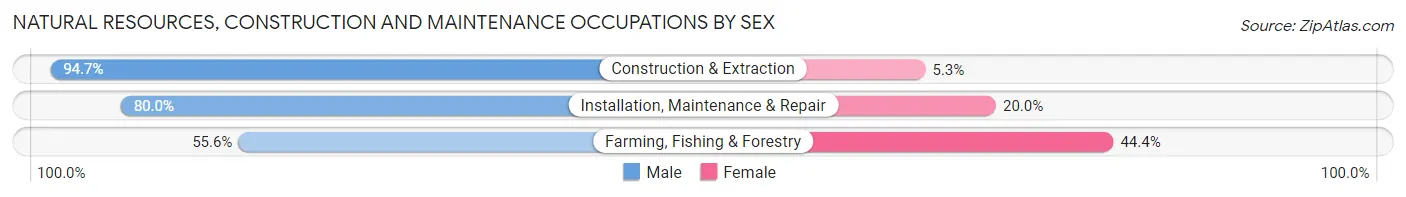
Natural Resources, Construction and Maintenance Occupations by Sex
| Occupation | Male | Female |
| Farming, Fishing & Forestry | 5 (55.6%) | 4 (44.4%) |
| Construction & Extraction | 71 (94.7%) | 4 (5.3%) |
| Installation, Maintenance & Repair | 12 (80.0%) | 3 (20.0%) |
| Total (Category) | 88 (88.9%) | 11 (11.1%) |
| Total (Overall) | 291 (54.1%) | 247 (45.9%) |
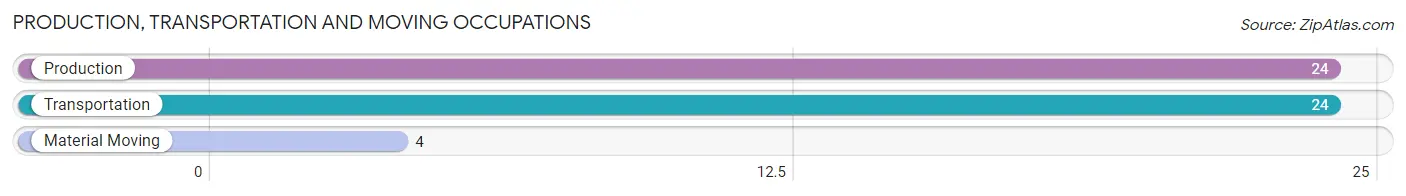
Production, Transportation and Moving Occupations
The most common Production, Transportation and Moving occupations in Churchill are Production (24 | 4.5%), Transportation (24 | 4.5%), and Material Moving (4 | 0.7%).
Production, Transportation and Moving Occupations by Sex
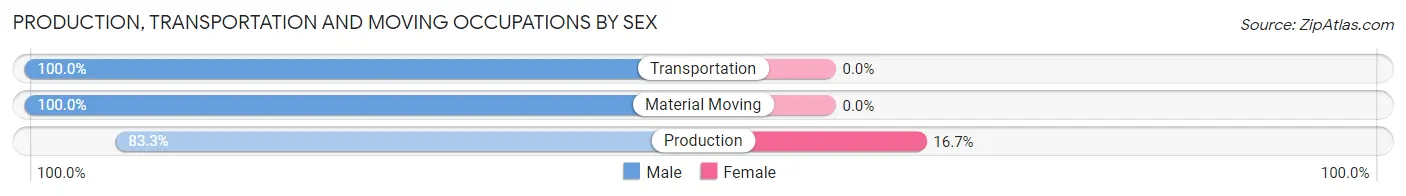
| Occupation | Male | Female |
| Production | 20 (83.3%) | 4 (16.7%) |
| Transportation | 24 (100.0%) | 0 (0.0%) |
| Material Moving | 4 (100.0%) | 0 (0.0%) |
| Total (Category) | 48 (92.3%) | 4 (7.7%) |
| Total (Overall) | 291 (54.1%) | 247 (45.9%) |
Employment Industries by Sex in Churchill
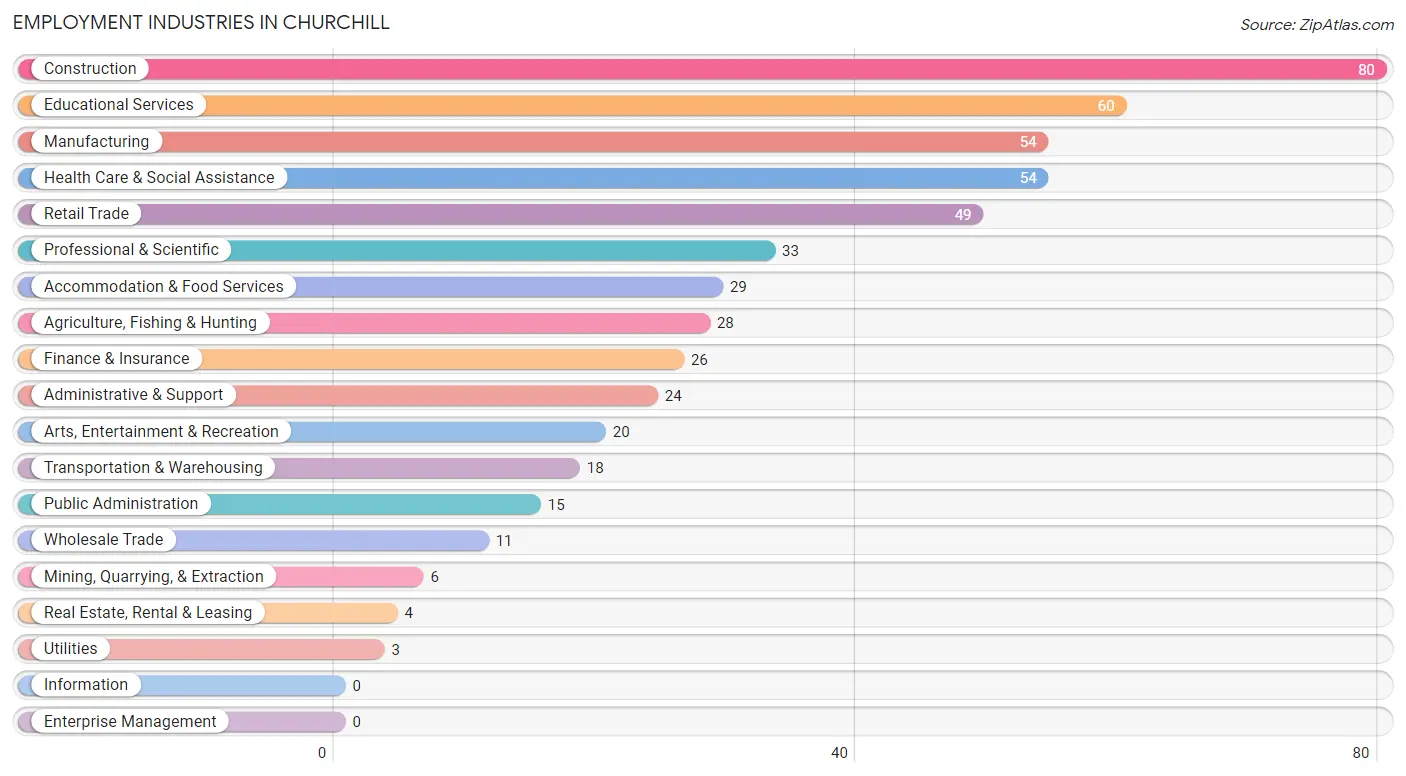
Employment Industries in Churchill
The major employment industries in Churchill include Construction (80 | 14.9%), Educational Services (60 | 11.2%), Manufacturing (54 | 10.0%), Health Care & Social Assistance (54 | 10.0%), and Retail Trade (49 | 9.1%).
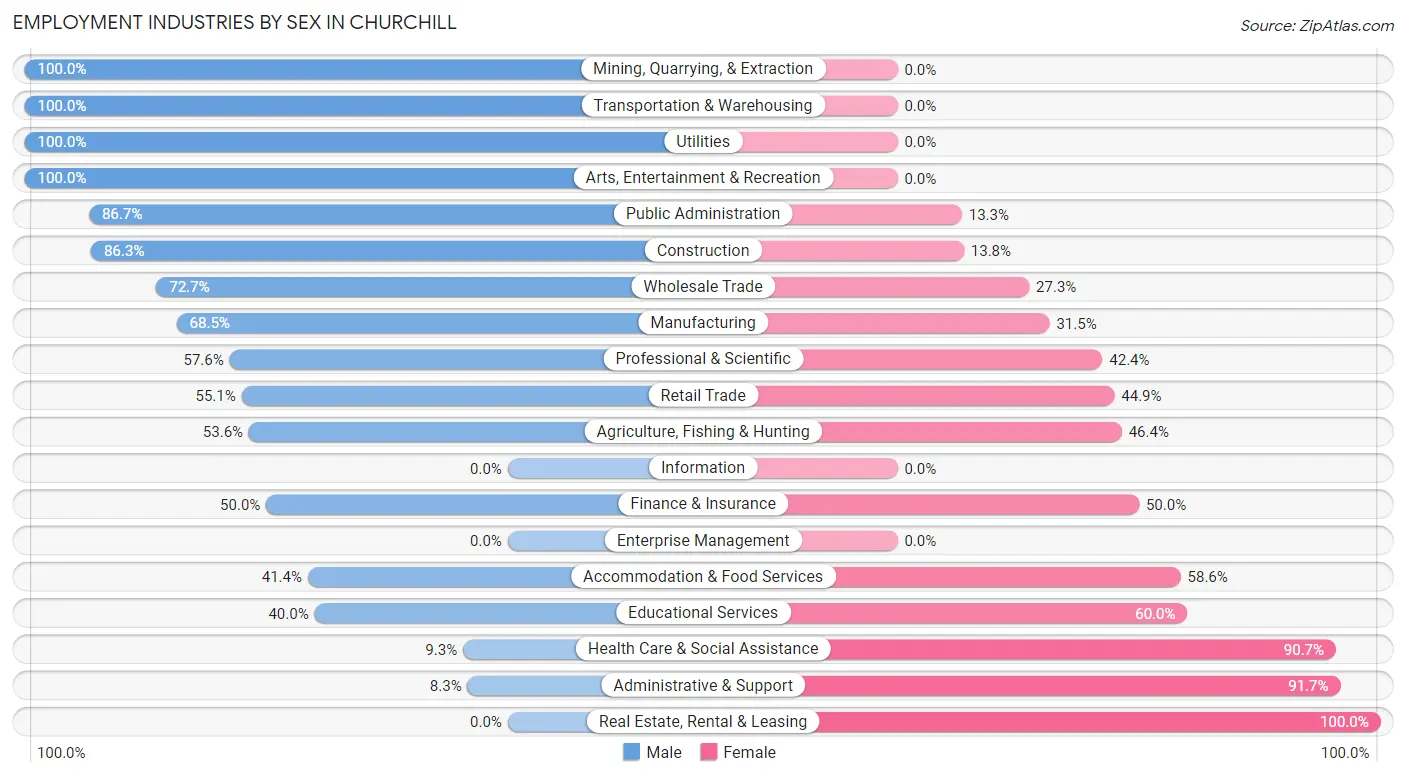
Employment Industries by Sex in Churchill
The Churchill industries that see more men than women are Mining, Quarrying, & Extraction (100.0%), Transportation & Warehousing (100.0%), and Utilities (100.0%), whereas the industries that tend to have a higher number of women are Real Estate, Rental & Leasing (100.0%), Administrative & Support (91.7%), and Health Care & Social Assistance (90.7%).
| Industry | Male | Female |
| Agriculture, Fishing & Hunting | 15 (53.6%) | 13 (46.4%) |
| Mining, Quarrying, & Extraction | 6 (100.0%) | 0 (0.0%) |
| Construction | 69 (86.3%) | 11 (13.8%) |
| Manufacturing | 37 (68.5%) | 17 (31.5%) |
| Wholesale Trade | 8 (72.7%) | 3 (27.3%) |
| Retail Trade | 27 (55.1%) | 22 (44.9%) |
| Transportation & Warehousing | 18 (100.0%) | 0 (0.0%) |
| Utilities | 3 (100.0%) | 0 (0.0%) |
| Information | 0 (0.0%) | 0 (0.0%) |
| Finance & Insurance | 13 (50.0%) | 13 (50.0%) |
| Real Estate, Rental & Leasing | 0 (0.0%) | 4 (100.0%) |
| Professional & Scientific | 19 (57.6%) | 14 (42.4%) |
| Enterprise Management | 0 (0.0%) | 0 (0.0%) |
| Administrative & Support | 2 (8.3%) | 22 (91.7%) |
| Educational Services | 24 (40.0%) | 36 (60.0%) |
| Health Care & Social Assistance | 5 (9.3%) | 49 (90.7%) |
| Arts, Entertainment & Recreation | 20 (100.0%) | 0 (0.0%) |
| Accommodation & Food Services | 12 (41.4%) | 17 (58.6%) |
| Public Administration | 13 (86.7%) | 2 (13.3%) |
| Total | 291 (54.1%) | 247 (45.9%) |
Education in Churchill
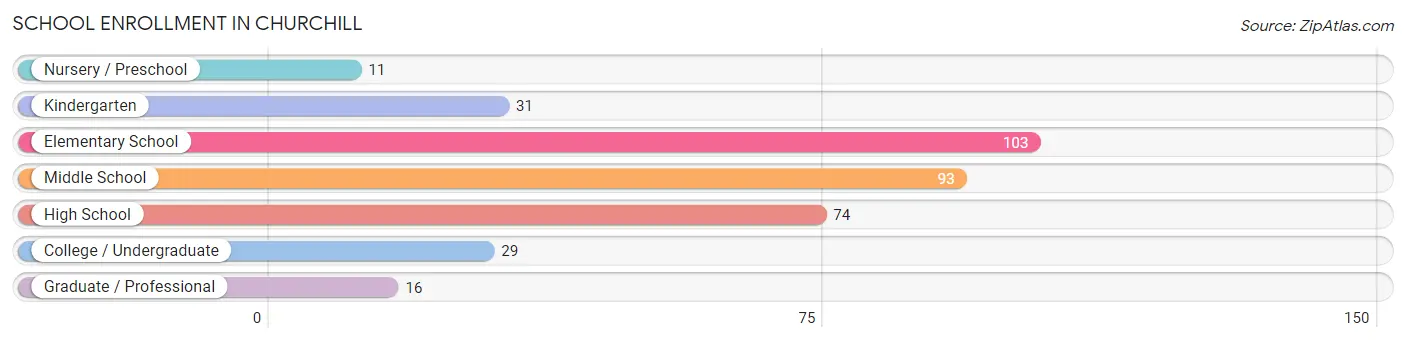
School Enrollment in Churchill
The most common levels of schooling among the 357 students in Churchill are elementary school (103 | 28.8%), middle school (93 | 26.1%), and high school (74 | 20.7%).
| School Level | # Students | % Students |
| Nursery / Preschool | 11 | 3.1% |
| Kindergarten | 31 | 8.7% |
| Elementary School | 103 | 28.8% |
| Middle School | 93 | 26.1% |
| High School | 74 | 20.7% |
| College / Undergraduate | 29 | 8.1% |
| Graduate / Professional | 16 | 4.5% |
| Total | 357 | 100.0% |
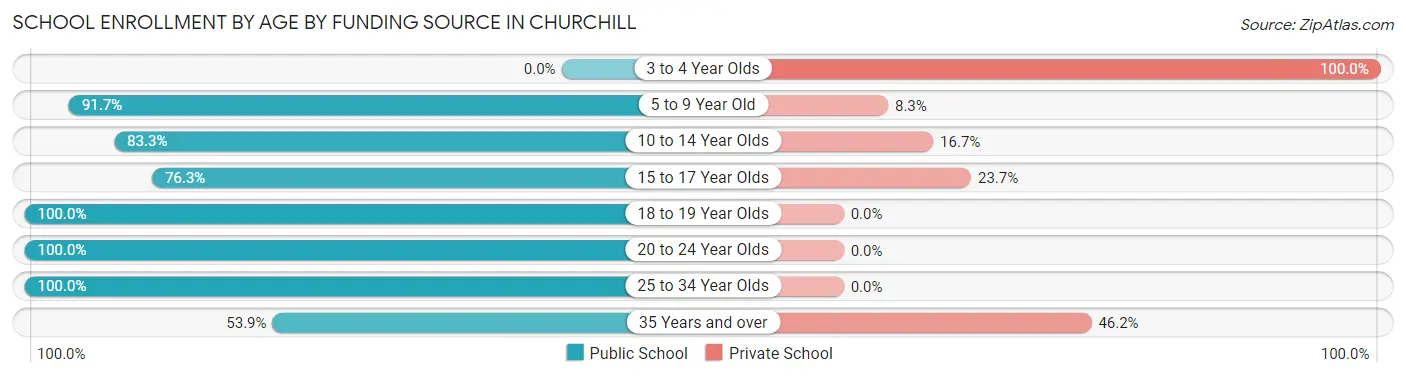
School Enrollment by Age by Funding Source in Churchill
Out of a total of 357 students who are enrolled in schools in Churchill, 60 (16.8%) attend a private institution, while the remaining 297 (83.2%) are enrolled in public schools. The age group of 3 to 4 year olds has the highest likelihood of being enrolled in private schools, with 7 (100.0% in the age bracket) enrolled. Conversely, the age group of 18 to 19 year olds has the lowest likelihood of being enrolled in a private school, with 12 (100.0% in the age bracket) attending a public institution.
| Age Bracket | Public School | Private School |
| 3 to 4 Year Olds | 0 (0.0%) | 7 (100.0%) |
| 5 to 9 Year Old | 111 (91.7%) | 10 (8.3%) |
| 10 to 14 Year Olds | 85 (83.3%) | 17 (16.7%) |
| 15 to 17 Year Olds | 45 (76.3%) | 14 (23.7%) |
| 18 to 19 Year Olds | 12 (100.0%) | 0 (0.0%) |
| 20 to 24 Year Olds | 28 (100.0%) | 0 (0.0%) |
| 25 to 34 Year Olds | 2 (100.0%) | 0 (0.0%) |
| 35 Years and over | 14 (53.8%) | 12 (46.2%) |
| Total | 297 (83.2%) | 60 (16.8%) |
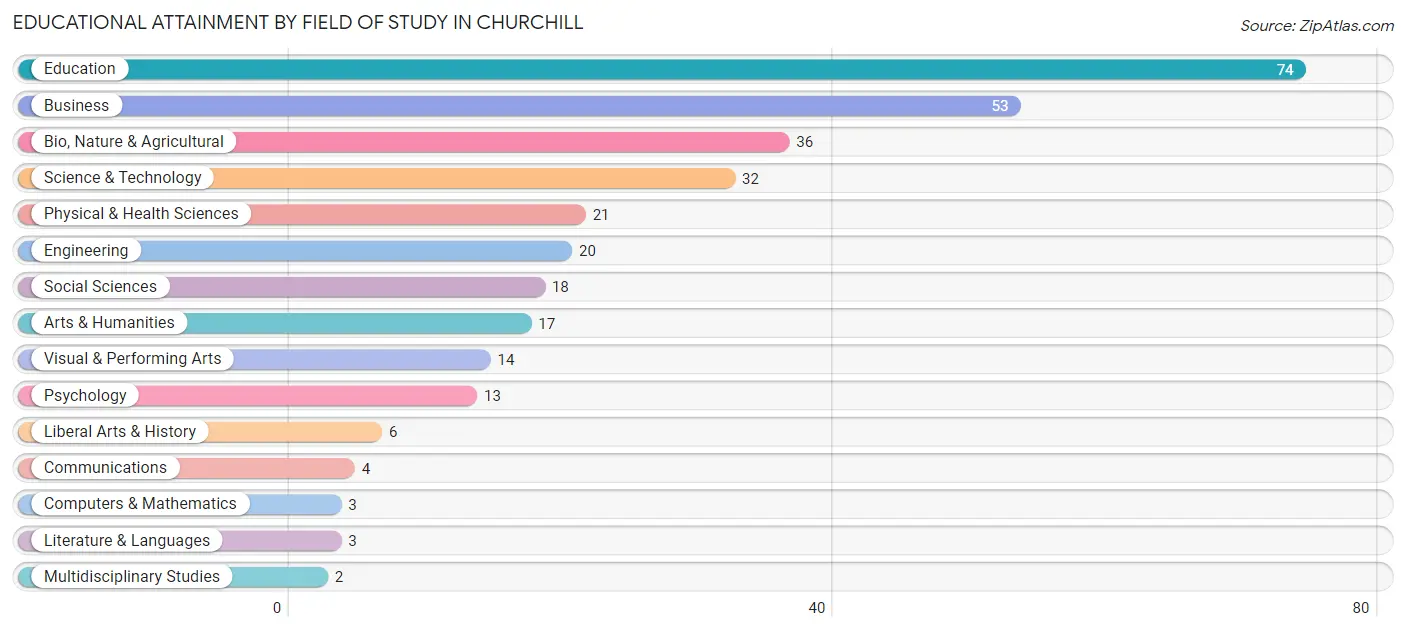
Educational Attainment by Field of Study in Churchill
Education (74 | 23.4%), business (53 | 16.8%), bio, nature & agricultural (36 | 11.4%), science & technology (32 | 10.1%), and physical & health sciences (21 | 6.7%) are the most common fields of study among 316 individuals in Churchill who have obtained a bachelor's degree or higher.
| Field of Study | # Graduates | % Graduates |
| Computers & Mathematics | 3 | 0.9% |
| Bio, Nature & Agricultural | 36 | 11.4% |
| Physical & Health Sciences | 21 | 6.7% |
| Psychology | 13 | 4.1% |
| Social Sciences | 18 | 5.7% |
| Engineering | 20 | 6.3% |
| Multidisciplinary Studies | 2 | 0.6% |
| Science & Technology | 32 | 10.1% |
| Business | 53 | 16.8% |
| Education | 74 | 23.4% |
| Literature & Languages | 3 | 0.9% |
| Liberal Arts & History | 6 | 1.9% |
| Visual & Performing Arts | 14 | 4.4% |
| Communications | 4 | 1.3% |
| Arts & Humanities | 17 | 5.4% |
| Total | 316 | 100.0% |
Transportation & Commute in Churchill
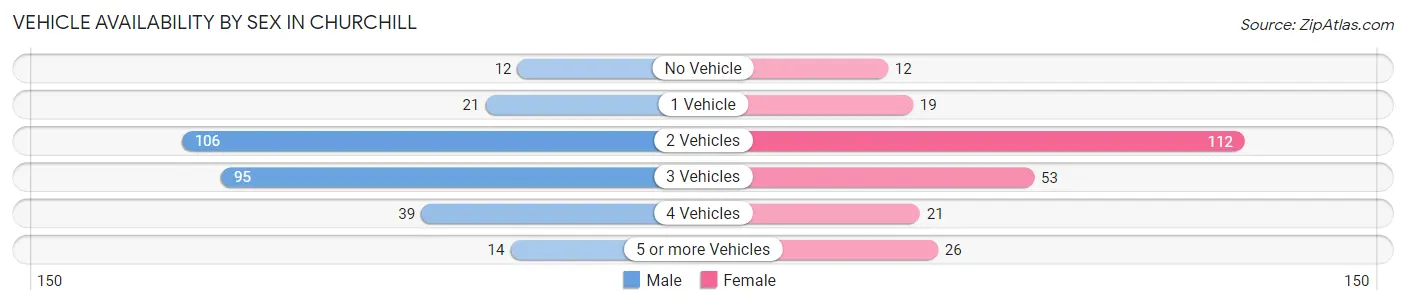
Vehicle Availability by Sex in Churchill
The most prevalent vehicle ownership categories in Churchill are males with 2 vehicles (106, accounting for 36.9%) and females with 2 vehicles (112, making up 43.6%).
| Vehicles Available | Male | Female |
| No Vehicle | 12 (4.2%) | 12 (4.9%) |
| 1 Vehicle | 21 (7.3%) | 19 (7.8%) |
| 2 Vehicles | 106 (36.9%) | 112 (46.1%) |
| 3 Vehicles | 95 (33.1%) | 53 (21.8%) |
| 4 Vehicles | 39 (13.6%) | 21 (8.6%) |
| 5 or more Vehicles | 14 (4.9%) | 26 (10.7%) |
| Total | 287 (100.0%) | 243 (100.0%) |
Commute Time in Churchill
The most frequently occuring commute durations in Churchill are 15 to 19 minutes (105 commuters, 21.9%), 20 to 24 minutes (84 commuters, 17.5%), and 30 to 34 minutes (67 commuters, 14.0%).
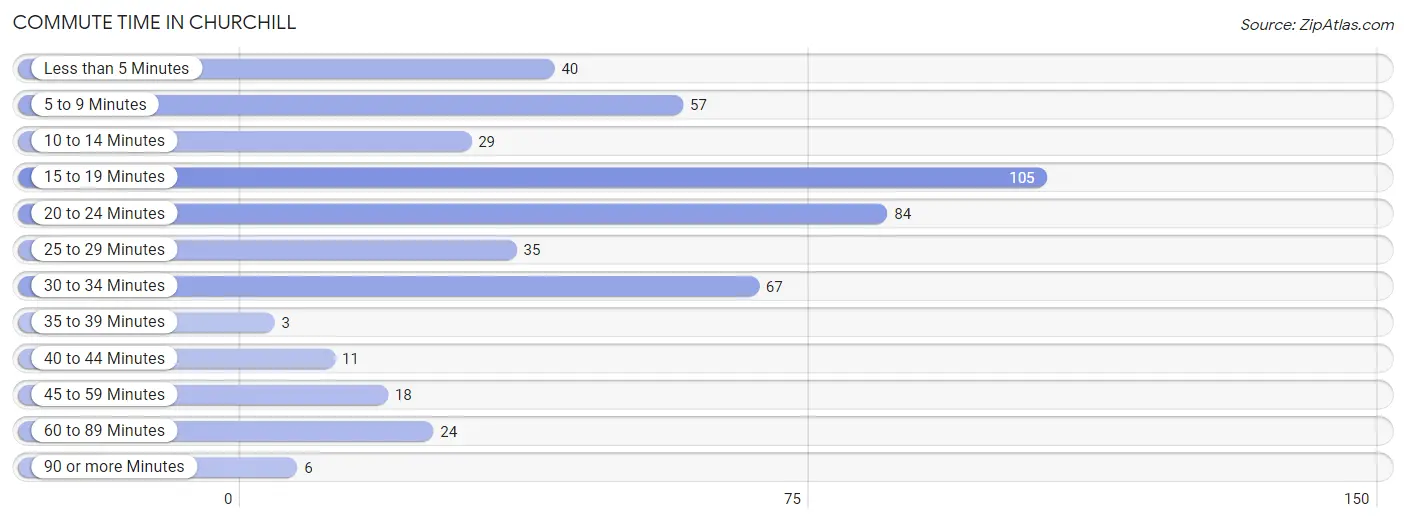
| Commute Time | # Commuters | % Commuters |
| Less than 5 Minutes | 40 | 8.4% |
| 5 to 9 Minutes | 57 | 11.9% |
| 10 to 14 Minutes | 29 | 6.0% |
| 15 to 19 Minutes | 105 | 21.9% |
| 20 to 24 Minutes | 84 | 17.5% |
| 25 to 29 Minutes | 35 | 7.3% |
| 30 to 34 Minutes | 67 | 14.0% |
| 35 to 39 Minutes | 3 | 0.6% |
| 40 to 44 Minutes | 11 | 2.3% |
| 45 to 59 Minutes | 18 | 3.8% |
| 60 to 89 Minutes | 24 | 5.0% |
| 90 or more Minutes | 6 | 1.3% |
Commute Time by Sex in Churchill
The most common commute times in Churchill are 15 to 19 minutes (60 commuters, 22.6%) for males and 20 to 24 minutes (52 commuters, 24.4%) for females.
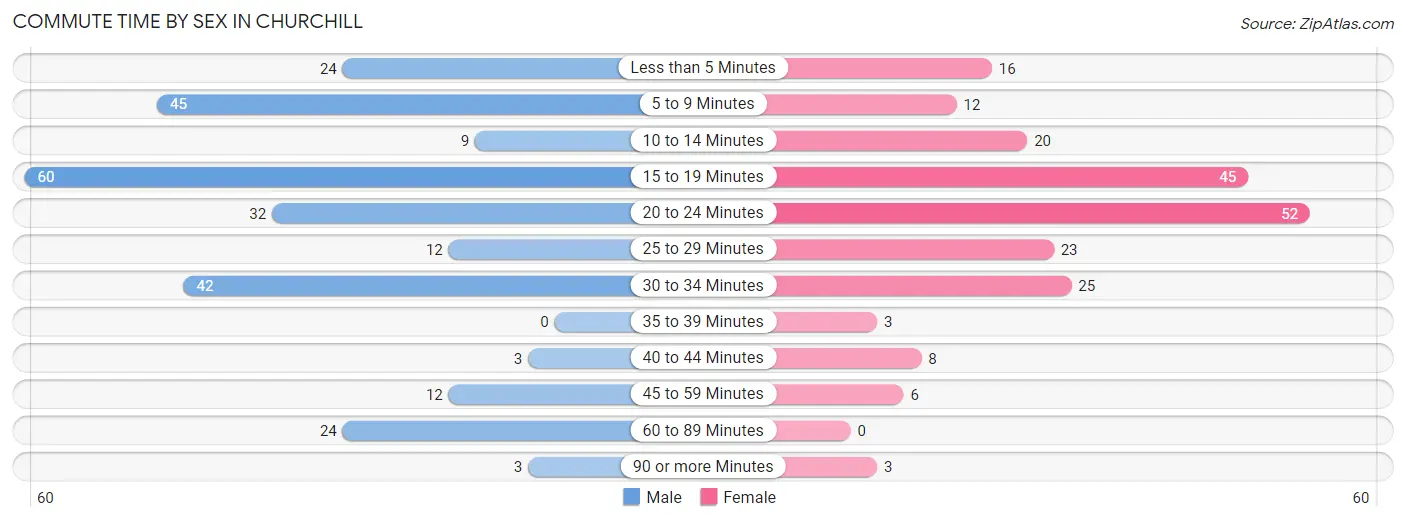
| Commute Time | Male | Female |
| Less than 5 Minutes | 24 (9.0%) | 16 (7.5%) |
| 5 to 9 Minutes | 45 (16.9%) | 12 (5.6%) |
| 10 to 14 Minutes | 9 (3.4%) | 20 (9.4%) |
| 15 to 19 Minutes | 60 (22.6%) | 45 (21.1%) |
| 20 to 24 Minutes | 32 (12.0%) | 52 (24.4%) |
| 25 to 29 Minutes | 12 (4.5%) | 23 (10.8%) |
| 30 to 34 Minutes | 42 (15.8%) | 25 (11.7%) |
| 35 to 39 Minutes | 0 (0.0%) | 3 (1.4%) |
| 40 to 44 Minutes | 3 (1.1%) | 8 (3.8%) |
| 45 to 59 Minutes | 12 (4.5%) | 6 (2.8%) |
| 60 to 89 Minutes | 24 (9.0%) | 0 (0.0%) |
| 90 or more Minutes | 3 (1.1%) | 3 (1.4%) |
Time of Departure to Work by Sex in Churchill
The most frequent times of departure to work in Churchill are 7:30 AM to 7:59 AM (56, 21.0%) for males and 7:30 AM to 7:59 AM (42, 19.7%) for females.
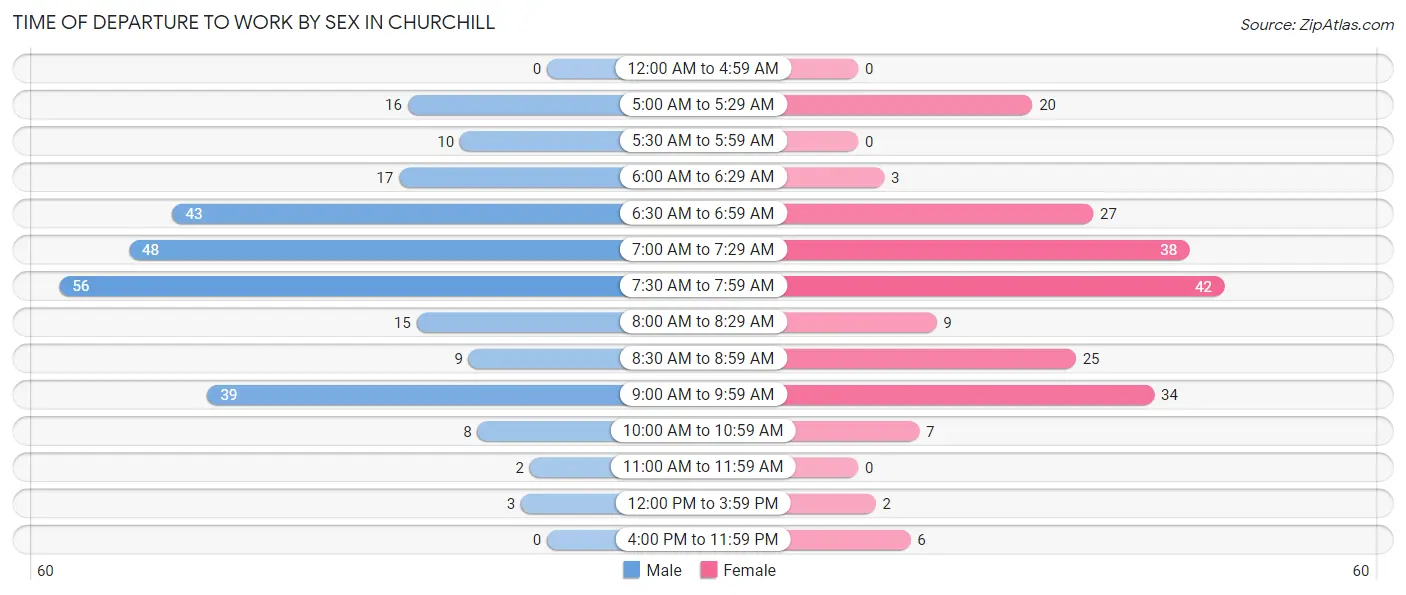
| Time of Departure | Male | Female |
| 12:00 AM to 4:59 AM | 0 (0.0%) | 0 (0.0%) |
| 5:00 AM to 5:29 AM | 16 (6.0%) | 20 (9.4%) |
| 5:30 AM to 5:59 AM | 10 (3.8%) | 0 (0.0%) |
| 6:00 AM to 6:29 AM | 17 (6.4%) | 3 (1.4%) |
| 6:30 AM to 6:59 AM | 43 (16.2%) | 27 (12.7%) |
| 7:00 AM to 7:29 AM | 48 (18.0%) | 38 (17.8%) |
| 7:30 AM to 7:59 AM | 56 (21.0%) | 42 (19.7%) |
| 8:00 AM to 8:29 AM | 15 (5.6%) | 9 (4.2%) |
| 8:30 AM to 8:59 AM | 9 (3.4%) | 25 (11.7%) |
| 9:00 AM to 9:59 AM | 39 (14.7%) | 34 (16.0%) |
| 10:00 AM to 10:59 AM | 8 (3.0%) | 7 (3.3%) |
| 11:00 AM to 11:59 AM | 2 (0.7%) | 0 (0.0%) |
| 12:00 PM to 3:59 PM | 3 (1.1%) | 2 (0.9%) |
| 4:00 PM to 11:59 PM | 0 (0.0%) | 6 (2.8%) |
| Total | 266 (100.0%) | 213 (100.0%) |
Housing Occupancy in Churchill
Occupancy by Ownership in Churchill
Of the total 377 dwellings in Churchill, owner-occupied units account for 298 (79.0%), while renter-occupied units make up 79 (20.9%).
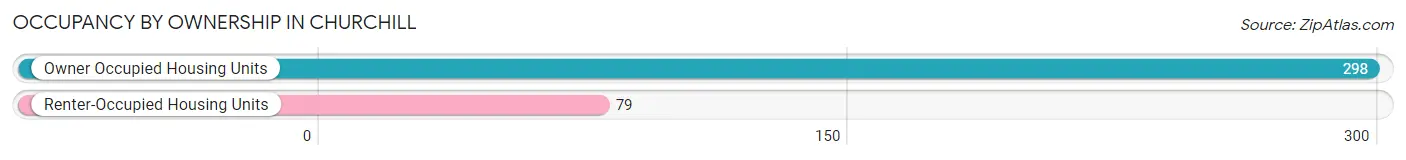
| Occupancy | # Housing Units | % Housing Units |
| Owner Occupied Housing Units | 298 | 79.0% |
| Renter-Occupied Housing Units | 79 | 20.9% |
| Total Occupied Housing Units | 377 | 100.0% |
Occupancy by Household Size in Churchill
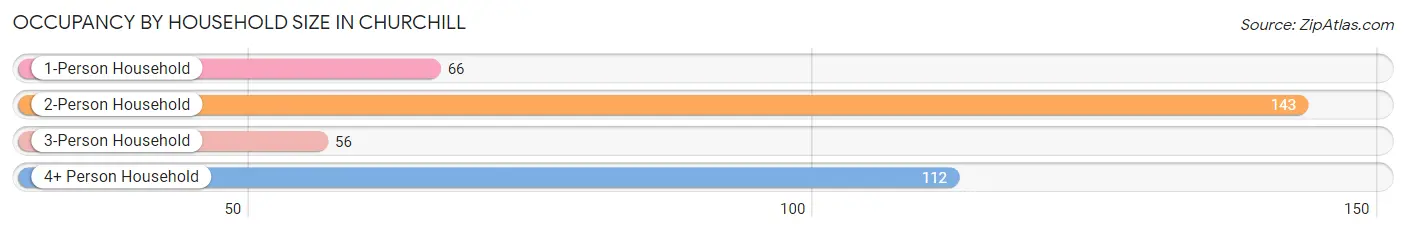
| Household Size | # Housing Units | % Housing Units |
| 1-Person Household | 66 | 17.5% |
| 2-Person Household | 143 | 37.9% |
| 3-Person Household | 56 | 14.8% |
| 4+ Person Household | 112 | 29.7% |
| Total Housing Units | 377 | 100.0% |
Occupancy by Ownership by Household Size in Churchill
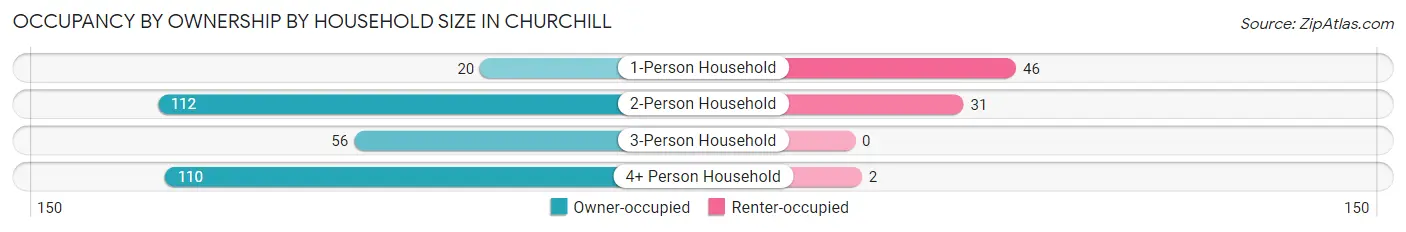
| Household Size | Owner-occupied | Renter-occupied |
| 1-Person Household | 20 (30.3%) | 46 (69.7%) |
| 2-Person Household | 112 (78.3%) | 31 (21.7%) |
| 3-Person Household | 56 (100.0%) | 0 (0.0%) |
| 4+ Person Household | 110 (98.2%) | 2 (1.8%) |
| Total Housing Units | 298 (79.0%) | 79 (20.9%) |
Occupancy by Educational Attainment in Churchill
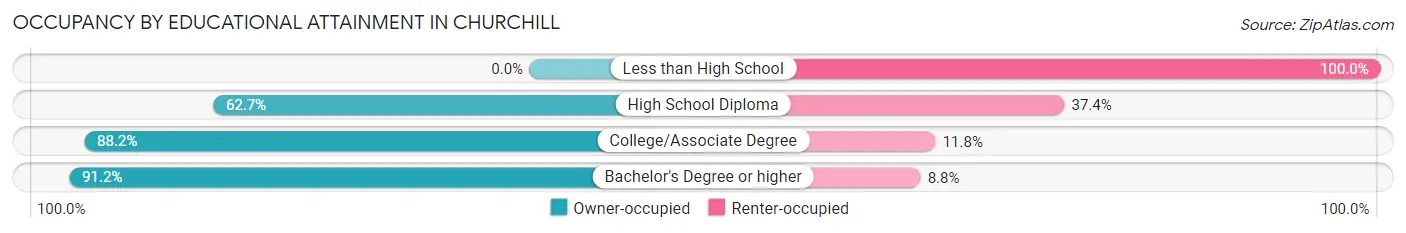
| Household Size | Owner-occupied | Renter-occupied |
| Less than High School | 0 (0.0%) | 20 (100.0%) |
| High School Diploma | 52 (62.6%) | 31 (37.3%) |
| College/Associate Degree | 112 (88.2%) | 15 (11.8%) |
| Bachelor's Degree or higher | 134 (91.2%) | 13 (8.8%) |
Occupancy by Age of Householder in Churchill
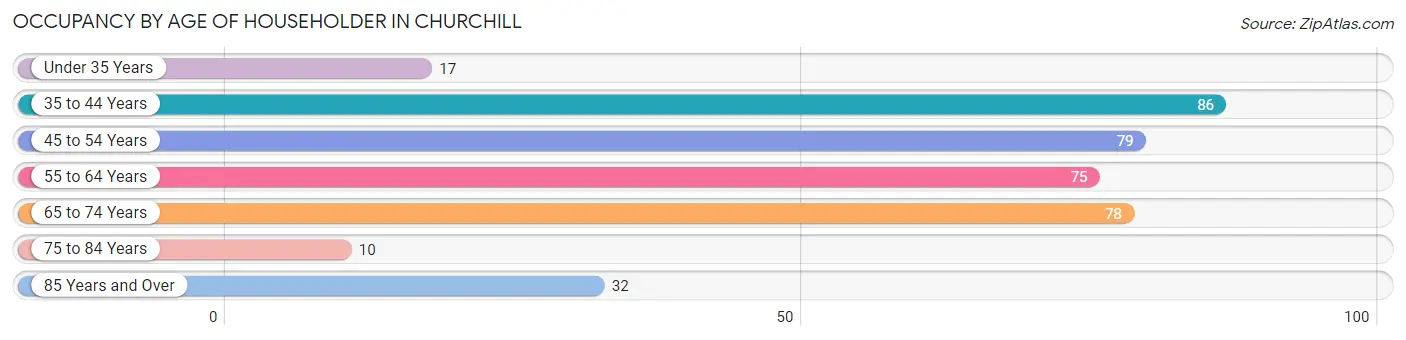
| Age Bracket | # Households | % Households |
| Under 35 Years | 17 | 4.5% |
| 35 to 44 Years | 86 | 22.8% |
| 45 to 54 Years | 79 | 20.9% |
| 55 to 64 Years | 75 | 19.9% |
| 65 to 74 Years | 78 | 20.7% |
| 75 to 84 Years | 10 | 2.6% |
| 85 Years and Over | 32 | 8.5% |
| Total | 377 | 100.0% |
Housing Finances in Churchill
Median Income by Occupancy in Churchill
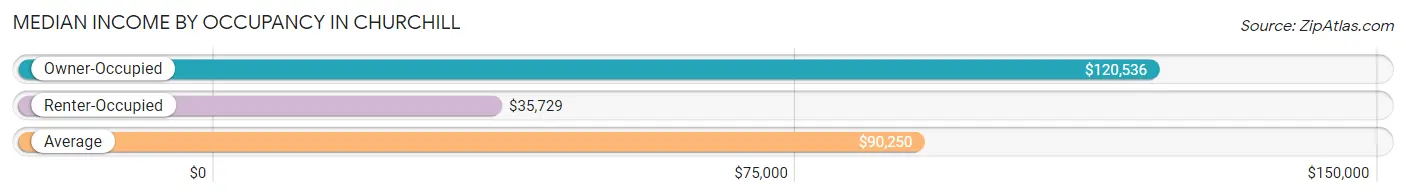
| Occupancy Type | # Households | Median Income |
| Owner-Occupied | 298 (79.0%) | $120,536 |
| Renter-Occupied | 79 (20.9%) | $35,729 |
| Average | 377 (100.0%) | $90,250 |
Occupancy by Householder Income Bracket in Churchill
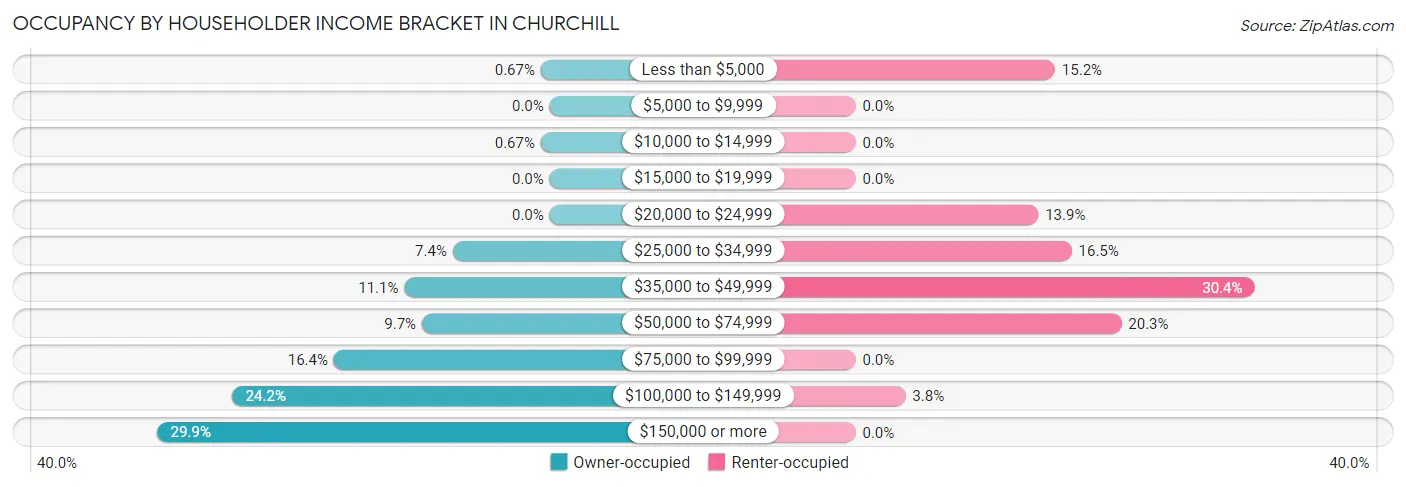
| Income Bracket | Owner-occupied | Renter-occupied |
| Less than $5,000 | 2 (0.7%) | 12 (15.2%) |
| $5,000 to $9,999 | 0 (0.0%) | 0 (0.0%) |
| $10,000 to $14,999 | 2 (0.7%) | 0 (0.0%) |
| $15,000 to $19,999 | 0 (0.0%) | 0 (0.0%) |
| $20,000 to $24,999 | 0 (0.0%) | 11 (13.9%) |
| $25,000 to $34,999 | 22 (7.4%) | 13 (16.5%) |
| $35,000 to $49,999 | 33 (11.1%) | 24 (30.4%) |
| $50,000 to $74,999 | 29 (9.7%) | 16 (20.3%) |
| $75,000 to $99,999 | 49 (16.4%) | 0 (0.0%) |
| $100,000 to $149,999 | 72 (24.2%) | 3 (3.8%) |
| $150,000 or more | 89 (29.9%) | 0 (0.0%) |
| Total | 298 (100.0%) | 79 (100.0%) |
Monthly Housing Cost Tiers in Churchill
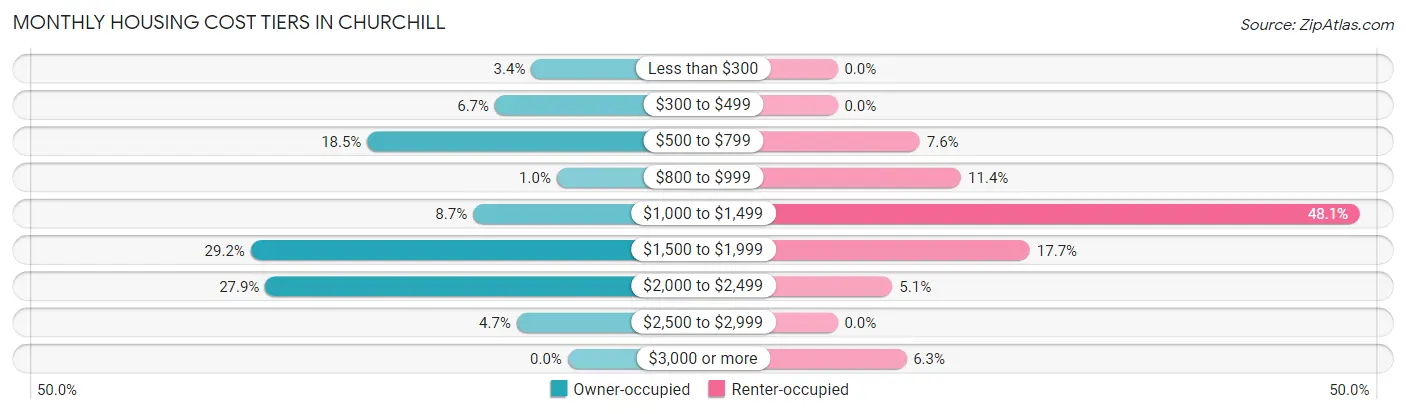
| Monthly Cost | Owner-occupied | Renter-occupied |
| Less than $300 | 10 (3.4%) | 0 (0.0%) |
| $300 to $499 | 20 (6.7%) | 0 (0.0%) |
| $500 to $799 | 55 (18.5%) | 6 (7.6%) |
| $800 to $999 | 3 (1.0%) | 9 (11.4%) |
| $1,000 to $1,499 | 26 (8.7%) | 38 (48.1%) |
| $1,500 to $1,999 | 87 (29.2%) | 14 (17.7%) |
| $2,000 to $2,499 | 83 (27.9%) | 4 (5.1%) |
| $2,500 to $2,999 | 14 (4.7%) | 0 (0.0%) |
| $3,000 or more | 0 (0.0%) | 5 (6.3%) |
| Total | 298 (100.0%) | 79 (100.0%) |
Physical Housing Characteristics in Churchill
Housing Structures in Churchill
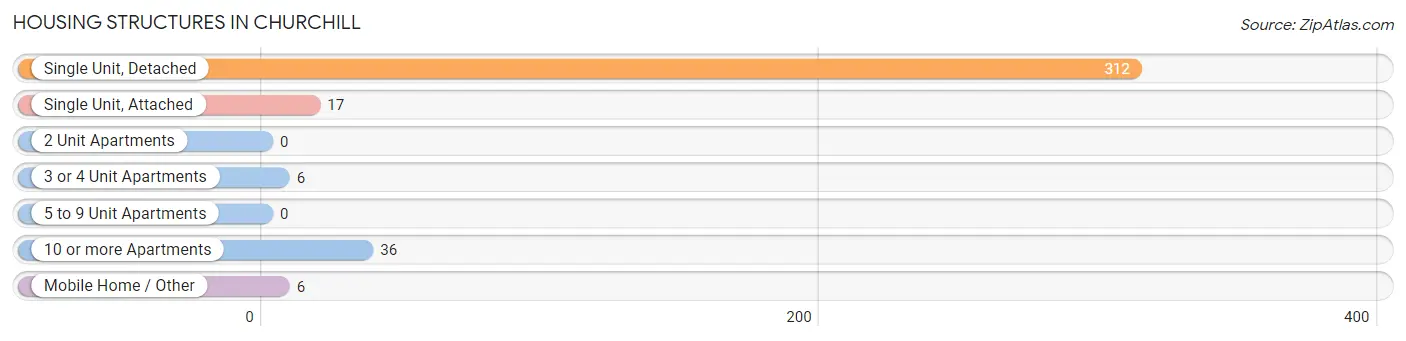
| Structure Type | # Housing Units | % Housing Units |
| Single Unit, Detached | 312 | 82.8% |
| Single Unit, Attached | 17 | 4.5% |
| 2 Unit Apartments | 0 | 0.0% |
| 3 or 4 Unit Apartments | 6 | 1.6% |
| 5 to 9 Unit Apartments | 0 | 0.0% |
| 10 or more Apartments | 36 | 9.6% |
| Mobile Home / Other | 6 | 1.6% |
| Total | 377 | 100.0% |
Housing Structures by Occupancy in Churchill
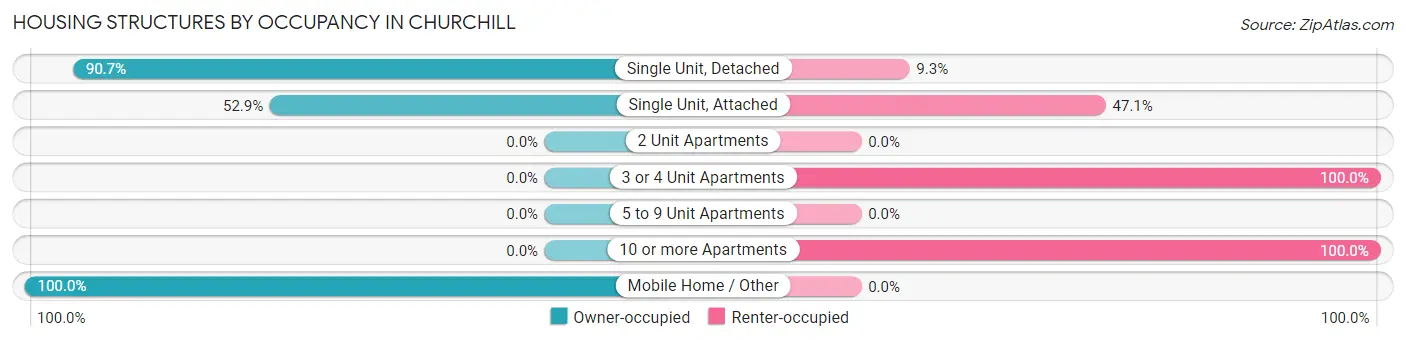
| Structure Type | Owner-occupied | Renter-occupied |
| Single Unit, Detached | 283 (90.7%) | 29 (9.3%) |
| Single Unit, Attached | 9 (52.9%) | 8 (47.1%) |
| 2 Unit Apartments | 0 (0.0%) | 0 (0.0%) |
| 3 or 4 Unit Apartments | 0 (0.0%) | 6 (100.0%) |
| 5 to 9 Unit Apartments | 0 (0.0%) | 0 (0.0%) |
| 10 or more Apartments | 0 (0.0%) | 36 (100.0%) |
| Mobile Home / Other | 6 (100.0%) | 0 (0.0%) |
| Total | 298 (79.0%) | 79 (20.9%) |
Housing Structures by Number of Rooms in Churchill
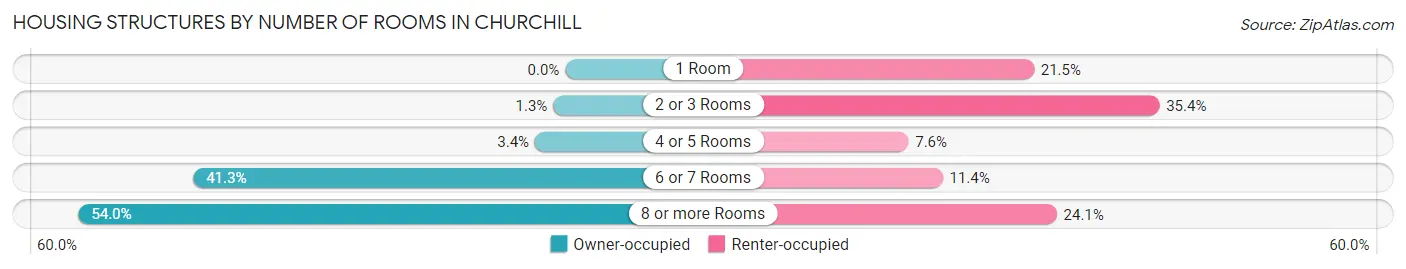
| Number of Rooms | Owner-occupied | Renter-occupied |
| 1 Room | 0 (0.0%) | 17 (21.5%) |
| 2 or 3 Rooms | 4 (1.3%) | 28 (35.4%) |
| 4 or 5 Rooms | 10 (3.4%) | 6 (7.6%) |
| 6 or 7 Rooms | 123 (41.3%) | 9 (11.4%) |
| 8 or more Rooms | 161 (54.0%) | 19 (24.0%) |
| Total | 298 (100.0%) | 79 (100.0%) |
Housing Structure by Heating Type in Churchill
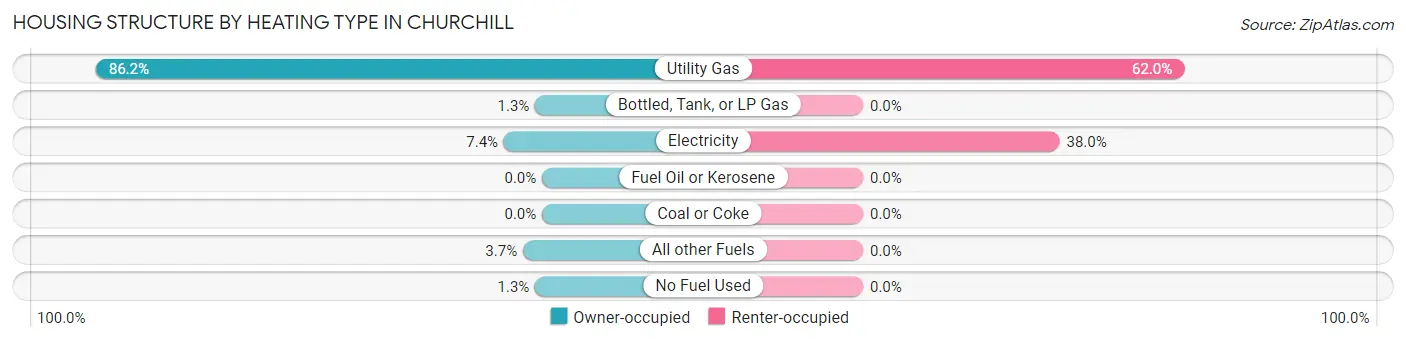
| Heating Type | Owner-occupied | Renter-occupied |
| Utility Gas | 257 (86.2%) | 49 (62.0%) |
| Bottled, Tank, or LP Gas | 4 (1.3%) | 0 (0.0%) |
| Electricity | 22 (7.4%) | 30 (38.0%) |
| Fuel Oil or Kerosene | 0 (0.0%) | 0 (0.0%) |
| Coal or Coke | 0 (0.0%) | 0 (0.0%) |
| All other Fuels | 11 (3.7%) | 0 (0.0%) |
| No Fuel Used | 4 (1.3%) | 0 (0.0%) |
| Total | 298 (100.0%) | 79 (100.0%) |
Household Vehicle Usage in Churchill
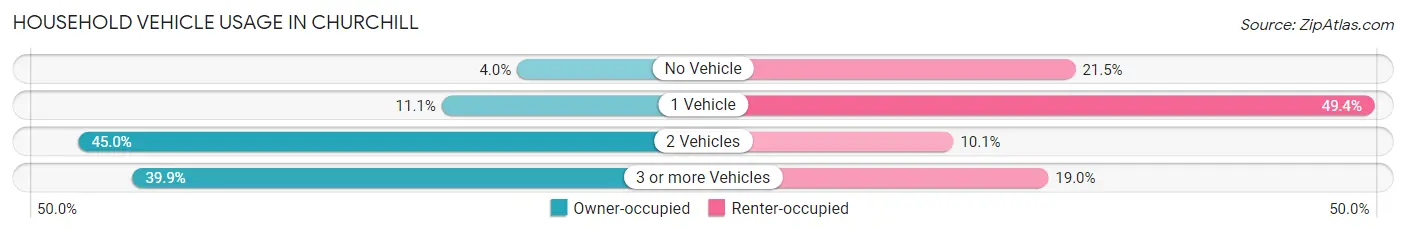
| Vehicles per Household | Owner-occupied | Renter-occupied |
| No Vehicle | 12 (4.0%) | 17 (21.5%) |
| 1 Vehicle | 33 (11.1%) | 39 (49.4%) |
| 2 Vehicles | 134 (45.0%) | 8 (10.1%) |
| 3 or more Vehicles | 119 (39.9%) | 15 (19.0%) |
| Total | 298 (100.0%) | 79 (100.0%) |
Real Estate & Mortgages in Churchill
Real Estate and Mortgage Overview in Churchill
| Characteristic | Without Mortgage | With Mortgage |
| Housing Units | 83 | 215 |
| Median Property Value | $461,400 | $463,200 |
| Median Household Income | $113,750 | $59 |
| Monthly Housing Costs | $588 | $0 |
| Real Estate Taxes | $3,061 | $0 |
Property Value by Mortgage Status in Churchill
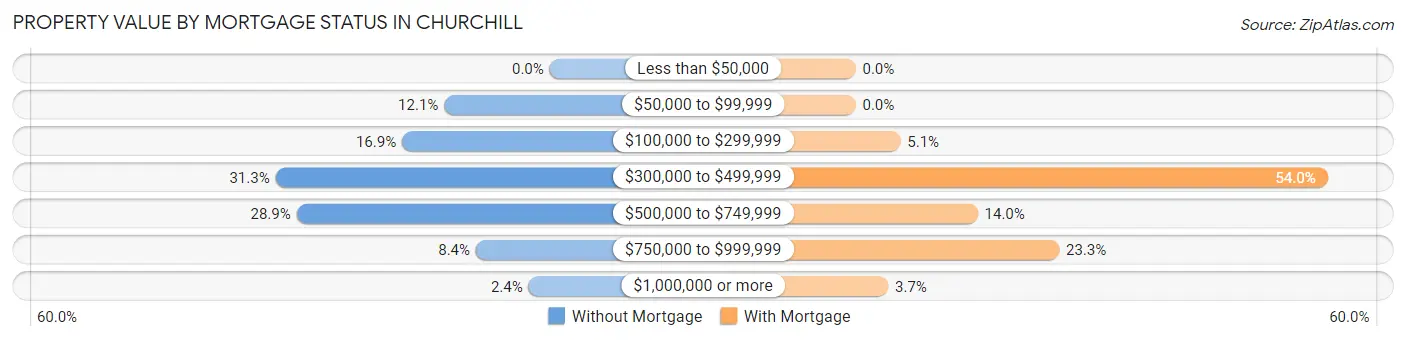
| Property Value | Without Mortgage | With Mortgage |
| Less than $50,000 | 0 (0.0%) | 0 (0.0%) |
| $50,000 to $99,999 | 10 (12.0%) | 0 (0.0%) |
| $100,000 to $299,999 | 14 (16.9%) | 11 (5.1%) |
| $300,000 to $499,999 | 26 (31.3%) | 116 (53.9%) |
| $500,000 to $749,999 | 24 (28.9%) | 30 (14.0%) |
| $750,000 to $999,999 | 7 (8.4%) | 50 (23.3%) |
| $1,000,000 or more | 2 (2.4%) | 8 (3.7%) |
| Total | 83 (100.0%) | 215 (100.0%) |
Household Income by Mortgage Status in Churchill
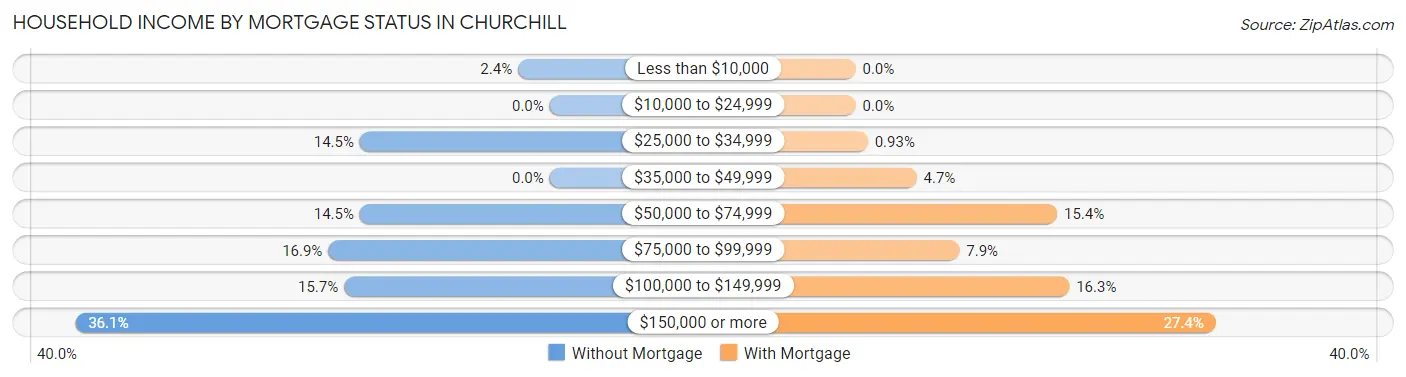
| Household Income | Without Mortgage | With Mortgage |
| Less than $10,000 | 2 (2.4%) | 0 (0.0%) |
| $10,000 to $24,999 | 0 (0.0%) | 0 (0.0%) |
| $25,000 to $34,999 | 12 (14.5%) | 2 (0.9%) |
| $35,000 to $49,999 | 0 (0.0%) | 10 (4.6%) |
| $50,000 to $74,999 | 12 (14.5%) | 33 (15.3%) |
| $75,000 to $99,999 | 14 (16.9%) | 17 (7.9%) |
| $100,000 to $149,999 | 13 (15.7%) | 35 (16.3%) |
| $150,000 or more | 30 (36.1%) | 59 (27.4%) |
| Total | 83 (100.0%) | 215 (100.0%) |
Property Value to Household Income Ratio in Churchill
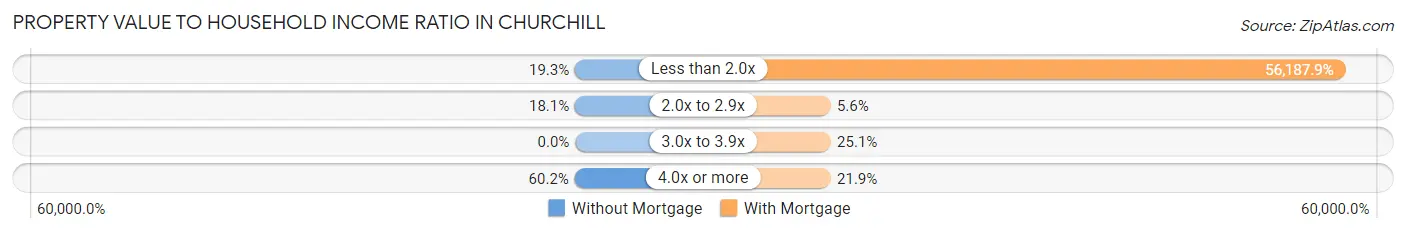
| Value-to-Income Ratio | Without Mortgage | With Mortgage |
| Less than 2.0x | 16 (19.3%) | 120,804 (56,187.9%) |
| 2.0x to 2.9x | 15 (18.1%) | 12 (5.6%) |
| 3.0x to 3.9x | 0 (0.0%) | 54 (25.1%) |
| 4.0x or more | 50 (60.2%) | 47 (21.9%) |
| Total | 83 (100.0%) | 215 (100.0%) |
Real Estate Taxes by Mortgage Status in Churchill
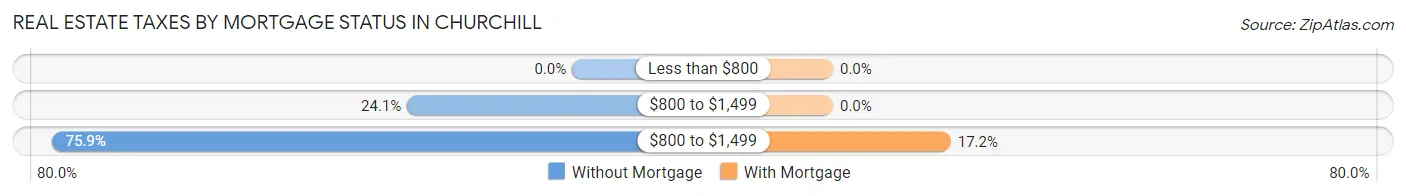
| Property Taxes | Without Mortgage | With Mortgage |
| Less than $800 | 0 (0.0%) | 0 (0.0%) |
| $800 to $1,499 | 20 (24.1%) | 0 (0.0%) |
| $800 to $1,499 | 63 (75.9%) | 37 (17.2%) |
| Total | 83 (100.0%) | 215 (100.0%) |
Health & Disability in Churchill
Health Insurance Coverage by Age in Churchill
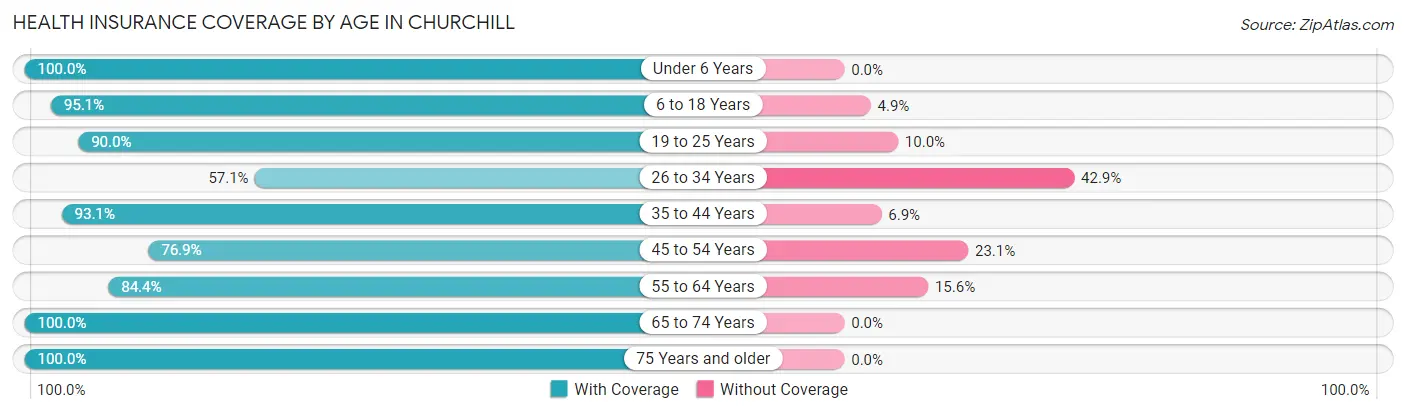
| Age Bracket | With Coverage | Without Coverage |
| Under 6 Years | 58 (100.0%) | 0 (0.0%) |
| 6 to 18 Years | 272 (95.1%) | 14 (4.9%) |
| 19 to 25 Years | 36 (90.0%) | 4 (10.0%) |
| 26 to 34 Years | 24 (57.1%) | 18 (42.9%) |
| 35 to 44 Years | 175 (93.1%) | 13 (6.9%) |
| 45 to 54 Years | 110 (76.9%) | 33 (23.1%) |
| 55 to 64 Years | 146 (84.4%) | 27 (15.6%) |
| 65 to 74 Years | 96 (100.0%) | 0 (0.0%) |
| 75 Years and older | 55 (100.0%) | 0 (0.0%) |
| Total | 972 (89.9%) | 109 (10.1%) |
Health Insurance Coverage by Citizenship Status in Churchill
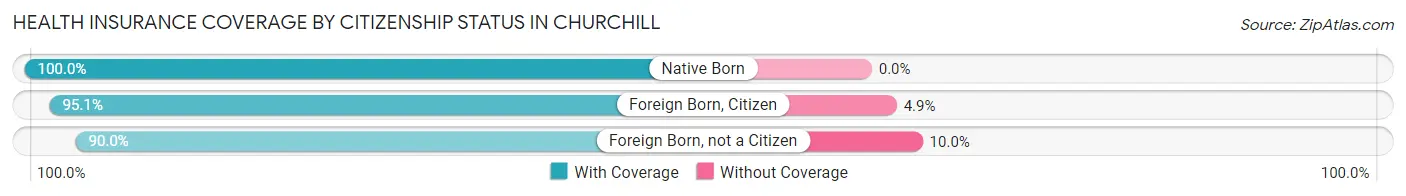
| Citizenship Status | With Coverage | Without Coverage |
| Native Born | 58 (100.0%) | 0 (0.0%) |
| Foreign Born, Citizen | 272 (95.1%) | 14 (4.9%) |
| Foreign Born, not a Citizen | 36 (90.0%) | 4 (10.0%) |
Health Insurance Coverage by Household Income in Churchill
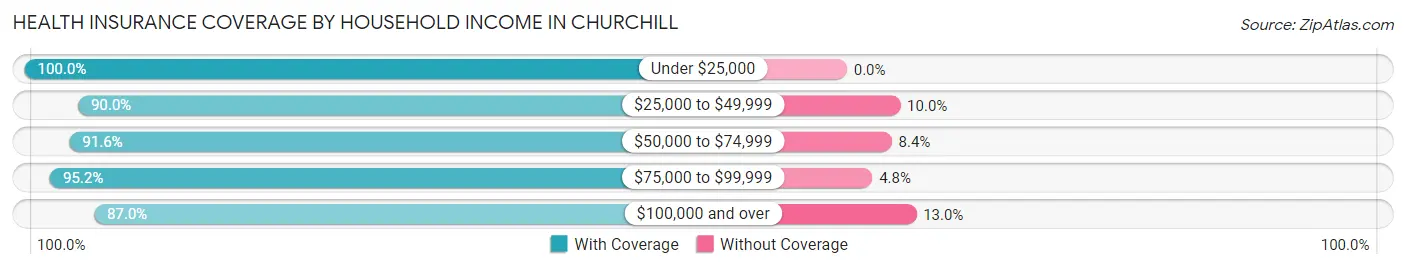
| Household Income | With Coverage | Without Coverage |
| Under $25,000 | 37 (100.0%) | 0 (0.0%) |
| $25,000 to $49,999 | 171 (90.0%) | 19 (10.0%) |
| $50,000 to $74,999 | 109 (91.6%) | 10 (8.4%) |
| $75,000 to $99,999 | 180 (95.2%) | 9 (4.8%) |
| $100,000 and over | 475 (87.0%) | 71 (13.0%) |
Public vs Private Health Insurance Coverage by Age in Churchill
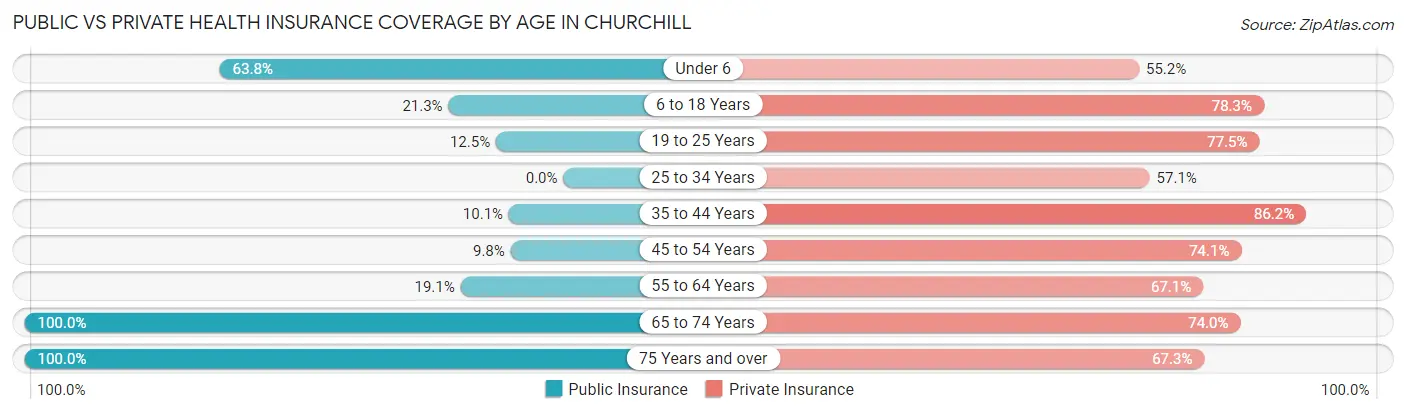
| Age Bracket | Public Insurance | Private Insurance |
| Under 6 | 37 (63.8%) | 32 (55.2%) |
| 6 to 18 Years | 61 (21.3%) | 224 (78.3%) |
| 19 to 25 Years | 5 (12.5%) | 31 (77.5%) |
| 25 to 34 Years | 0 (0.0%) | 24 (57.1%) |
| 35 to 44 Years | 19 (10.1%) | 162 (86.2%) |
| 45 to 54 Years | 14 (9.8%) | 106 (74.1%) |
| 55 to 64 Years | 33 (19.1%) | 116 (67.0%) |
| 65 to 74 Years | 96 (100.0%) | 71 (74.0%) |
| 75 Years and over | 55 (100.0%) | 37 (67.3%) |
| Total | 320 (29.6%) | 803 (74.3%) |
Disability Status by Sex by Age in Churchill
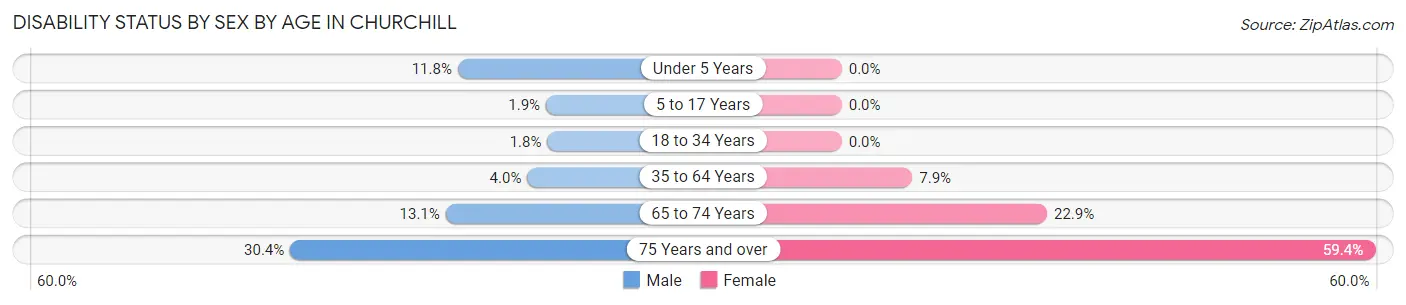
| Age Bracket | Male | Female |
| Under 5 Years | 4 (11.8%) | 0 (0.0%) |
| 5 to 17 Years | 3 (1.9%) | 0 (0.0%) |
| 18 to 34 Years | 1 (1.8%) | 0 (0.0%) |
| 35 to 64 Years | 9 (4.0%) | 22 (7.9%) |
| 65 to 74 Years | 8 (13.1%) | 8 (22.9%) |
| 75 Years and over | 7 (30.4%) | 19 (59.4%) |
Disability Class by Sex by Age in Churchill
Disability Class: Hearing Difficulty
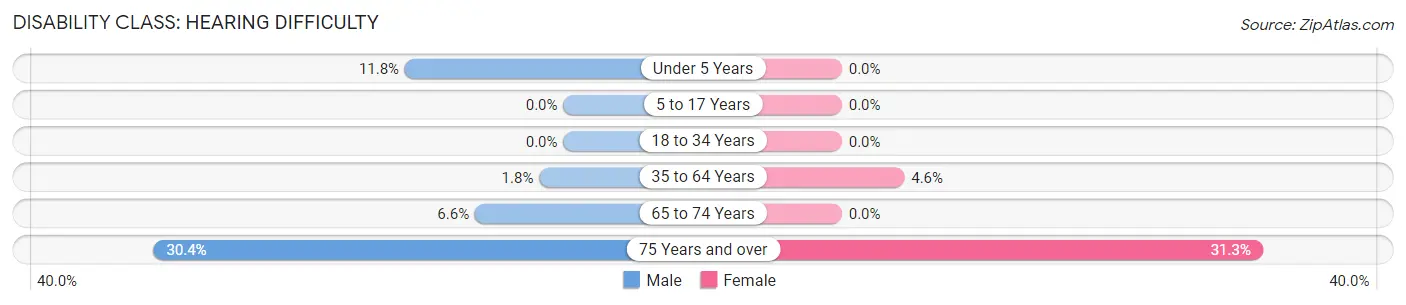
| Age Bracket | Male | Female |
| Under 5 Years | 4 (11.8%) | 0 (0.0%) |
| 5 to 17 Years | 0 (0.0%) | 0 (0.0%) |
| 18 to 34 Years | 0 (0.0%) | 0 (0.0%) |
| 35 to 64 Years | 4 (1.8%) | 13 (4.6%) |
| 65 to 74 Years | 4 (6.6%) | 0 (0.0%) |
| 75 Years and over | 7 (30.4%) | 10 (31.2%) |
Disability Class: Vision Difficulty
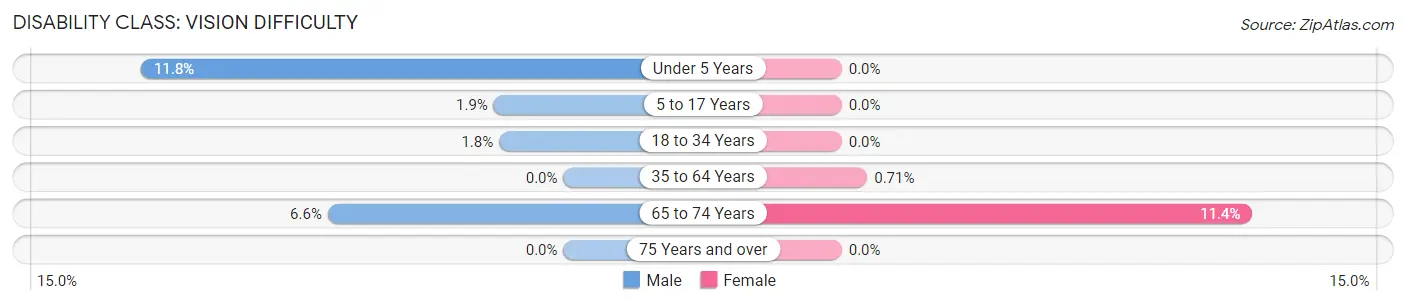
| Age Bracket | Male | Female |
| Under 5 Years | 4 (11.8%) | 0 (0.0%) |
| 5 to 17 Years | 3 (1.9%) | 0 (0.0%) |
| 18 to 34 Years | 1 (1.8%) | 0 (0.0%) |
| 35 to 64 Years | 0 (0.0%) | 2 (0.7%) |
| 65 to 74 Years | 4 (6.6%) | 4 (11.4%) |
| 75 Years and over | 0 (0.0%) | 0 (0.0%) |
Disability Class: Cognitive Difficulty
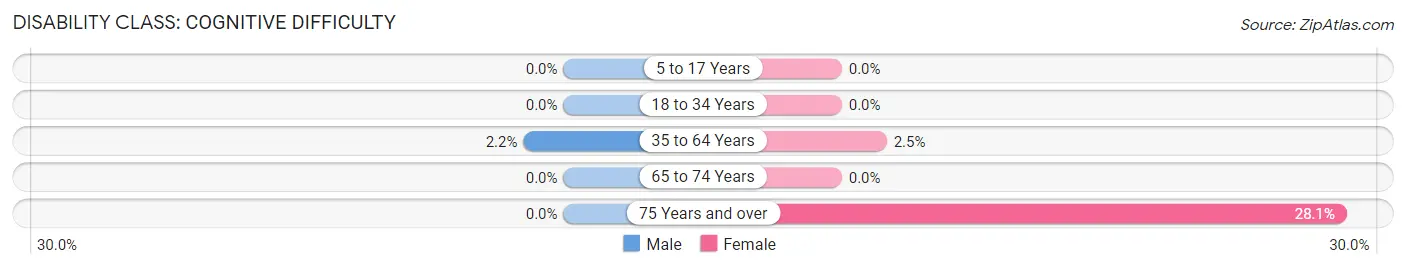
| Age Bracket | Male | Female |
| 5 to 17 Years | 0 (0.0%) | 0 (0.0%) |
| 18 to 34 Years | 0 (0.0%) | 0 (0.0%) |
| 35 to 64 Years | 5 (2.2%) | 7 (2.5%) |
| 65 to 74 Years | 0 (0.0%) | 0 (0.0%) |
| 75 Years and over | 0 (0.0%) | 9 (28.1%) |
Disability Class: Ambulatory Difficulty
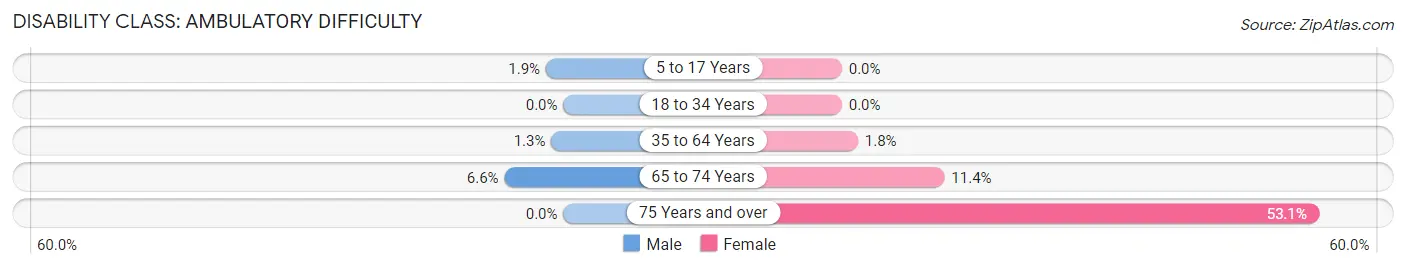
| Age Bracket | Male | Female |
| 5 to 17 Years | 3 (1.9%) | 0 (0.0%) |
| 18 to 34 Years | 0 (0.0%) | 0 (0.0%) |
| 35 to 64 Years | 3 (1.3%) | 5 (1.8%) |
| 65 to 74 Years | 4 (6.6%) | 4 (11.4%) |
| 75 Years and over | 0 (0.0%) | 17 (53.1%) |
Disability Class: Self-Care Difficulty
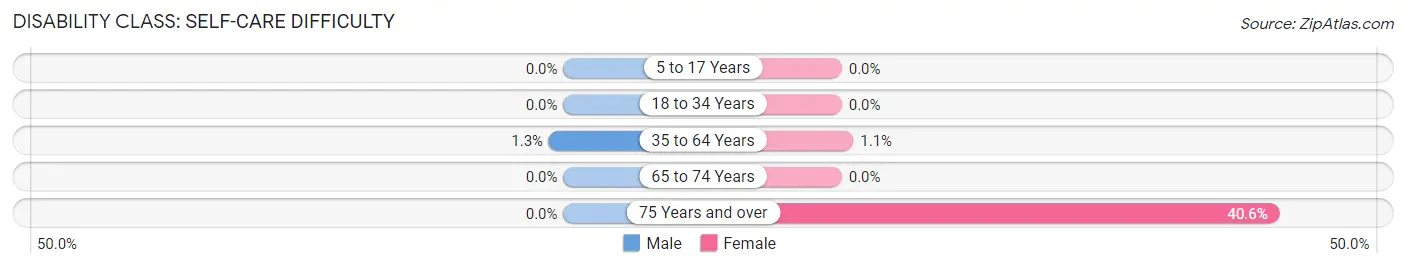
| Age Bracket | Male | Female |
| 5 to 17 Years | 0 (0.0%) | 0 (0.0%) |
| 18 to 34 Years | 0 (0.0%) | 0 (0.0%) |
| 35 to 64 Years | 3 (1.3%) | 3 (1.1%) |
| 65 to 74 Years | 0 (0.0%) | 0 (0.0%) |
| 75 Years and over | 0 (0.0%) | 13 (40.6%) |
Technology Access in Churchill
Computing Device Access in Churchill
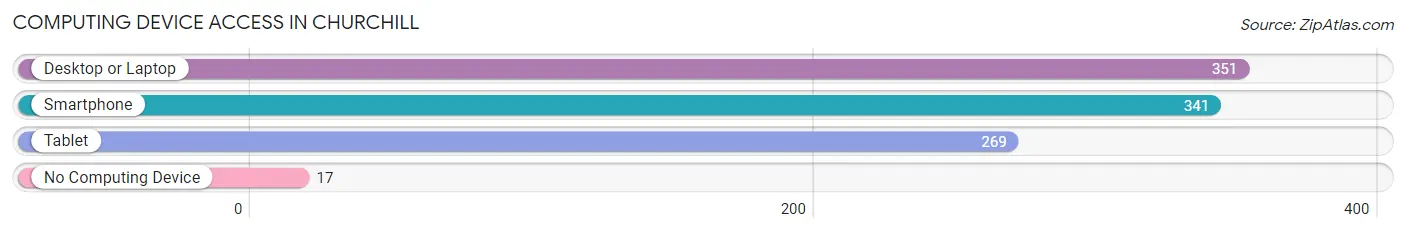
| Device Type | # Households | % Households |
| Desktop or Laptop | 351 | 93.1% |
| Smartphone | 341 | 90.4% |
| Tablet | 269 | 71.4% |
| No Computing Device | 17 | 4.5% |
| Total | 377 | 100.0% |
Internet Access in Churchill
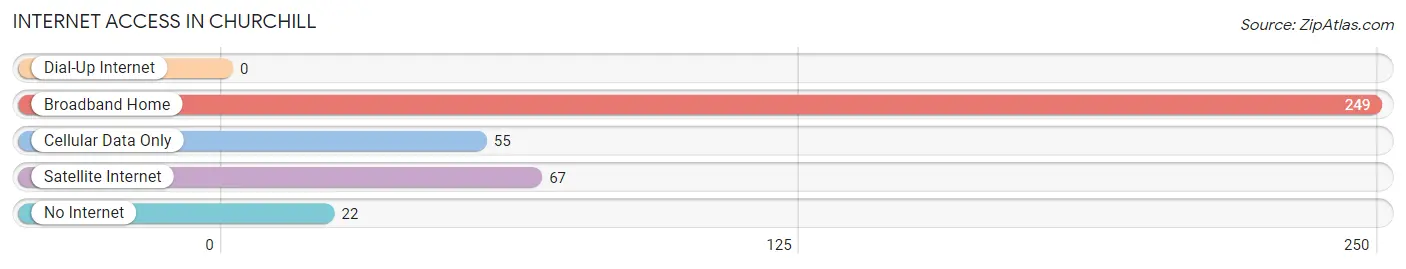
| Internet Type | # Households | % Households |
| Dial-Up Internet | 0 | 0.0% |
| Broadband Home | 249 | 66.0% |
| Cellular Data Only | 55 | 14.6% |
| Satellite Internet | 67 | 17.8% |
| No Internet | 22 | 5.8% |
| Total | 377 | 100.0% |
Churchill Summary
Churchill, Montana is a small town located in the western part of the state, near the Idaho border. It is situated in the Bitterroot Valley, a region of the Rocky Mountains known for its stunning scenery and outdoor recreation opportunities. The town has a population of just over 500 people, and is the county seat of Ravalli County.
Churchill was founded in 1883 by a group of settlers from the Midwest. The town was named after the nearby Churchill River, which was named after a local Native American chief. The town quickly grew, and by the early 1900s, it had become a bustling center of commerce and industry. The town was home to several sawmills, a flour mill, a creamery, and a number of other businesses.
Geographically, Churchill is located in the Bitterroot Valley, which is part of the Rocky Mountain range. The valley is surrounded by mountains, and the town is situated at an elevation of 4,000 feet. The climate in Churchill is generally mild, with hot summers and cold winters. The area receives an average of 20 inches of precipitation each year.
The economy of Churchill is largely based on agriculture and tourism. The town is home to several farms, which produce a variety of crops, including wheat, barley, hay, and potatoes. The town is also home to several tourist attractions, including the Bitterroot Valley Museum, the Churchill National Wildlife Refuge, and the Bitterroot River.
The demographics of Churchill are largely white, with a small percentage of Native Americans and Hispanics. The median household income in the town is $37,000, and the median home value is $150,000. The town has a low unemployment rate, and the majority of the population is employed in the agricultural and tourism industries.
Churchill is a small town with a rich history and a vibrant economy. It is a great place to live, work, and play, and offers a variety of activities and attractions for visitors and residents alike. With its stunning scenery and outdoor recreation opportunities, Churchill is a great place to call home.
Common Questions
What is the Total Population of Churchill?
Total Population of Churchill is 1,081.
What is the Total Male Population of Churchill?
Total Male Population of Churchill is 553.
What is the Total Female Population of Churchill?
Total Female Population of Churchill is 528.
What is the Ratio of Males per 100 Females in Churchill?
There are 104.73 Males per 100 Females in Churchill.
What is the Ratio of Females per 100 Males in Churchill?
There are 95.48 Females per 100 Males in Churchill.
What is the Median Population Age in Churchill?
Median Population Age in Churchill is 40.1 Years.
What is the Average Family Size in Churchill
Average Family Size in Churchill is 3.3 People.
What is the Average Household Size in Churchill
Average Household Size in Churchill is 2.9 People.
What is Per Capita Income in Churchill?
Per Capita income in Churchill is $36,968.
What is the Median Family Income in Churchill?
Median Family Income in Churchill is $114,000.
What is the Median Household income in Churchill?
Median Household Income in Churchill is $90,250.
What is Income or Wage Gap in Churchill?
Income or Wage Gap in Churchill is 43.8%.
Women in Churchill earn 56.2 cents for every dollar earned by a man.
What is Inequality or Gini Index in Churchill?
Inequality or Gini Index in Churchill is 0.39.
How Large is the Labor Force in Churchill?
There are 541 People in the Labor Forcein in Churchill.
What is the Percentage of People in the Labor Force in Churchill?
69.1% of People are in the Labor Force in Churchill.
What is the Unemployment Rate in Churchill?
Unemployment Rate in Churchill is 0.6%.