Zip Codes with the Highest Percentage of Population with a Degree in Visual and Performing Arts in Saint Louis, MO
RELATED REPORTS & OPTIONS
Visual and Performing Arts
Saint Louis
Compare Zip Codes
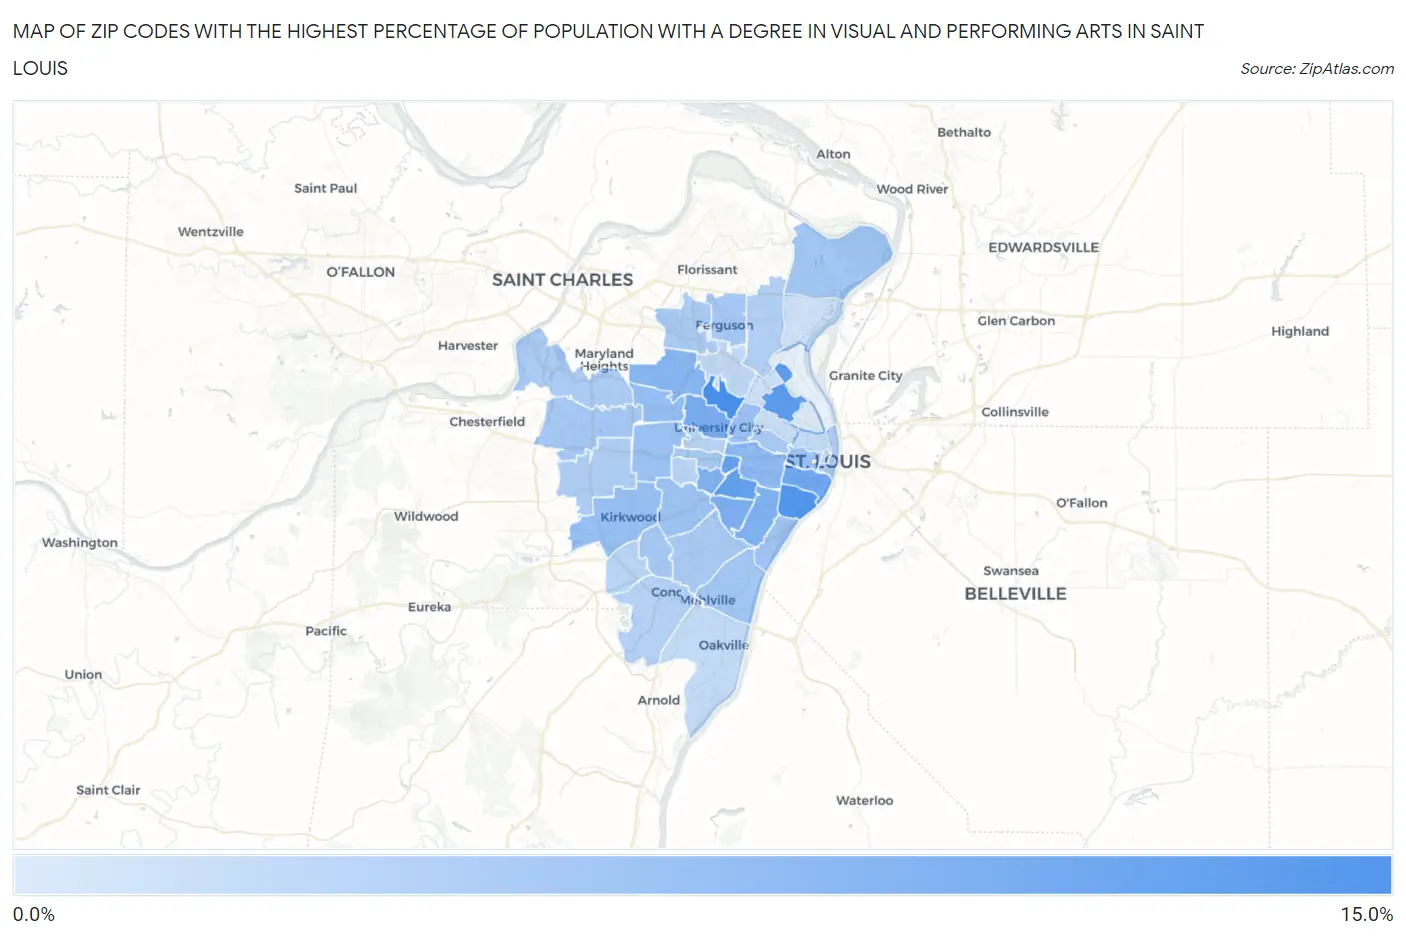
Map of Zip Codes with the Highest Percentage of Population with a Degree in Visual and Performing Arts in Saint Louis
0.0%
15.0%
Zip Codes with the Highest Percentage of Population with a Degree in Visual and Performing Arts in Saint Louis, MO
| Zip Code | % Graduates | vs State | vs National | |
| 1. | 63133 | 10.3% | 3.8%(+6.51)#46 | 4.3%(+6.03)#1,744 |
| 2. | 63118 | 9.5% | 3.8%(+5.73)#51 | 4.3%(+5.25)#2,022 |
| 3. | 63115 | 8.8% | 3.8%(+5.00)#64 | 4.3%(+4.52)#2,373 |
| 4. | 63139 | 8.3% | 3.8%(+4.50)#70 | 4.3%(+4.02)#2,676 |
| 5. | 63104 | 7.4% | 3.8%(+3.68)#84 | 4.3%(+3.20)#3,258 |
| 6. | 63130 | 6.9% | 3.8%(+3.14)#97 | 4.3%(+2.66)#3,747 |
| 7. | 63109 | 6.6% | 3.8%(+2.84)#105 | 4.3%(+2.36)#4,108 |
| 8. | 63116 | 6.4% | 3.8%(+2.65)#108 | 4.3%(+2.17)#4,322 |
| 9. | 63143 | 6.4% | 3.8%(+2.63)#109 | 4.3%(+2.15)#4,348 |
| 10. | 63114 | 5.9% | 3.8%(+2.14)#119 | 4.3%(+1.66)#4,991 |
| 11. | 63110 | 5.5% | 3.8%(+1.69)#133 | 4.3%(+1.21)#5,751 |
| 12. | 63132 | 5.1% | 3.8%(+1.30)#149 | 4.3%(+0.819)#6,481 |
| 13. | 63122 | 4.9% | 3.8%(+1.16)#154 | 4.3%(+0.675)#6,812 |
| 14. | 63112 | 4.8% | 3.8%(+1.03)#159 | 4.3%(+0.551)#7,069 |
| 15. | 63124 | 4.6% | 3.8%(+0.803)#170 | 4.3%(+0.322)#7,613 |
| 16. | 63119 | 4.5% | 3.8%(+0.701)#177 | 4.3%(+0.220)#7,882 |
| 17. | 63103 | 4.4% | 3.8%(+0.622)#182 | 4.3%(+0.141)#8,116 |
| 18. | 63111 | 4.4% | 3.8%(+0.581)#187 | 4.3%(+0.100)#8,206 |
| 19. | 63125 | 4.2% | 3.8%(+0.445)#197 | 4.3%(-0.036)#8,580 |
| 20. | 63138 | 4.2% | 3.8%(+0.424)#200 | 4.3%(-0.057)#8,645 |
| 21. | 63126 | 4.0% | 3.8%(+0.244)#222 | 4.3%(-0.237)#9,211 |
| 22. | 63141 | 4.0% | 3.8%(+0.211)#224 | 4.3%(-0.270)#9,312 |
| 23. | 63135 | 4.0% | 3.8%(+0.200)#226 | 4.3%(-0.281)#9,336 |
| 24. | 63117 | 3.9% | 3.8%(+0.147)#234 | 4.3%(-0.334)#9,514 |
| 25. | 63108 | 3.9% | 3.8%(+0.144)#235 | 4.3%(-0.337)#9,524 |
| 26. | 63123 | 3.8% | 3.8%(+0.010)#247 | 4.3%(-0.471)#9,908 |
| 27. | 63146 | 3.6% | 3.8%(-0.204)#261 | 4.3%(-0.685)#10,627 |
| 28. | 63134 | 3.5% | 3.8%(-0.243)#264 | 4.3%(-0.724)#10,789 |
| 29. | 63131 | 3.4% | 3.8%(-0.336)#275 | 4.3%(-0.817)#11,132 |
| 30. | 63102 | 3.3% | 3.8%(-0.492)#289 | 4.3%(-0.973)#11,698 |
| 31. | 63136 | 3.1% | 3.8%(-0.656)#300 | 4.3%(-1.14)#12,295 |
| 32. | 63128 | 3.0% | 3.8%(-0.748)#310 | 4.3%(-1.23)#12,670 |
| 33. | 63127 | 2.7% | 3.8%(-1.05)#331 | 4.3%(-1.53)#13,820 |
| 34. | 63105 | 2.7% | 3.8%(-1.06)#333 | 4.3%(-1.54)#13,844 |
| 35. | 63144 | 2.7% | 3.8%(-1.07)#337 | 4.3%(-1.56)#13,920 |
| 36. | 63121 | 2.3% | 3.8%(-1.46)#376 | 4.3%(-1.94)#15,343 |
| 37. | 63101 | 2.3% | 3.8%(-1.52)#381 | 4.3%(-2.00)#15,531 |
| 38. | 63129 | 2.1% | 3.8%(-1.63)#390 | 4.3%(-2.11)#15,923 |
| 39. | 63106 | 2.0% | 3.8%(-1.75)#402 | 4.3%(-2.23)#16,390 |
| 40. | 63113 | 1.6% | 3.8%(-2.19)#434 | 4.3%(-2.67)#17,906 |
| 41. | 63120 | 1.4% | 3.8%(-2.36)#445 | 4.3%(-2.84)#18,442 |
| 42. | 63137 | 1.3% | 3.8%(-2.43)#453 | 4.3%(-2.92)#18,650 |
| 43. | 63107 | 0.50% | 3.8%(-3.27)#515 | 4.3%(-3.75)#20,777 |
1
Common Questions
What are the Top 10 Zip Codes with the Highest Percentage of Population with a Degree in Visual and Performing Arts in Saint Louis, MO?
Top 10 Zip Codes with the Highest Percentage of Population with a Degree in Visual and Performing Arts in Saint Louis, MO are:
What zip code has the Highest Percentage of Population with a Degree in Visual and Performing Arts in Saint Louis, MO?
63133 has the Highest Percentage of Population with a Degree in Visual and Performing Arts in Saint Louis, MO with 10.3%.
What is the Percentage of Population with a Degree in Visual and Performing Arts in Missouri?
Percentage of Population with a Degree in Visual and Performing Arts in Missouri is 3.8%.
What is the Percentage of Population with a Degree in Visual and Performing Arts in the United States?
Percentage of Population with a Degree in Visual and Performing Arts in the United States is 4.3%.