Zip Codes with the Highest Percentage of Local Government Employees in Saint Louis, MO
RELATED REPORTS & OPTIONS
Local Government Employees
Saint Louis
Compare Zip Codes
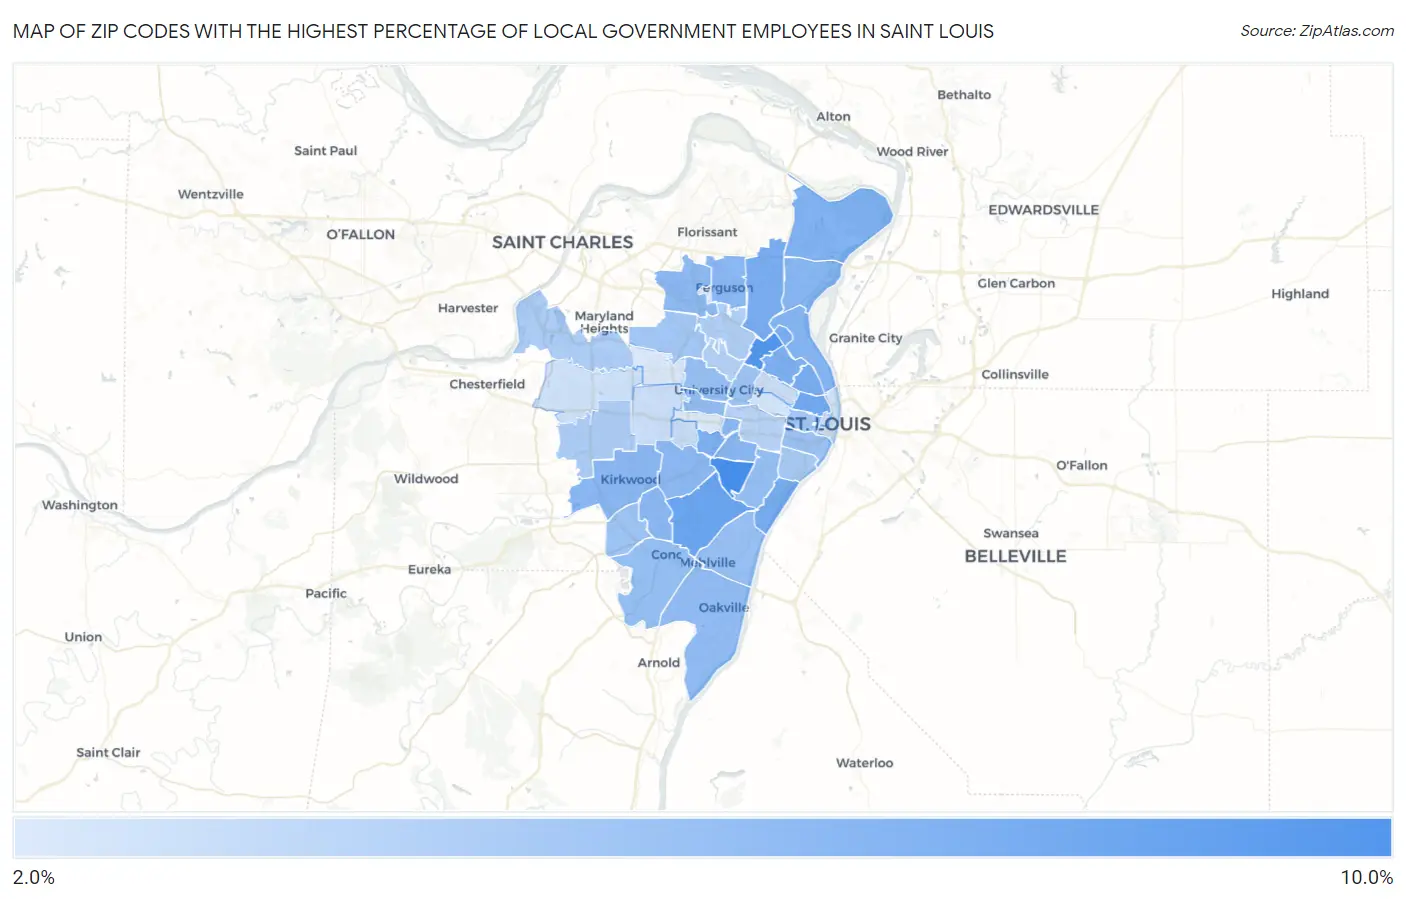
Map of Zip Codes with the Highest Percentage of Local Government Employees in Saint Louis
0.0%
10.0%
Zip Codes with the Highest Percentage of Local Government Employees in Saint Louis, MO
| Zip Code | % Local Government Employees | vs State | vs National | |
| 1. | 63109 | 8.9% | 6.3%(+2.61)#239 | 7.2%(+1.64)#10,875 |
| 2. | 63120 | 8.3% | 6.3%(+2.06)#275 | 7.2%(+1.09)#12,304 |
| 3. | 63123 | 7.2% | 6.3%(+0.932)#353 | 7.2%(-0.035)#15,715 |
| 4. | 63106 | 7.0% | 6.3%(+0.745)#368 | 7.2%(-0.223)#16,349 |
| 5. | 63111 | 6.7% | 6.3%(+0.434)#396 | 7.2%(-0.534)#17,422 |
| 6. | 63107 | 6.6% | 6.3%(+0.296)#414 | 7.2%(-0.671)#17,935 |
| 7. | 63136 | 6.5% | 6.3%(+0.267)#417 | 7.2%(-0.701)#18,028 |
| 8. | 63143 | 6.4% | 6.3%(+0.133)#426 | 7.2%(-0.834)#18,456 |
| 9. | 63115 | 6.4% | 6.3%(+0.103)#433 | 7.2%(-0.865)#18,577 |
| 10. | 63138 | 6.2% | 6.3%(-0.028)#451 | 7.2%(-0.995)#19,019 |
| 11. | 63147 | 6.0% | 6.3%(-0.218)#475 | 7.2%(-1.19)#19,656 |
| 12. | 63137 | 5.9% | 6.3%(-0.344)#488 | 7.2%(-1.31)#20,064 |
| 13. | 63139 | 5.8% | 6.3%(-0.437)#500 | 7.2%(-1.40)#20,367 |
| 14. | 63126 | 5.8% | 6.3%(-0.441)#501 | 7.2%(-1.41)#20,380 |
| 15. | 63122 | 5.8% | 6.3%(-0.442)#502 | 7.2%(-1.41)#20,382 |
| 16. | 63135 | 5.8% | 6.3%(-0.445)#504 | 7.2%(-1.41)#20,395 |
| 17. | 63119 | 5.8% | 6.3%(-0.484)#514 | 7.2%(-1.45)#20,548 |
| 18. | 63134 | 5.6% | 6.3%(-0.687)#534 | 7.2%(-1.65)#21,247 |
| 19. | 63129 | 5.5% | 6.3%(-0.741)#544 | 7.2%(-1.71)#21,435 |
| 20. | 63105 | 5.4% | 6.3%(-0.891)#562 | 7.2%(-1.86)#21,911 |
| 21. | 63116 | 5.4% | 6.3%(-0.896)#563 | 7.2%(-1.86)#21,929 |
| 22. | 63128 | 5.3% | 6.3%(-0.913)#566 | 7.2%(-1.88)#21,980 |
| 23. | 63125 | 5.2% | 6.3%(-1.07)#589 | 7.2%(-2.04)#22,477 |
| 24. | 63130 | 5.2% | 6.3%(-1.09)#594 | 7.2%(-2.06)#22,532 |
| 25. | 63104 | 5.1% | 6.3%(-1.18)#598 | 7.2%(-2.15)#22,794 |
| 26. | 63127 | 4.9% | 6.3%(-1.39)#626 | 7.2%(-2.36)#23,436 |
| 27. | 63112 | 4.9% | 6.3%(-1.41)#627 | 7.2%(-2.37)#23,467 |
| 28. | 63114 | 4.7% | 6.3%(-1.57)#639 | 7.2%(-2.53)#23,895 |
| 29. | 63103 | 4.7% | 6.3%(-1.58)#641 | 7.2%(-2.54)#23,933 |
| 30. | 63118 | 4.5% | 6.3%(-1.77)#668 | 7.2%(-2.74)#24,443 |
| 31. | 63146 | 4.3% | 6.3%(-1.97)#684 | 7.2%(-2.94)#24,995 |
| 32. | 63131 | 4.3% | 6.3%(-2.00)#686 | 7.2%(-2.96)#25,055 |
| 33. | 63121 | 4.1% | 6.3%(-2.17)#701 | 7.2%(-3.14)#25,481 |
| 34. | 63133 | 4.0% | 6.3%(-2.28)#710 | 7.2%(-3.25)#25,727 |
| 35. | 63110 | 3.7% | 6.3%(-2.51)#724 | 7.2%(-3.48)#26,257 |
| 36. | 63144 | 3.2% | 6.3%(-3.05)#767 | 7.2%(-4.02)#27,220 |
| 37. | 63101 | 3.0% | 6.3%(-3.25)#783 | 7.2%(-4.21)#27,540 |
| 38. | 63124 | 3.0% | 6.3%(-3.25)#784 | 7.2%(-4.22)#27,547 |
| 39. | 63113 | 2.9% | 6.3%(-3.31)#792 | 7.2%(-4.28)#27,637 |
| 40. | 63102 | 2.8% | 6.3%(-3.47)#803 | 7.2%(-4.44)#27,845 |
| 41. | 63141 | 2.8% | 6.3%(-3.48)#804 | 7.2%(-4.44)#27,855 |
| 42. | 63108 | 2.6% | 6.3%(-3.70)#817 | 7.2%(-4.67)#28,134 |
| 43. | 63140 | 2.3% | 6.3%(-3.97)#836 | 7.2%(-4.94)#28,443 |
| 44. | 63132 | 2.3% | 6.3%(-4.01)#841 | 7.2%(-4.97)#28,472 |
| 45. | 63117 | 2.2% | 6.3%(-4.09)#844 | 7.2%(-5.06)#28,554 |
1
Common Questions
What are the Top 10 Zip Codes with the Highest Percentage of Local Government Employees in Saint Louis, MO?
Top 10 Zip Codes with the Highest Percentage of Local Government Employees in Saint Louis, MO are:
What zip code has the Highest Percentage of Local Government Employees in Saint Louis, MO?
63109 has the Highest Percentage of Local Government Employees in Saint Louis, MO with 8.9%.
What is the Percentage of Local Government Employees in Missouri?
Percentage of Local Government Employees in Missouri is 6.3%.
What is the Percentage of Local Government Employees in the United States?
Percentage of Local Government Employees in the United States is 7.2%.