Zip Codes with the Highest Percentage of Population Employed in Computer & Mathematics in Saint Louis, MO
RELATED REPORTS & OPTIONS
Computer & Mathematics
Saint Louis
Compare Zip Codes
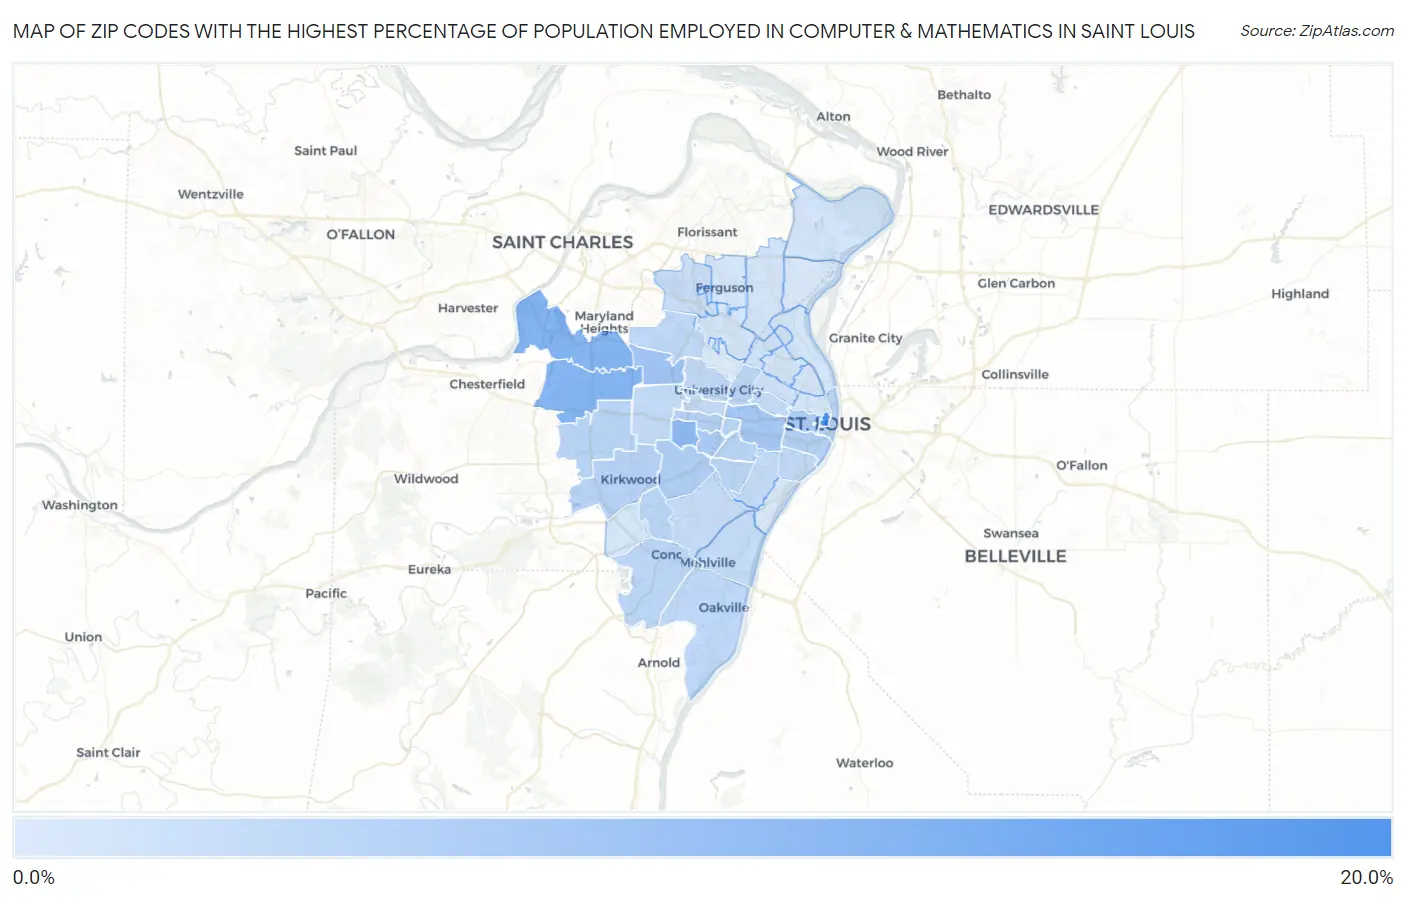
Map of Zip Codes with the Highest Percentage of Population Employed in Computer & Mathematics in Saint Louis
0.0%
20.0%
Zip Codes with the Highest Percentage of Population Employed in Computer & Mathematics in Saint Louis, MO
| Zip Code | % Employed | vs State | vs National | |
| 1. | 63101 | 19.8% | 3.2%(+16.6)#3 | 3.5%(+16.3)#134 |
| 2. | 63146 | 11.4% | 3.2%(+8.25)#7 | 3.5%(+7.92)#503 |
| 3. | 63141 | 11.2% | 3.2%(+8.02)#8 | 3.5%(+7.69)#537 |
| 4. | 63144 | 10.4% | 3.2%(+7.23)#9 | 3.5%(+6.90)#644 |
| 5. | 63132 | 7.6% | 3.2%(+4.37)#23 | 3.5%(+4.04)#1,363 |
| 6. | 63110 | 7.0% | 3.2%(+3.77)#29 | 3.5%(+3.44)#1,645 |
| 7. | 63143 | 6.2% | 3.2%(+3.01)#40 | 3.5%(+2.68)#2,141 |
| 8. | 63103 | 6.1% | 3.2%(+2.90)#44 | 3.5%(+2.57)#2,234 |
| 9. | 63119 | 5.7% | 3.2%(+2.46)#52 | 3.5%(+2.13)#2,633 |
| 10. | 63104 | 5.4% | 3.2%(+2.25)#57 | 3.5%(+1.92)#2,845 |
| 11. | 63117 | 5.1% | 3.2%(+1.90)#70 | 3.5%(+1.56)#3,240 |
| 12. | 63122 | 4.8% | 3.2%(+1.65)#74 | 3.5%(+1.32)#3,582 |
| 13. | 63102 | 4.7% | 3.2%(+1.47)#83 | 3.5%(+1.14)#3,850 |
| 14. | 63139 | 4.6% | 3.2%(+1.40)#84 | 3.5%(+1.07)#3,952 |
| 15. | 63131 | 4.5% | 3.2%(+1.34)#88 | 3.5%(+1.01)#4,031 |
| 16. | 63126 | 4.5% | 3.2%(+1.27)#94 | 3.5%(+0.941)#4,144 |
| 17. | 63109 | 4.2% | 3.2%(+0.961)#107 | 3.5%(+0.629)#4,696 |
| 18. | 63128 | 4.1% | 3.2%(+0.953)#108 | 3.5%(+0.621)#4,718 |
| 19. | 63112 | 4.1% | 3.2%(+0.888)#111 | 3.5%(+0.556)#4,852 |
| 20. | 63114 | 4.0% | 3.2%(+0.808)#115 | 3.5%(+0.477)#5,035 |
| 21. | 63129 | 3.8% | 3.2%(+0.648)#123 | 3.5%(+0.317)#5,376 |
| 22. | 63130 | 3.7% | 3.2%(+0.537)#127 | 3.5%(+0.206)#5,640 |
| 23. | 63118 | 3.5% | 3.2%(+0.344)#139 | 3.5%(+0.013)#6,105 |
| 24. | 63108 | 3.4% | 3.2%(+0.175)#153 | 3.5%(-0.157)#6,575 |
| 25. | 63105 | 3.2% | 3.2%(+0.044)#162 | 3.5%(-0.287)#6,987 |
| 26. | 63124 | 3.2% | 3.2%(-0.010)#166 | 3.5%(-0.342)#7,150 |
| 27. | 63116 | 3.2% | 3.2%(-0.042)#170 | 3.5%(-0.374)#7,258 |
| 28. | 63125 | 3.1% | 3.2%(-0.095)#176 | 3.5%(-0.426)#7,412 |
| 29. | 63140 | 2.9% | 3.2%(-0.336)#198 | 3.5%(-0.667)#8,260 |
| 30. | 63123 | 2.6% | 3.2%(-0.563)#212 | 3.5%(-0.895)#9,114 |
| 31. | 63134 | 2.5% | 3.2%(-0.739)#230 | 3.5%(-1.07)#9,824 |
| 32. | 63120 | 1.7% | 3.2%(-1.48)#304 | 3.5%(-1.81)#13,186 |
| 33. | 63113 | 1.6% | 3.2%(-1.58)#311 | 3.5%(-1.91)#13,750 |
| 34. | 63115 | 1.4% | 3.2%(-1.75)#346 | 3.5%(-2.08)#14,687 |
| 35. | 63136 | 1.4% | 3.2%(-1.76)#347 | 3.5%(-2.09)#14,739 |
| 36. | 63121 | 1.4% | 3.2%(-1.77)#352 | 3.5%(-2.11)#14,835 |
| 37. | 63138 | 1.3% | 3.2%(-1.89)#372 | 3.5%(-2.22)#15,505 |
| 38. | 63147 | 1.3% | 3.2%(-1.90)#374 | 3.5%(-2.23)#15,578 |
| 39. | 63135 | 1.2% | 3.2%(-1.98)#384 | 3.5%(-2.31)#16,063 |
| 40. | 63106 | 1.1% | 3.2%(-2.07)#404 | 3.5%(-2.40)#16,559 |
| 41. | 63107 | 1.1% | 3.2%(-2.12)#415 | 3.5%(-2.45)#16,908 |
| 42. | 63127 | 0.95% | 3.2%(-2.24)#442 | 3.5%(-2.57)#17,676 |
| 43. | 63137 | 0.85% | 3.2%(-2.34)#463 | 3.5%(-2.67)#18,315 |
| 44. | 63111 | 0.72% | 3.2%(-2.47)#494 | 3.5%(-2.80)#19,122 |
| 45. | 63133 | 0.26% | 3.2%(-2.94)#586 | 3.5%(-3.27)#21,816 |
1
Common Questions
What are the Top 10 Zip Codes with the Highest Percentage of Population Employed in Computer & Mathematics in Saint Louis, MO?
Top 10 Zip Codes with the Highest Percentage of Population Employed in Computer & Mathematics in Saint Louis, MO are:
What zip code has the Highest Percentage of Population Employed in Computer & Mathematics in Saint Louis, MO?
63101 has the Highest Percentage of Population Employed in Computer & Mathematics in Saint Louis, MO with 19.8%.
What is the Percentage of Population Employed in Computer & Mathematics in Missouri?
Percentage of Population Employed in Computer & Mathematics in Missouri is 3.2%.
What is the Percentage of Population Employed in Computer & Mathematics in the United States?
Percentage of Population Employed in Computer & Mathematics in the United States is 3.5%.