Zip Codes with the Highest Percentage of Population Employed in Accommodation & Food Services in Saint Louis, MO

RELATED REPORTS & OPTIONS

Accommodation & Food Services
Population
Families and Households
Female Fertility
Female Fertility (Unmarried)
Race (Community Size)
Race (Percentage)
Ancestry (Community Size)
AfghanAfricanAlbanianAlsatianAmericanArabArgentineanArmenianAustralianAustrianBahamianBelgianBelizeanBermudanBhutaneseBlackfeetBolivianBrazilianBritishBritish West IndianBulgarianBurmeseCajunCanadianCelticCentral AmericanCentral American IndianCherokeeChickasawChileanChippewaChoctawColombianCosta RicanCreekCroatianCubanCzechCzechoslovakianDanishDelawareDominicanDutchEastern EuropeanEcuadorianEgyptianEnglishEthiopianEuropeanFilipinoFinnishFrenchFrench American IndianFrench CanadianGermanGhanaianGreekGuamanian / ChamorroGuatemalanGuyaneseHaitianHonduranHungarianIcelanderIndian (Asian)IndonesianInupiatIranianIraqiIrishIroquoisIsraeliItalianJamaicanJapaneseJordanianKenyanKoreanLaotianLatvianLebaneseLiberianLithuanianLuxembourgerMacedonianMalaysianMalteseMexicanMexican American IndianMongolianMoroccanNative HawaiianNavajoNew ZealanderNicaraguanNigerianNorthern EuropeanNorwegianOsagePakistaniPalestinianPanamanianPennsylvania GermanPeruvianPolishPortuguesePotawatomiPuerto RicanRomanianRussianSalvadoranSamoanScandinavianScotch-IrishScottishSeminoleSenegaleseSerbianSierra LeoneanSiouxSlavicSlovakSloveneSomaliSouth AfricanSouth AmericanSpaniardSpanishSri LankanSubsaharan AfricanSudaneseSwedishSwissSyrianThaiTrinidadian and TobagonianTurkishUgandanUkrainianUruguayanUteVenezuelanWelshWest IndianYugoslavian
Ancestry (Percentage)
AfghanAfricanAlbanianAlsatianAmericanArabArgentineanArmenianAustralianAustrianBahamianBelgianBelizeanBermudanBhutaneseBlackfeetBolivianBrazilianBritishBritish West IndianBulgarianBurmeseCajunCanadianCelticCentral AmericanCentral American IndianCherokeeChickasawChileanChippewaChoctawColombianCosta RicanCreekCroatianCubanCzechCzechoslovakianDanishDelawareDominicanDutchEastern EuropeanEcuadorianEgyptianEnglishEthiopianEuropeanFilipinoFinnishFrenchFrench American IndianFrench CanadianGermanGhanaianGreekGuamanian / ChamorroGuatemalanGuyaneseHaitianHonduranHungarianIcelanderIndian (Asian)IndonesianInupiatIranianIraqiIrishIroquoisIsraeliItalianJamaicanJapaneseJordanianKenyanKoreanLaotianLatvianLebaneseLiberianLithuanianLuxembourgerMacedonianMalaysianMalteseMexicanMexican American IndianMongolianMoroccanNative HawaiianNavajoNew ZealanderNicaraguanNigerianNorthern EuropeanNorwegianOsagePakistaniPalestinianPanamanianPennsylvania GermanPeruvianPolishPortuguesePotawatomiPuerto RicanRomanianRussianSalvadoranSamoanScandinavianScotch-IrishScottishSeminoleSenegaleseSerbianSierra LeoneanSiouxSlavicSlovakSloveneSomaliSouth AfricanSouth AmericanSpaniardSpanishSri LankanSubsaharan AfricanSudaneseSwedishSwissSyrianThaiTrinidadian and TobagonianTurkishUgandanUkrainianUruguayanUteVenezuelanWelshWest IndianYugoslavian
Immigrant Origin (Total)
AfghanistanAfricaAlbaniaArgentinaAsiaAustraliaAustriaBahamasBangladeshBelarusBelgiumBelizeBoliviaBosnia and HerzegovinaBrazilBulgariaBurma / MyanmarCambodiaCanadaCaribbeanCentral AmericaChileChinaColombiaCongoCosta RicaCroatiaCubaCzechoslovakiaDenmarkEastern AfricaEastern AsiaEastern EuropeEcuadorEgyptEl SalvadorEnglandEritreaEthiopiaEuropeFranceGermanyGhanaGreeceGuatemalaGuyanaHaitiHondurasHong KongHungaryIndiaIndonesiaIranIraqIrelandIsraelItalyJamaicaJapanJordanKazakhstanKenyaKoreaKuwaitLaosLatin AmericaLebanonLiberiaMalaysiaMexicoMiddle AfricaMoldovaMoroccoNepalNetherlandsNicaraguaNigeriaNorth MacedoniaNorthern AfricaNorthern EuropeNorwayOceaniaPakistanPanamaPeruPhilippinesPolandRomaniaRussiaSaudi ArabiaScotlandSenegalSerbiaSierra LeoneSingaporeSomaliaSouth AfricaSouth AmericaSouth Central AsiaSouth Eastern AsiaSouthern EuropeSpainSri LankaSudanSwedenSwitzerlandSyriaTaiwanThailandTrinidad and TobagoTurkeyUgandaUkraineUruguayUzbekistanVenezuelaVietnamWestern AfricaWestern AsiaWestern EuropeZaireZimbabwe
Immigrant Origin (Percentage)
AfghanistanAfricaAlbaniaArgentinaAsiaAustraliaAustriaBahamasBangladeshBelarusBelgiumBelizeBoliviaBosnia and HerzegovinaBrazilBulgariaBurma / MyanmarCambodiaCanadaCaribbeanCentral AmericaChileChinaColombiaCongoCosta RicaCroatiaCubaCzechoslovakiaDenmarkEastern AfricaEastern AsiaEastern EuropeEcuadorEgyptEl SalvadorEnglandEritreaEthiopiaEuropeFranceGermanyGhanaGreeceGuatemalaGuyanaHaitiHondurasHong KongHungaryIndiaIndonesiaIranIraqIrelandIsraelItalyJamaicaJapanJordanKazakhstanKenyaKoreaKuwaitLaosLatin AmericaLebanonLiberiaMalaysiaMexicoMiddle AfricaMoldovaMoroccoNepalNetherlandsNicaraguaNigeriaNorth MacedoniaNorthern AfricaNorthern EuropeNorwayOceaniaPakistanPanamaPeruPhilippinesPolandRomaniaRussiaSaudi ArabiaScotlandSenegalSerbiaSierra LeoneSingaporeSomaliaSouth AfricaSouth AmericaSouth Central AsiaSouth Eastern AsiaSouthern EuropeSpainSri LankaSudanSwedenSwitzerlandSyriaTaiwanThailandTrinidad and TobagoTurkeyUgandaUkraineUruguayUzbekistanVenezuelaVietnamWestern AfricaWestern AsiaWestern EuropeZaireZimbabwe
Income
Income (Families)
Income (Households)
Poverty
Poverty (Families)
Unemployment
Employment Occupations
Employment Industries
Employer Class
Commute Time
Commute Means
School Enrollment
Education by Degree Field
Occupancy
Finances
Physical Characteristics
Saint Louis
Compare Zip Codes
Comparison Subject

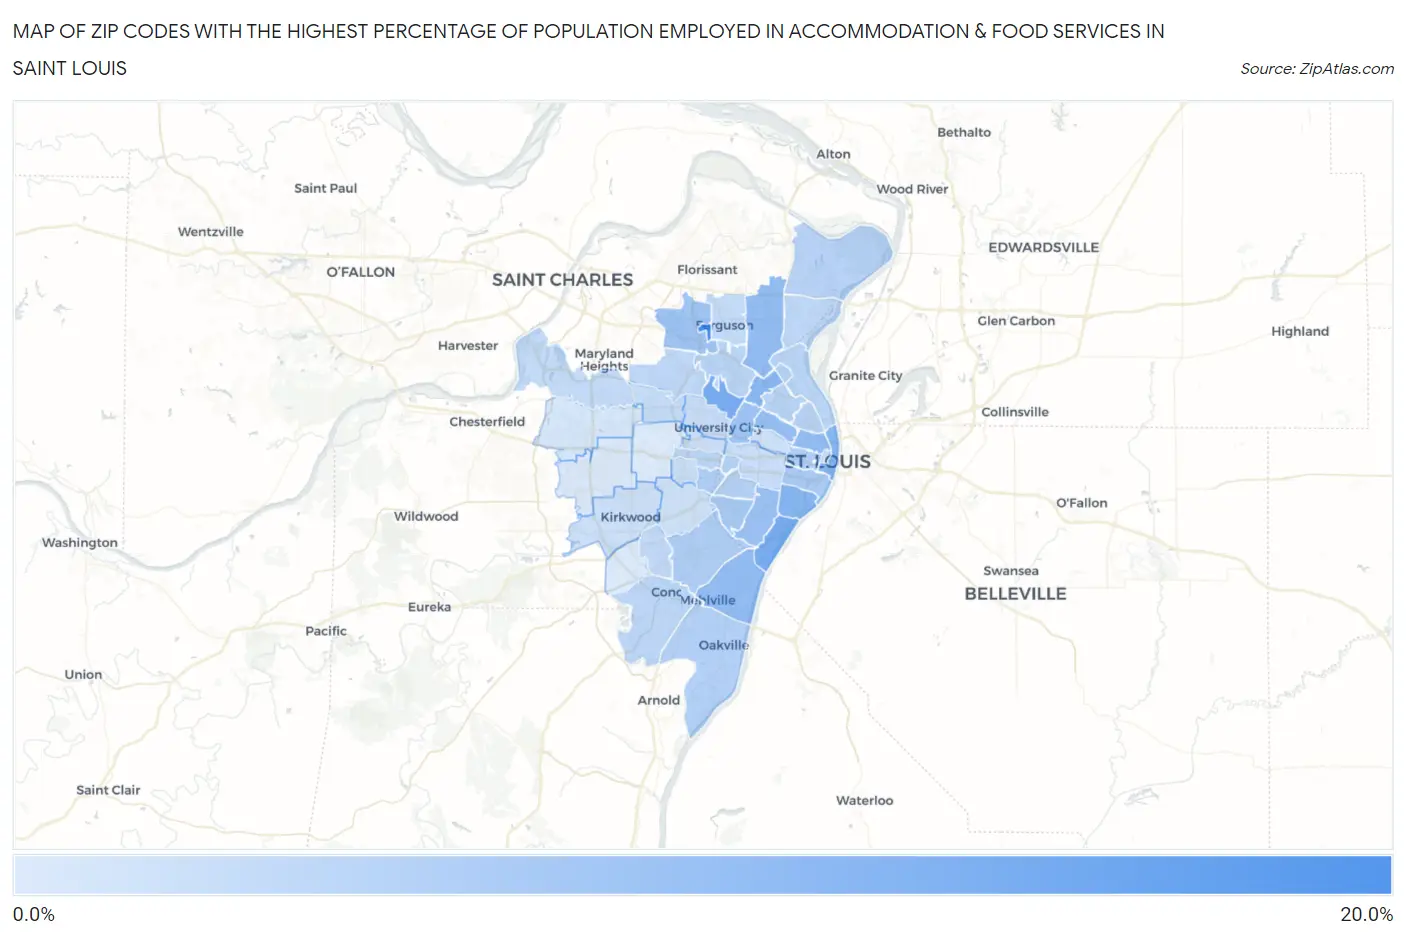
Map of Zip Codes with the Highest Percentage of Population Employed in Accommodation & Food Services in Saint Louis

0.0%
20.0%
Zip Codes with the Highest Percentage of Population Employed in Accommodation & Food Services in Saint Louis Map

Zip Codes with the Highest Percentage of Population Employed in Accommodation & Food Services in Saint Louis, MO

Zip Code % Employed vs State vs National
1.6314019.4%6.6%(+12.9)#296.9%(+12.5)#889
2.6311113.5%6.6%(+6.93)#676.9%(+6.62)#2,141
3.6313313.3%6.6%(+6.75)#706.9%(+6.44)#2,219
4.6311811.8%6.6%(+5.24)#856.9%(+4.94)#2,942
5.6310211.7%6.6%(+5.11)#896.9%(+4.81)#3,025
6.6312011.7%6.6%(+5.08)#906.9%(+4.77)#3,045
7.6310610.5%6.6%(+3.91)#1116.9%(+3.61)#4,003
8.6313610.5%6.6%(+3.91)#1136.9%(+3.60)#4,005
9.6312510.4%6.6%(+3.80)#1186.9%(+3.49)#4,125
10.6311310.0%6.6%(+3.43)#1256.9%(+3.12)#4,532
11.631169.4%6.6%(+2.85)#1536.9%(+2.55)#5,311
12.631349.0%6.6%(+2.39)#1736.9%(+2.08)#6,021
13.631128.9%6.6%(+2.38)#1746.9%(+2.07)#6,041
14.631098.3%6.6%(+1.69)#2086.9%(+1.38)#7,300
15.631048.0%6.6%(+1.46)#2176.9%(+1.15)#7,753
16.631237.4%6.6%(+0.872)#2496.9%(+0.565)#9,117
17.631037.2%6.6%(+0.606)#2656.9%(+0.299)#9,855
18.631437.1%6.6%(+0.571)#2686.9%(+0.264)#9,931
19.631297.0%6.6%(+0.417)#2786.9%(+0.110)#10,341
20.631396.7%6.6%(+0.148)#2956.9%(-0.158)#11,130
21.631386.5%6.6%(-0.068)#3136.9%(-0.375)#11,830
22.631076.3%6.6%(-0.242)#3306.9%(-0.548)#12,371
23.631216.3%6.6%(-0.304)#3376.9%(-0.610)#12,573
24.631476.2%6.6%(-0.416)#3516.9%(-0.723)#12,940
25.631156.0%6.6%(-0.528)#3596.9%(-0.834)#13,311
26.631175.9%6.6%(-0.630)#3706.9%(-0.936)#13,622
27.631285.9%6.6%(-0.693)#3806.9%(-1.000)#13,847
28.631375.7%6.6%(-0.833)#3896.9%(-1.14)#14,251
29.631145.6%6.6%(-0.968)#3986.9%(-1.27)#14,684
30.631265.5%6.6%(-1.09)#4106.9%(-1.40)#15,109
31.631355.3%6.6%(-1.31)#4296.9%(-1.62)#15,889
32.631465.1%6.6%(-1.43)#4406.9%(-1.74)#16,306
33.631324.9%6.6%(-1.69)#4676.9%(-1.99)#17,198
34.631304.7%6.6%(-1.85)#4806.9%(-2.15)#17,727
35.631444.6%6.6%(-1.95)#4886.9%(-2.25)#18,073
36.631104.4%6.6%(-2.22)#5196.9%(-2.53)#18,993
37.631054.3%6.6%(-2.32)#5336.9%(-2.63)#19,350
38.631224.2%6.6%(-2.35)#5346.9%(-2.65)#19,412
39.631014.1%6.6%(-2.46)#5436.9%(-2.77)#19,776
40.631084.0%6.6%(-2.56)#5536.9%(-2.87)#20,114
41.631193.9%6.6%(-2.66)#5656.9%(-2.97)#20,442
42.631413.1%6.6%(-3.47)#6386.9%(-3.78)#22,932
43.631312.6%6.6%(-3.93)#6806.9%(-4.23)#24,121
44.631242.5%6.6%(-4.04)#6946.9%(-4.34)#24,389
45.631272.5%6.6%(-4.11)#7026.9%(-4.41)#24,566

Common Questions

What are the Top 10 Zip Codes with the Highest Percentage of Population Employed in Accommodation & Food Services in Saint Louis, MO?
Top 10 Zip Codes with the Highest Percentage of Population Employed in Accommodation & Food Services in Saint Louis, MO are:
#1
19.4%
#2
13.5%
#3
13.3%
#4
11.8%
#5
11.7%
#6
11.7%
#7
10.5%
#8
10.5%
#9
10.4%
#10
10.0%
What zip code has the Highest Percentage of Population Employed in Accommodation & Food Services in Saint Louis, MO?
63140 has the Highest Percentage of Population Employed in Accommodation & Food Services in Saint Louis, MO with 19.4%.
What is the Percentage of Population Employed in Accommodation & Food Services in Missouri?
Percentage of Population Employed in Accommodation & Food Services in Missouri is 6.6%.
What is the Percentage of Population Employed in Accommodation & Food Services in the United States?
Percentage of Population Employed in Accommodation & Food Services in the United States is 6.9%.