Zip Codes with the Highest Percentage of Households With Three or more Vehicles in Saint Louis, MO

RELATED REPORTS & OPTIONS

Households with 3 or more Cars
Population
Families and Households
Female Fertility
Female Fertility (Unmarried)
Race (Community Size)
Race (Percentage)
Ancestry (Community Size)
AfghanAfricanAlbanianAlsatianAmericanArabArgentineanArmenianAustralianAustrianBahamianBelgianBelizeanBermudanBhutaneseBlackfeetBolivianBrazilianBritishBritish West IndianBulgarianBurmeseCajunCanadianCelticCentral AmericanCentral American IndianCherokeeChickasawChileanChippewaChoctawColombianCosta RicanCreekCroatianCubanCzechCzechoslovakianDanishDelawareDominicanDutchEastern EuropeanEcuadorianEgyptianEnglishEthiopianEuropeanFilipinoFinnishFrenchFrench American IndianFrench CanadianGermanGhanaianGreekGuamanian / ChamorroGuatemalanGuyaneseHaitianHonduranHungarianIcelanderIndian (Asian)IndonesianInupiatIranianIraqiIrishIroquoisIsraeliItalianJamaicanJapaneseJordanianKenyanKoreanLaotianLatvianLebaneseLiberianLithuanianLuxembourgerMacedonianMalaysianMalteseMexicanMexican American IndianMongolianMoroccanNative HawaiianNavajoNew ZealanderNicaraguanNigerianNorthern EuropeanNorwegianOsagePakistaniPalestinianPanamanianPennsylvania GermanPeruvianPolishPortuguesePotawatomiPuerto RicanRomanianRussianSalvadoranSamoanScandinavianScotch-IrishScottishSeminoleSenegaleseSerbianSierra LeoneanSiouxSlavicSlovakSloveneSomaliSouth AfricanSouth AmericanSpaniardSpanishSri LankanSubsaharan AfricanSudaneseSwedishSwissSyrianThaiTrinidadian and TobagonianTurkishUgandanUkrainianUruguayanUteVenezuelanWelshWest IndianYugoslavian
Ancestry (Percentage)
AfghanAfricanAlbanianAlsatianAmericanArabArgentineanArmenianAustralianAustrianBahamianBelgianBelizeanBermudanBhutaneseBlackfeetBolivianBrazilianBritishBritish West IndianBulgarianBurmeseCajunCanadianCelticCentral AmericanCentral American IndianCherokeeChickasawChileanChippewaChoctawColombianCosta RicanCreekCroatianCubanCzechCzechoslovakianDanishDelawareDominicanDutchEastern EuropeanEcuadorianEgyptianEnglishEthiopianEuropeanFilipinoFinnishFrenchFrench American IndianFrench CanadianGermanGhanaianGreekGuamanian / ChamorroGuatemalanGuyaneseHaitianHonduranHungarianIcelanderIndian (Asian)IndonesianInupiatIranianIraqiIrishIroquoisIsraeliItalianJamaicanJapaneseJordanianKenyanKoreanLaotianLatvianLebaneseLiberianLithuanianLuxembourgerMacedonianMalaysianMalteseMexicanMexican American IndianMongolianMoroccanNative HawaiianNavajoNew ZealanderNicaraguanNigerianNorthern EuropeanNorwegianOsagePakistaniPalestinianPanamanianPennsylvania GermanPeruvianPolishPortuguesePotawatomiPuerto RicanRomanianRussianSalvadoranSamoanScandinavianScotch-IrishScottishSeminoleSenegaleseSerbianSierra LeoneanSiouxSlavicSlovakSloveneSomaliSouth AfricanSouth AmericanSpaniardSpanishSri LankanSubsaharan AfricanSudaneseSwedishSwissSyrianThaiTrinidadian and TobagonianTurkishUgandanUkrainianUruguayanUteVenezuelanWelshWest IndianYugoslavian
Immigrant Origin (Total)
AfghanistanAfricaAlbaniaArgentinaAsiaAustraliaAustriaBahamasBangladeshBelarusBelgiumBelizeBoliviaBosnia and HerzegovinaBrazilBulgariaBurma / MyanmarCambodiaCanadaCaribbeanCentral AmericaChileChinaColombiaCongoCosta RicaCroatiaCubaCzechoslovakiaDenmarkEastern AfricaEastern AsiaEastern EuropeEcuadorEgyptEl SalvadorEnglandEritreaEthiopiaEuropeFranceGermanyGhanaGreeceGuatemalaGuyanaHaitiHondurasHong KongHungaryIndiaIndonesiaIranIraqIrelandIsraelItalyJamaicaJapanJordanKazakhstanKenyaKoreaKuwaitLaosLatin AmericaLebanonLiberiaMalaysiaMexicoMiddle AfricaMoldovaMoroccoNepalNetherlandsNicaraguaNigeriaNorth MacedoniaNorthern AfricaNorthern EuropeNorwayOceaniaPakistanPanamaPeruPhilippinesPolandRomaniaRussiaSaudi ArabiaScotlandSenegalSerbiaSierra LeoneSingaporeSomaliaSouth AfricaSouth AmericaSouth Central AsiaSouth Eastern AsiaSouthern EuropeSpainSri LankaSudanSwedenSwitzerlandSyriaTaiwanThailandTrinidad and TobagoTurkeyUgandaUkraineUruguayUzbekistanVenezuelaVietnamWestern AfricaWestern AsiaWestern EuropeZaireZimbabwe
Immigrant Origin (Percentage)
AfghanistanAfricaAlbaniaArgentinaAsiaAustraliaAustriaBahamasBangladeshBelarusBelgiumBelizeBoliviaBosnia and HerzegovinaBrazilBulgariaBurma / MyanmarCambodiaCanadaCaribbeanCentral AmericaChileChinaColombiaCongoCosta RicaCroatiaCubaCzechoslovakiaDenmarkEastern AfricaEastern AsiaEastern EuropeEcuadorEgyptEl SalvadorEnglandEritreaEthiopiaEuropeFranceGermanyGhanaGreeceGuatemalaGuyanaHaitiHondurasHong KongHungaryIndiaIndonesiaIranIraqIrelandIsraelItalyJamaicaJapanJordanKazakhstanKenyaKoreaKuwaitLaosLatin AmericaLebanonLiberiaMalaysiaMexicoMiddle AfricaMoldovaMoroccoNepalNetherlandsNicaraguaNigeriaNorth MacedoniaNorthern AfricaNorthern EuropeNorwayOceaniaPakistanPanamaPeruPhilippinesPolandRomaniaRussiaSaudi ArabiaScotlandSenegalSerbiaSierra LeoneSingaporeSomaliaSouth AfricaSouth AmericaSouth Central AsiaSouth Eastern AsiaSouthern EuropeSpainSri LankaSudanSwedenSwitzerlandSyriaTaiwanThailandTrinidad and TobagoTurkeyUgandaUkraineUruguayUzbekistanVenezuelaVietnamWestern AfricaWestern AsiaWestern EuropeZaireZimbabwe
Income
Income (Families)
Income (Households)
Poverty
Poverty (Families)
Unemployment
Employment Occupations
Employment Industries
Employer Class
Commute Time
Commute Means
School Enrollment
Education by Degree Field
Occupancy
Finances
Physical Characteristics
Saint Louis
Compare Zip Codes
Comparison Subject

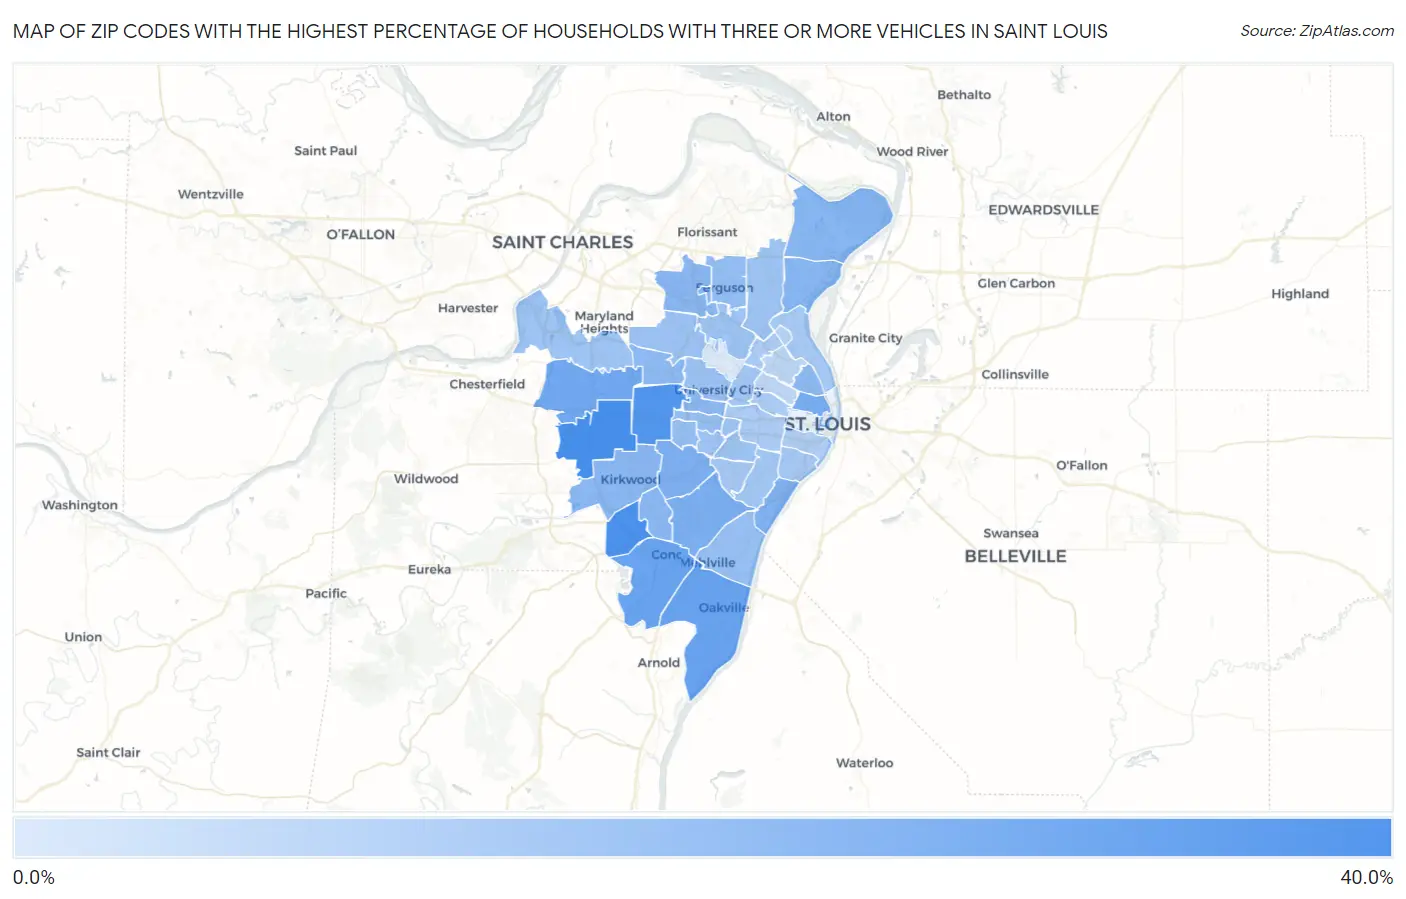
Map of Zip Codes with the Highest Percentage of Households With Three or more Vehicles in Saint Louis

0.0%
40.0%
Zip Codes with the Highest Percentage of Households With Three or more Vehicles in Saint Louis Map

Zip Codes with the Highest Percentage of Households With Three or more Vehicles in Saint Louis, MO

Zip Code Housholds With 3+ Cars vs State vs National
1.6313136.5%29.8%(+6.70)#44629.0%(+7.50)#11,403
2.6312735.4%29.8%(+5.60)#48329.0%(+6.40)#12,438
3.6312433.3%29.8%(+3.50)#54529.0%(+4.30)#14,515
4.6312928.3%29.8%(-1.50)#71029.0%(-0.700)#19,700
5.6312828.0%29.8%(-1.80)#72529.0%(-1.000)#20,040
6.6314126.3%29.8%(-3.50)#76929.0%(-2.70)#21,636
7.6310624.7%29.8%(-5.10)#80529.0%(-4.30)#23,138
8.6312323.4%29.8%(-6.40)#82529.0%(-5.60)#24,236
9.6311922.9%29.8%(-6.90)#83929.0%(-6.10)#24,628
10.6311122.3%29.8%(-7.50)#84829.0%(-6.70)#25,045
11.6314021.6%29.8%(-8.20)#86129.0%(-7.40)#25,607
12.6313720.7%29.8%(-9.10)#87629.0%(-8.30)#26,192
13.6313820.7%29.8%(-9.10)#87729.0%(-8.30)#26,194
14.6312620.3%29.8%(-9.50)#88729.0%(-8.70)#26,469
15.6312220.2%29.8%(-9.60)#88829.0%(-8.80)#26,517
16.6313420.2%29.8%(-9.60)#88929.0%(-8.80)#26,541
17.6310519.8%29.8%(-10.00)#89329.0%(-9.20)#26,793
18.6310719.4%29.8%(-10.4)#89829.0%(-9.60)#27,040
19.6313219.3%29.8%(-10.5)#90429.0%(-9.70)#27,107
20.6313518.4%29.8%(-11.4)#91429.0%(-10.6)#27,595
21.6314417.6%29.8%(-12.2)#91929.0%(-11.4)#28,027
22.6312517.5%29.8%(-12.3)#92029.0%(-11.5)#28,051
23.6311717.3%29.8%(-12.5)#92429.0%(-11.7)#28,170
24.6311416.2%29.8%(-13.6)#93229.0%(-12.8)#28,641
25.6313016.1%29.8%(-13.7)#93429.0%(-12.9)#28,681
26.6312115.9%29.8%(-13.9)#93829.0%(-13.1)#28,762
27.6314615.8%29.8%(-14.0)#93929.0%(-13.2)#28,789
28.6313615.7%29.8%(-14.1)#94029.0%(-13.3)#28,816
29.6313915.6%29.8%(-14.2)#94229.0%(-13.4)#28,868
30.6314315.4%29.8%(-14.4)#94329.0%(-13.6)#28,955
31.6311614.9%29.8%(-14.9)#94729.0%(-14.1)#29,136
32.6311214.6%29.8%(-15.2)#95029.0%(-14.4)#29,241
33.6311814.2%29.8%(-15.6)#95329.0%(-14.8)#29,349
34.6310914.1%29.8%(-15.7)#95529.0%(-14.9)#29,380
35.6314713.6%29.8%(-16.2)#96329.0%(-15.4)#29,542
36.6311013.0%29.8%(-16.8)#96629.0%(-16.0)#29,712
37.6310812.8%29.8%(-17.0)#96729.0%(-16.2)#29,768
38.6312012.6%29.8%(-17.2)#96829.0%(-16.4)#29,828
39.6310412.2%29.8%(-17.6)#97029.0%(-16.8)#29,938
40.631159.5%29.8%(-20.3)#98029.0%(-19.5)#30,528
41.631139.1%29.8%(-20.7)#98129.0%(-19.9)#30,580
42.631013.5%29.8%(-26.3)#98729.0%(-25.5)#31,200
43.631333.0%29.8%(-26.8)#98829.0%(-26.0)#31,238

Common Questions

What are the Top 10 Zip Codes with the Highest Percentage of Households With Three or more Vehicles in Saint Louis, MO?
Top 10 Zip Codes with the Highest Percentage of Households With Three or more Vehicles in Saint Louis, MO are:
#1
36.5%
#2
35.4%
#3
33.3%
#4
28.3%
#5
28.0%
#6
26.3%
#7
24.7%
#8
23.4%
#9
22.9%
#10
22.3%
What zip code has the Highest Percentage of Households With Three or more Vehicles in Saint Louis, MO?
63131 has the Highest Percentage of Households With Three or more Vehicles in Saint Louis, MO with 36.5%.
What is the Percentage of Households With Three or more Vehicles in Missouri?
Percentage of Households With Three or more Vehicles in Missouri is 29.8%.
What is the Percentage of Households With Three or more Vehicles in the United States?
Percentage of Households With Three or more Vehicles in the United States is 29.0%.