Zip Codes with the Highest Percentage of Households Without a Vehicle in Saint Louis, MO
RELATED REPORTS & OPTIONS
Households without a Cars
Saint Louis
Compare Zip Codes
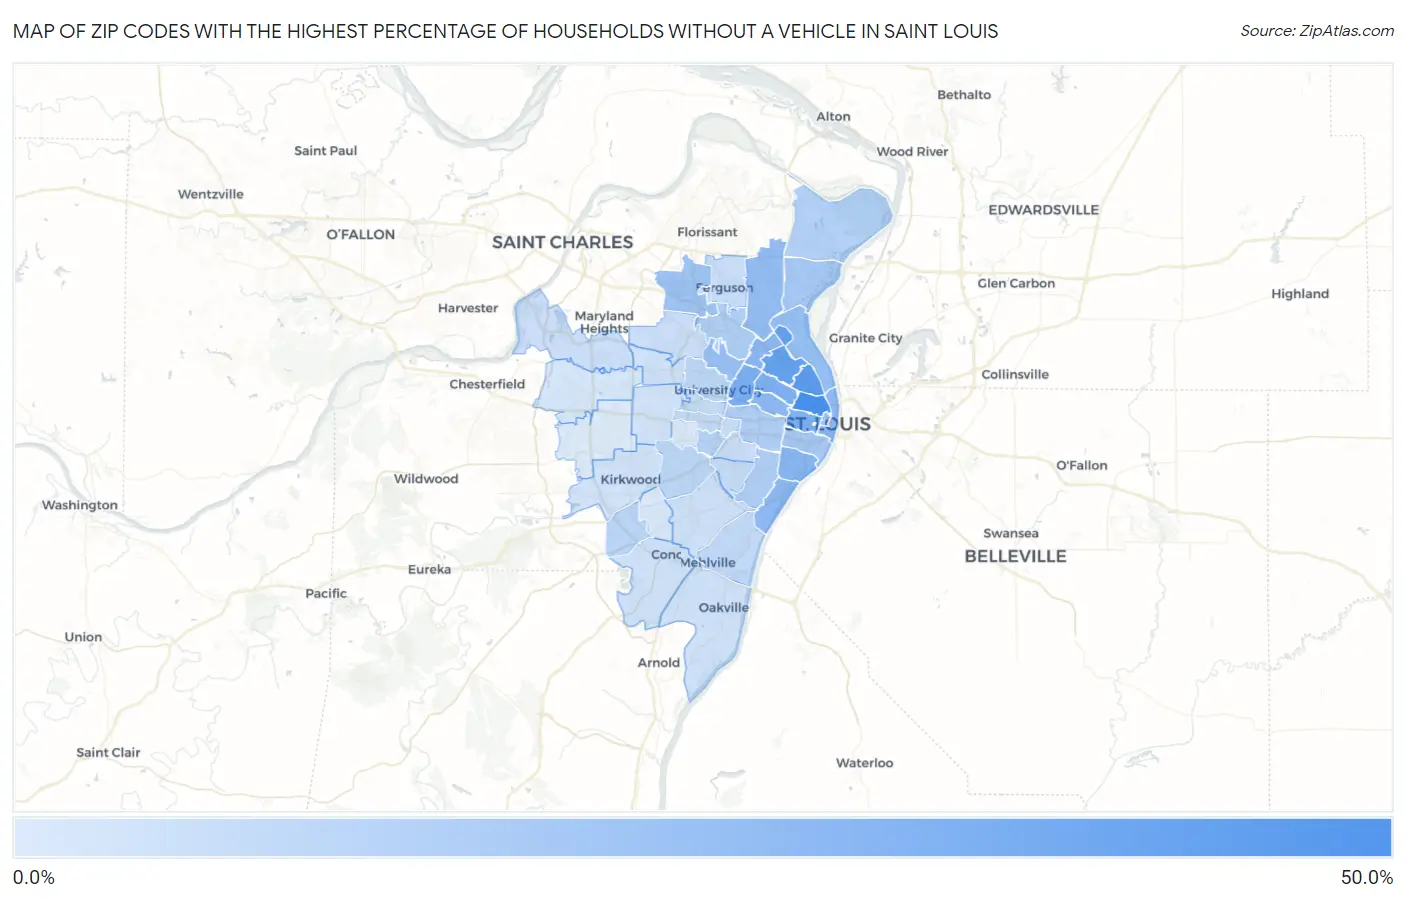
Map of Zip Codes with the Highest Percentage of Households Without a Vehicle in Saint Louis
0.0%
50.0%
Zip Codes with the Highest Percentage of Households Without a Vehicle in Saint Louis, MO
| Zip Code | Housholds Without a Car | vs State | vs National | |
| 1. | 63106 | 43.2% | 6.6%(+36.6)#6 | 8.3%(+34.9)#446 |
| 2. | 63107 | 36.8% | 6.6%(+30.2)#8 | 8.3%(+28.5)#597 |
| 3. | 63115 | 33.8% | 6.6%(+27.2)#9 | 8.3%(+25.5)#663 |
| 4. | 63112 | 26.2% | 6.6%(+19.6)#15 | 8.3%(+17.9)#983 |
| 5. | 63103 | 26.1% | 6.6%(+19.5)#16 | 8.3%(+17.8)#990 |
| 6. | 63113 | 25.6% | 6.6%(+19.0)#18 | 8.3%(+17.3)#1,028 |
| 7. | 63118 | 23.0% | 6.6%(+16.4)#26 | 8.3%(+14.7)#1,214 |
| 8. | 63120 | 22.2% | 6.6%(+15.6)#29 | 8.3%(+13.9)#1,285 |
| 9. | 63108 | 21.5% | 6.6%(+14.9)#31 | 8.3%(+13.2)#1,339 |
| 10. | 63102 | 21.4% | 6.6%(+14.8)#33 | 8.3%(+13.1)#1,349 |
| 11. | 63111 | 21.3% | 6.6%(+14.7)#34 | 8.3%(+13.0)#1,355 |
| 12. | 63136 | 19.5% | 6.6%(+12.9)#40 | 8.3%(+11.2)#1,563 |
| 13. | 63147 | 19.4% | 6.6%(+12.8)#42 | 8.3%(+11.1)#1,581 |
| 14. | 63133 | 18.4% | 6.6%(+11.8)#44 | 8.3%(+10.1)#1,727 |
| 15. | 63101 | 18.0% | 6.6%(+11.4)#46 | 8.3%(+9.70)#1,784 |
| 16. | 63134 | 16.5% | 6.6%(+9.90)#50 | 8.3%(+8.20)#2,057 |
| 17. | 63104 | 14.6% | 6.6%(+8.00)#60 | 8.3%(+6.30)#2,500 |
| 18. | 63137 | 14.5% | 6.6%(+7.90)#62 | 8.3%(+6.20)#2,526 |
| 19. | 63116 | 12.4% | 6.6%(+5.80)#78 | 8.3%(+4.10)#3,358 |
| 20. | 63121 | 12.1% | 6.6%(+5.50)#81 | 8.3%(+3.80)#3,504 |
| 21. | 63110 | 12.0% | 6.6%(+5.40)#82 | 8.3%(+3.70)#3,558 |
| 22. | 63138 | 10.9% | 6.6%(+4.30)#99 | 8.3%(+2.60)#4,194 |
| 23. | 63143 | 10.6% | 6.6%(+4.00)#103 | 8.3%(+2.30)#4,406 |
| 24. | 63127 | 9.1% | 6.6%(+2.50)#149 | 8.3%(+0.800)#5,659 |
| 25. | 63119 | 8.9% | 6.6%(+2.30)#153 | 8.3%(+0.600)#5,836 |
| 26. | 63130 | 8.8% | 6.6%(+2.20)#162 | 8.3%(+0.500)#5,958 |
| 27. | 63125 | 7.3% | 6.6%(+0.700)#234 | 8.3%(-1.00)#8,027 |
| 28. | 63140 | 7.1% | 6.6%(+0.500)#254 | 8.3%(-1.20)#8,510 |
| 29. | 63117 | 6.8% | 6.6%(+0.200)#266 | 8.3%(-1.50)#8,898 |
| 30. | 63109 | 6.5% | 6.6%(-0.100)#293 | 8.3%(-1.80)#9,400 |
| 31. | 63105 | 6.2% | 6.6%(-0.400)#314 | 8.3%(-2.10)#10,035 |
| 32. | 63135 | 6.1% | 6.6%(-0.500)#322 | 8.3%(-2.20)#10,234 |
| 33. | 63114 | 5.5% | 6.6%(-1.10)#361 | 8.3%(-2.80)#11,608 |
| 34. | 63146 | 5.1% | 6.6%(-1.50)#402 | 8.3%(-3.20)#12,601 |
| 35. | 63139 | 5.1% | 6.6%(-1.50)#404 | 8.3%(-3.20)#12,634 |
| 36. | 63128 | 4.3% | 6.6%(-2.30)#470 | 8.3%(-4.00)#14,795 |
| 37. | 63123 | 4.2% | 6.6%(-2.40)#476 | 8.3%(-4.10)#15,082 |
| 38. | 63129 | 4.1% | 6.6%(-2.50)#483 | 8.3%(-4.20)#15,350 |
| 39. | 63132 | 3.9% | 6.6%(-2.70)#517 | 8.3%(-4.40)#16,070 |
| 40. | 63122 | 3.6% | 6.6%(-3.00)#541 | 8.3%(-4.70)#16,977 |
| 41. | 63124 | 3.4% | 6.6%(-3.20)#560 | 8.3%(-4.90)#17,705 |
| 42. | 63141 | 2.2% | 6.6%(-4.40)#692 | 8.3%(-6.10)#21,757 |
| 43. | 63126 | 1.8% | 6.6%(-4.80)#739 | 8.3%(-6.50)#23,162 |
| 44. | 63144 | 1.3% | 6.6%(-5.30)#780 | 8.3%(-7.00)#24,784 |
| 45. | 63131 | 0.80% | 6.6%(-5.80)#822 | 8.3%(-7.50)#26,098 |
1
Common Questions
What are the Top 10 Zip Codes with the Highest Percentage of Households Without a Vehicle in Saint Louis, MO?
Top 10 Zip Codes with the Highest Percentage of Households Without a Vehicle in Saint Louis, MO are:
What zip code has the Highest Percentage of Households Without a Vehicle in Saint Louis, MO?
63106 has the Highest Percentage of Households Without a Vehicle in Saint Louis, MO with 43.2%.
What is the Percentage of Households Without a Vehicle in Missouri?
Percentage of Households Without a Vehicle in Missouri is 6.6%.
What is the Percentage of Households Without a Vehicle in the United States?
Percentage of Households Without a Vehicle in the United States is 8.3%.