Zip Codes with the Highest Percentage of Population Employed in Architecture & Engineering in Saint Louis, MO
RELATED REPORTS & OPTIONS
Architecture & Engineering
Saint Louis
Compare Zip Codes
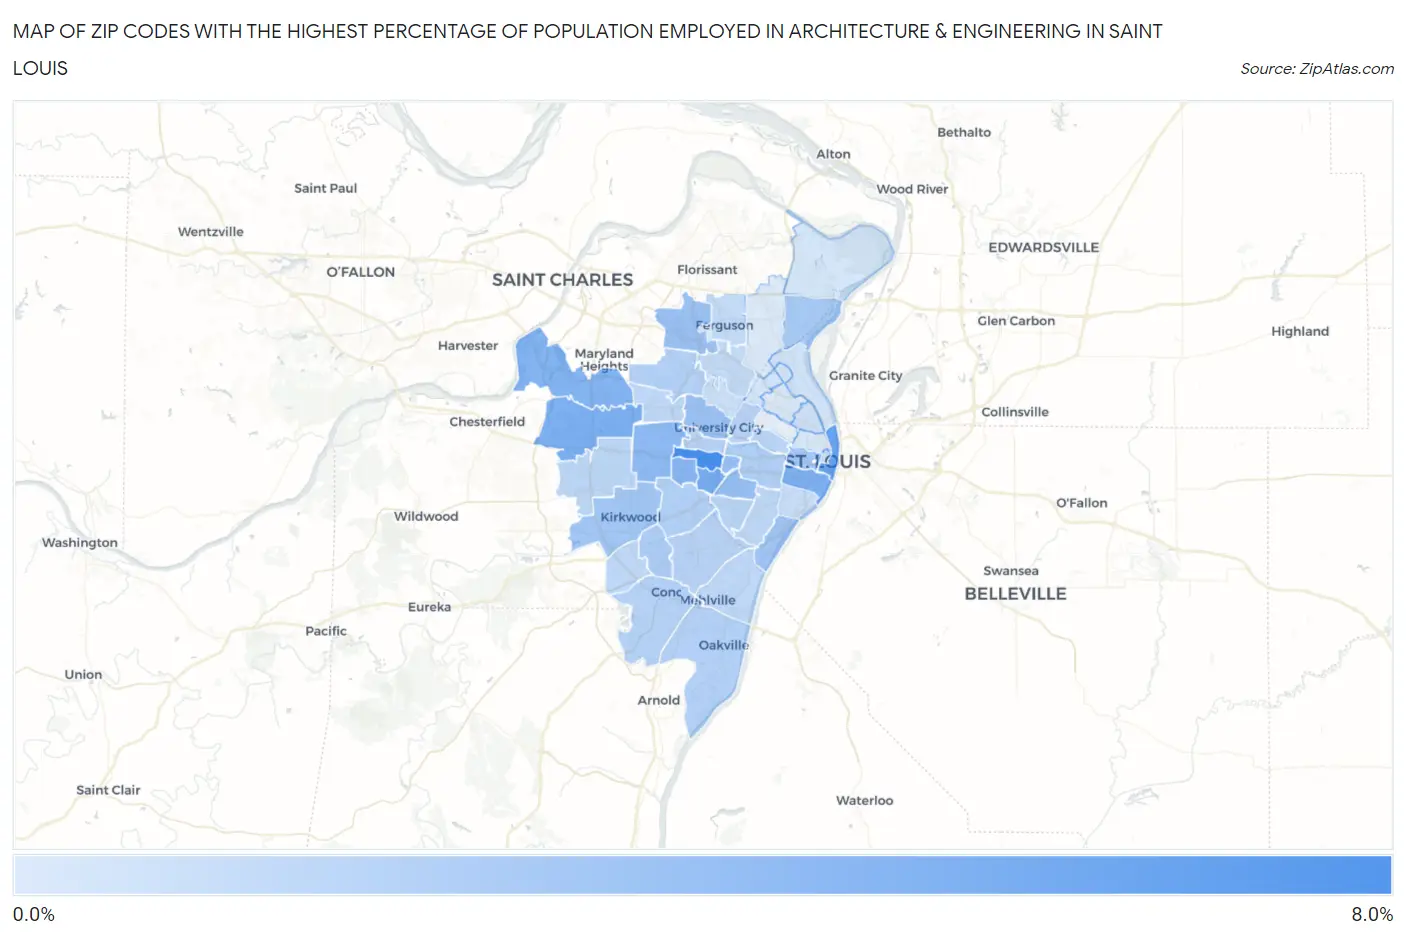
Map of Zip Codes with the Highest Percentage of Population Employed in Architecture & Engineering in Saint Louis
0.0%
8.0%
Zip Codes with the Highest Percentage of Population Employed in Architecture & Engineering in Saint Louis, MO
| Zip Code | % Employed | vs State | vs National | |
| 1. | 63117 | 6.3% | 1.7%(+4.57)#21 | 2.1%(+4.12)#969 |
| 2. | 63102 | 4.9% | 1.7%(+3.18)#32 | 2.1%(+2.73)#1,758 |
| 3. | 63143 | 4.3% | 1.7%(+2.58)#42 | 2.1%(+2.13)#2,387 |
| 4. | 63141 | 4.1% | 1.7%(+2.36)#47 | 2.1%(+1.92)#2,669 |
| 5. | 63104 | 4.0% | 1.7%(+2.31)#49 | 2.1%(+1.86)#2,746 |
| 6. | 63146 | 3.8% | 1.7%(+2.10)#54 | 2.1%(+1.65)#3,086 |
| 7. | 63144 | 3.6% | 1.7%(+1.92)#60 | 2.1%(+1.47)#3,465 |
| 8. | 63124 | 3.3% | 1.7%(+1.63)#69 | 2.1%(+1.18)#4,098 |
| 9. | 63139 | 3.0% | 1.7%(+1.28)#83 | 2.1%(+0.830)#5,123 |
| 10. | 63130 | 2.9% | 1.7%(+1.22)#87 | 2.1%(+0.778)#5,327 |
| 11. | 63134 | 2.8% | 1.7%(+1.12)#96 | 2.1%(+0.679)#5,673 |
| 12. | 63111 | 2.6% | 1.7%(+0.900)#123 | 2.1%(+0.455)#6,565 |
| 13. | 63103 | 2.5% | 1.7%(+0.841)#129 | 2.1%(+0.396)#6,806 |
| 14. | 63122 | 2.5% | 1.7%(+0.795)#133 | 2.1%(+0.350)#7,001 |
| 15. | 63137 | 2.3% | 1.7%(+0.598)#144 | 2.1%(+0.153)#7,928 |
| 16. | 63126 | 2.1% | 1.7%(+0.433)#158 | 2.1%(-0.012)#8,822 |
| 17. | 63110 | 1.9% | 1.7%(+0.234)#188 | 2.1%(-0.211)#9,993 |
| 18. | 63114 | 1.9% | 1.7%(+0.209)#193 | 2.1%(-0.236)#10,147 |
| 19. | 63119 | 1.9% | 1.7%(+0.181)#201 | 2.1%(-0.264)#10,330 |
| 20. | 63129 | 1.8% | 1.7%(+0.143)#205 | 2.1%(-0.302)#10,557 |
| 21. | 63128 | 1.7% | 1.7%(+0.038)#219 | 2.1%(-0.407)#11,221 |
| 22. | 63105 | 1.7% | 1.7%(-0.001)#225 | 2.1%(-0.446)#11,468 |
| 23. | 63123 | 1.7% | 1.7%(-0.018)#230 | 2.1%(-0.463)#11,600 |
| 24. | 63112 | 1.7% | 1.7%(-0.020)#231 | 2.1%(-0.465)#11,609 |
| 25. | 63109 | 1.6% | 1.7%(-0.121)#241 | 2.1%(-0.566)#12,287 |
| 26. | 63108 | 1.6% | 1.7%(-0.130)#243 | 2.1%(-0.574)#12,343 |
| 27. | 63131 | 1.5% | 1.7%(-0.182)#251 | 2.1%(-0.627)#12,713 |
| 28. | 63132 | 1.4% | 1.7%(-0.271)#263 | 2.1%(-0.716)#13,340 |
| 29. | 63127 | 1.4% | 1.7%(-0.275)#266 | 2.1%(-0.720)#13,359 |
| 30. | 63125 | 1.4% | 1.7%(-0.298)#269 | 2.1%(-0.743)#13,545 |
| 31. | 63116 | 1.4% | 1.7%(-0.309)#274 | 2.1%(-0.754)#13,618 |
| 32. | 63121 | 1.3% | 1.7%(-0.433)#293 | 2.1%(-0.878)#14,520 |
| 33. | 63135 | 1.2% | 1.7%(-0.460)#297 | 2.1%(-0.905)#14,722 |
| 34. | 63118 | 1.0% | 1.7%(-0.655)#337 | 2.1%(-1.10)#16,245 |
| 35. | 63133 | 0.87% | 1.7%(-0.836)#381 | 2.1%(-1.28)#17,611 |
| 36. | 63101 | 0.87% | 1.7%(-0.836)#382 | 2.1%(-1.28)#17,617 |
| 37. | 63107 | 0.77% | 1.7%(-0.936)#411 | 2.1%(-1.38)#18,374 |
| 38. | 63147 | 0.66% | 1.7%(-1.04)#435 | 2.1%(-1.49)#19,167 |
| 39. | 63140 | 0.57% | 1.7%(-1.13)#457 | 2.1%(-1.58)#19,829 |
| 40. | 63120 | 0.56% | 1.7%(-1.15)#459 | 2.1%(-1.59)#19,945 |
| 41. | 63138 | 0.50% | 1.7%(-1.21)#468 | 2.1%(-1.65)#20,292 |
| 42. | 63106 | 0.41% | 1.7%(-1.29)#489 | 2.1%(-1.74)#20,883 |
| 43. | 63115 | 0.31% | 1.7%(-1.39)#526 | 2.1%(-1.84)#21,479 |
| 44. | 63136 | 0.24% | 1.7%(-1.47)#542 | 2.1%(-1.91)#21,876 |
1
Common Questions
What are the Top 10 Zip Codes with the Highest Percentage of Population Employed in Architecture & Engineering in Saint Louis, MO?
Top 10 Zip Codes with the Highest Percentage of Population Employed in Architecture & Engineering in Saint Louis, MO are:
What zip code has the Highest Percentage of Population Employed in Architecture & Engineering in Saint Louis, MO?
63117 has the Highest Percentage of Population Employed in Architecture & Engineering in Saint Louis, MO with 6.3%.
What is the Percentage of Population Employed in Architecture & Engineering in Missouri?
Percentage of Population Employed in Architecture & Engineering in Missouri is 1.7%.
What is the Percentage of Population Employed in Architecture & Engineering in the United States?
Percentage of Population Employed in Architecture & Engineering in the United States is 2.1%.