Zip Codes with the Highest Percentage of Population with a Degree in Liberal Arts and History in Saint Louis, MO
RELATED REPORTS & OPTIONS
Liberal Arts and History
Saint Louis
Compare Zip Codes
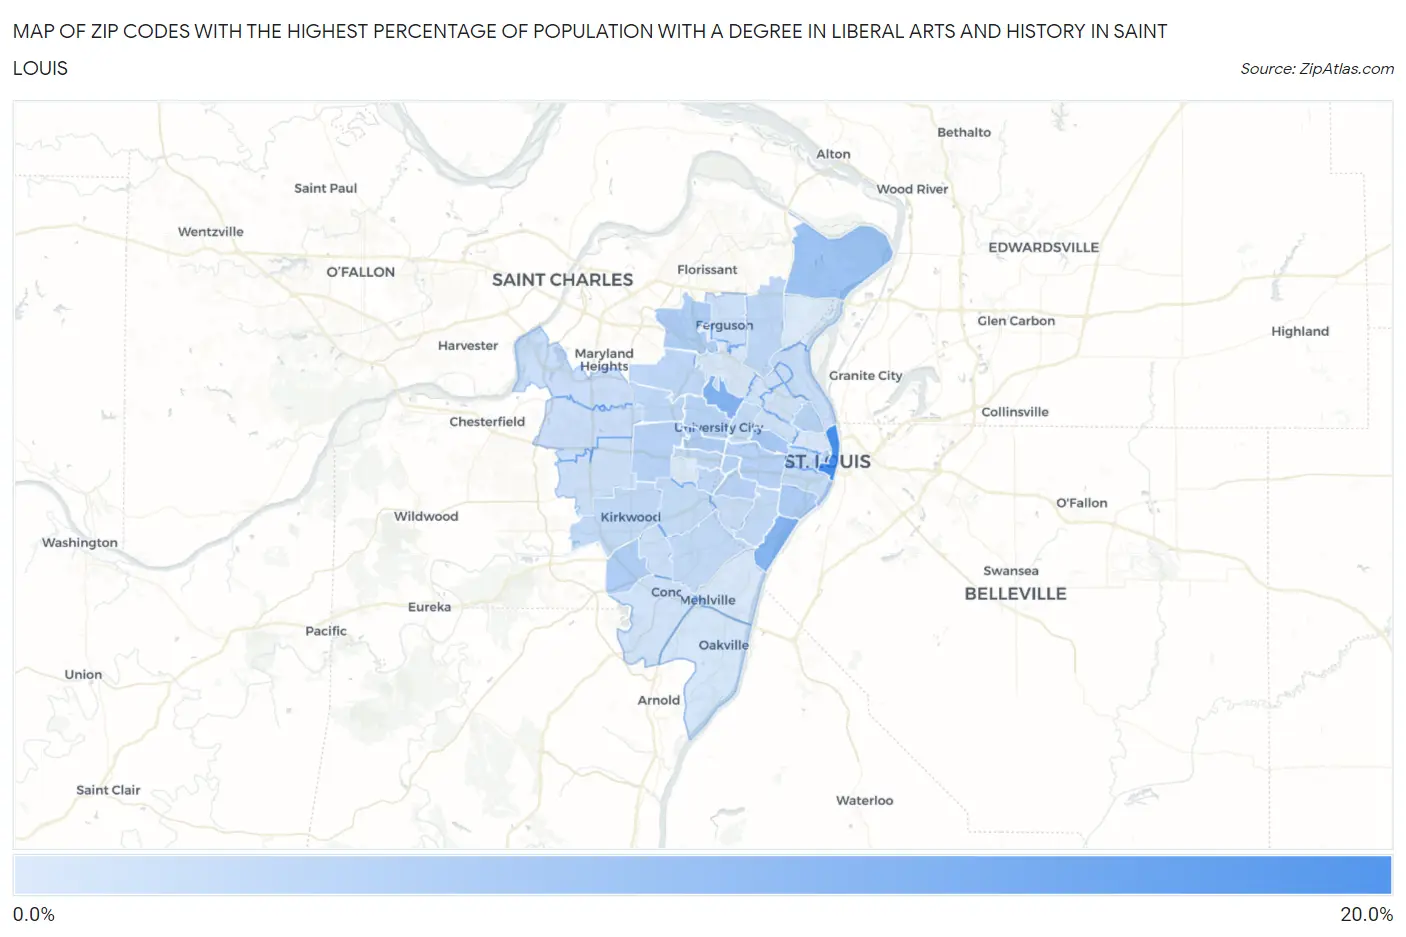
Map of Zip Codes with the Highest Percentage of Population with a Degree in Liberal Arts and History in Saint Louis
0.0%
20.0%
Zip Codes with the Highest Percentage of Population with a Degree in Liberal Arts and History in Saint Louis, MO
| Zip Code | % Graduates | vs State | vs National | |
| 1. | 63102 | 19.8% | 4.6%(+15.2)#31 | 4.9%(+14.9)#884 |
| 2. | 63133 | 12.3% | 4.6%(+7.72)#76 | 4.9%(+7.41)#2,109 |
| 3. | 63111 | 11.8% | 4.6%(+7.26)#80 | 4.9%(+6.96)#2,255 |
| 4. | 63138 | 9.1% | 4.6%(+4.54)#120 | 4.9%(+4.24)#3,738 |
| 5. | 63108 | 8.4% | 4.6%(+3.83)#142 | 4.9%(+3.53)#4,448 |
| 6. | 63105 | 7.3% | 4.6%(+2.74)#172 | 4.9%(+2.44)#5,873 |
| 7. | 63118 | 7.2% | 4.6%(+2.59)#183 | 4.9%(+2.29)#6,117 |
| 8. | 63127 | 7.1% | 4.6%(+2.54)#186 | 4.9%(+2.24)#6,226 |
| 9. | 63134 | 7.1% | 4.6%(+2.49)#188 | 4.9%(+2.18)#6,293 |
| 10. | 63101 | 6.5% | 4.6%(+1.92)#204 | 4.9%(+1.61)#7,366 |
| 11. | 63139 | 6.2% | 4.6%(+1.65)#223 | 4.9%(+1.35)#7,980 |
| 12. | 63124 | 6.2% | 4.6%(+1.62)#225 | 4.9%(+1.32)#8,046 |
| 13. | 63110 | 6.2% | 4.6%(+1.60)#228 | 4.9%(+1.29)#8,108 |
| 14. | 63107 | 6.0% | 4.6%(+1.45)#235 | 4.9%(+1.15)#8,466 |
| 15. | 63130 | 5.9% | 4.6%(+1.30)#242 | 4.9%(+0.995)#8,877 |
| 16. | 63136 | 5.5% | 4.6%(+0.974)#255 | 4.9%(+0.672)#9,737 |
| 17. | 63132 | 5.4% | 4.6%(+0.871)#263 | 4.9%(+0.569)#10,029 |
| 18. | 63114 | 5.4% | 4.6%(+0.840)#266 | 4.9%(+0.538)#10,102 |
| 19. | 63143 | 5.4% | 4.6%(+0.793)#269 | 4.9%(+0.491)#10,231 |
| 20. | 63117 | 5.3% | 4.6%(+0.719)#273 | 4.9%(+0.417)#10,468 |
| 21. | 63116 | 5.0% | 4.6%(+0.415)#294 | 4.9%(+0.114)#11,397 |
| 22. | 63122 | 4.9% | 4.6%(+0.337)#298 | 4.9%(+0.036)#11,614 |
| 23. | 63112 | 4.9% | 4.6%(+0.333)#301 | 4.9%(+0.031)#11,629 |
| 24. | 63123 | 4.9% | 4.6%(+0.328)#302 | 4.9%(+0.026)#11,644 |
| 25. | 63104 | 4.8% | 4.6%(+0.200)#311 | 4.9%(-0.101)#12,064 |
| 26. | 63119 | 4.6% | 4.6%(+0.078)#318 | 4.9%(-0.224)#12,498 |
| 27. | 63147 | 4.4% | 4.6%(-0.157)#333 | 4.9%(-0.458)#13,243 |
| 28. | 63103 | 4.4% | 4.6%(-0.207)#338 | 4.9%(-0.509)#13,412 |
| 29. | 63146 | 4.2% | 4.6%(-0.323)#348 | 4.9%(-0.624)#13,831 |
| 30. | 63141 | 4.1% | 4.6%(-0.501)#363 | 4.9%(-0.803)#14,514 |
| 31. | 63109 | 4.0% | 4.6%(-0.553)#371 | 4.9%(-0.855)#14,710 |
| 32. | 63135 | 4.0% | 4.6%(-0.600)#375 | 4.9%(-0.901)#14,904 |
| 33. | 63126 | 3.9% | 4.6%(-0.698)#391 | 4.9%(-1.000)#15,261 |
| 34. | 63131 | 3.9% | 4.6%(-0.716)#393 | 4.9%(-1.02)#15,312 |
| 35. | 63128 | 3.5% | 4.6%(-1.07)#429 | 4.9%(-1.37)#16,581 |
| 36. | 63115 | 3.4% | 4.6%(-1.13)#433 | 4.9%(-1.43)#16,834 |
| 37. | 63113 | 3.4% | 4.6%(-1.14)#436 | 4.9%(-1.45)#16,895 |
| 38. | 63120 | 3.3% | 4.6%(-1.28)#447 | 4.9%(-1.59)#17,362 |
| 39. | 63129 | 2.8% | 4.6%(-1.73)#486 | 4.9%(-2.04)#18,886 |
| 40. | 63125 | 2.6% | 4.6%(-1.94)#504 | 4.9%(-2.24)#19,534 |
| 41. | 63121 | 2.6% | 4.6%(-1.99)#508 | 4.9%(-2.29)#19,699 |
| 42. | 63106 | 2.4% | 4.6%(-2.20)#523 | 4.9%(-2.50)#20,354 |
| 43. | 63137 | 2.1% | 4.6%(-2.43)#538 | 4.9%(-2.73)#20,986 |
| 44. | 63144 | 2.1% | 4.6%(-2.45)#539 | 4.9%(-2.75)#21,042 |
1
Common Questions
What are the Top 10 Zip Codes with the Highest Percentage of Population with a Degree in Liberal Arts and History in Saint Louis, MO?
Top 10 Zip Codes with the Highest Percentage of Population with a Degree in Liberal Arts and History in Saint Louis, MO are:
What zip code has the Highest Percentage of Population with a Degree in Liberal Arts and History in Saint Louis, MO?
63102 has the Highest Percentage of Population with a Degree in Liberal Arts and History in Saint Louis, MO with 19.8%.
What is the Percentage of Population with a Degree in Liberal Arts and History in Missouri?
Percentage of Population with a Degree in Liberal Arts and History in Missouri is 4.6%.
What is the Percentage of Population with a Degree in Liberal Arts and History in the United States?
Percentage of Population with a Degree in Liberal Arts and History in the United States is 4.9%.