Zip Codes with the Highest Percentage of Population with a Degree in Visual and Performing Arts in Kansas City, MO
RELATED REPORTS & OPTIONS
Visual and Performing Arts
Kansas City
Compare Zip Codes
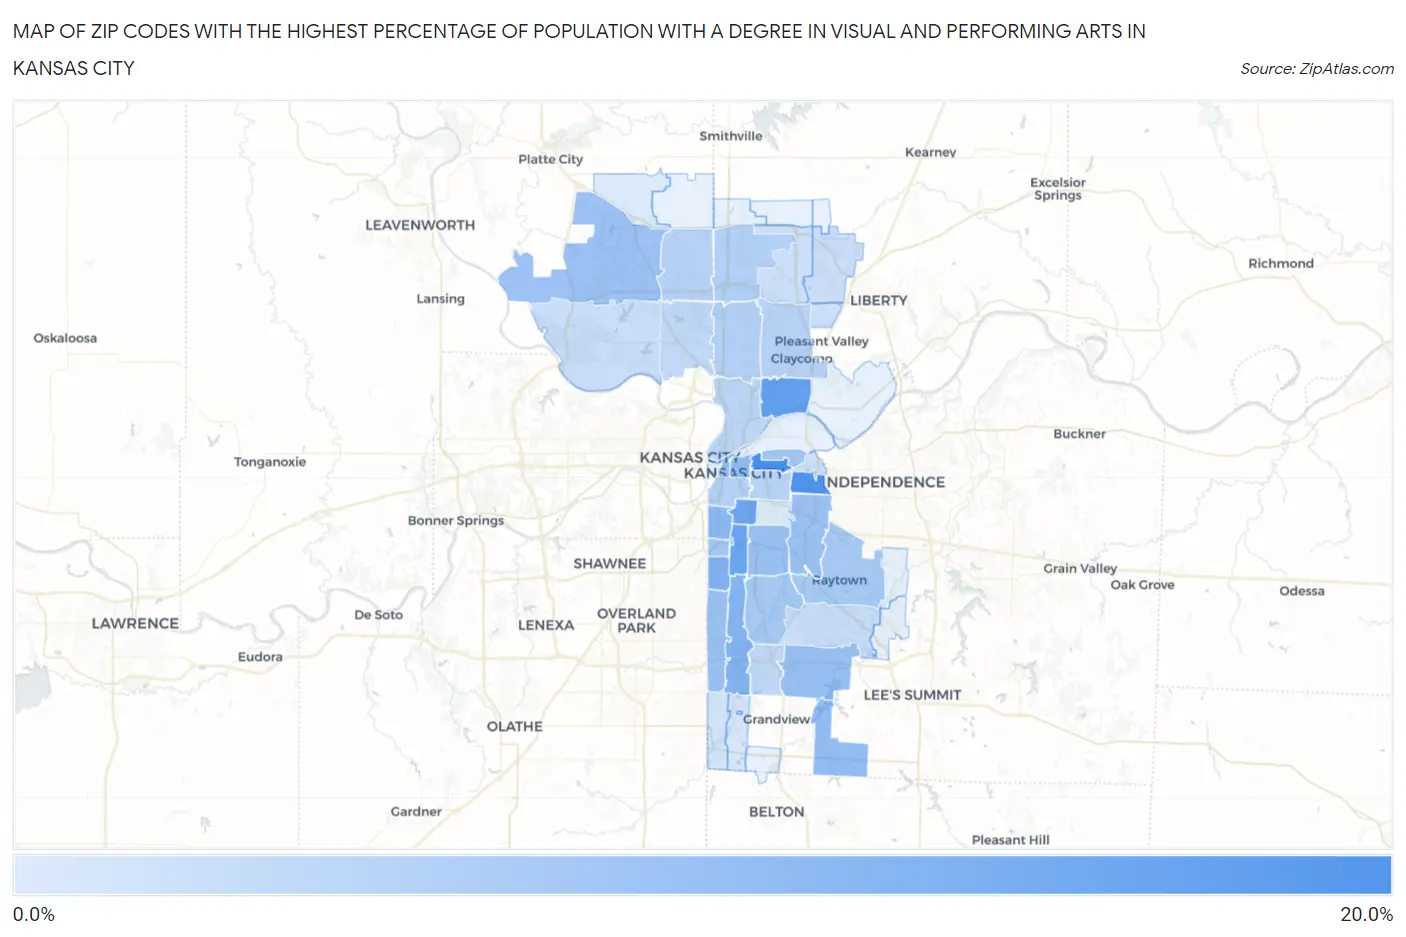
Map of Zip Codes with the Highest Percentage of Population with a Degree in Visual and Performing Arts in Kansas City
0.0%
20.0%
Zip Codes with the Highest Percentage of Population with a Degree in Visual and Performing Arts in Kansas City, MO
| Zip Code | % Graduates | vs State | vs National | |
| 1. | 64124 | 15.1% | 3.8%(+11.3)#26 | 4.3%(+10.8)#805 |
| 2. | 64126 | 14.2% | 3.8%(+10.4)#29 | 4.3%(+9.97)#929 |
| 3. | 64117 | 12.4% | 3.8%(+8.62)#36 | 4.3%(+8.14)#1,212 |
| 4. | 64110 | 11.5% | 3.8%(+7.76)#40 | 4.3%(+7.28)#1,392 |
| 5. | 64109 | 11.2% | 3.8%(+7.44)#41 | 4.3%(+6.95)#1,468 |
| 6. | 64113 | 9.2% | 3.8%(+5.42)#55 | 4.3%(+4.94)#2,172 |
| 7. | 64131 | 9.0% | 3.8%(+5.25)#58 | 4.3%(+4.76)#2,257 |
| 8. | 64111 | 8.4% | 3.8%(+4.61)#68 | 4.3%(+4.13)#2,607 |
| 9. | 64149 | 7.7% | 3.8%(+3.92)#79 | 4.3%(+3.44)#3,073 |
| 10. | 64106 | 7.5% | 3.8%(+3.69)#83 | 4.3%(+3.21)#3,250 |
| 11. | 64134 | 7.3% | 3.8%(+3.52)#88 | 4.3%(+3.04)#3,379 |
| 12. | 64153 | 7.1% | 3.8%(+3.33)#90 | 4.3%(+2.85)#3,552 |
| 13. | 64105 | 7.1% | 3.8%(+3.32)#91 | 4.3%(+2.84)#3,571 |
| 14. | 64130 | 7.0% | 3.8%(+3.24)#92 | 4.3%(+2.76)#3,654 |
| 15. | 64129 | 7.0% | 3.8%(+3.21)#94 | 4.3%(+2.72)#3,684 |
| 16. | 64114 | 6.9% | 3.8%(+3.09)#99 | 4.3%(+2.60)#3,808 |
| 17. | 64123 | 6.2% | 3.8%(+2.41)#113 | 4.3%(+1.93)#4,623 |
| 18. | 64112 | 6.1% | 3.8%(+2.29)#117 | 4.3%(+1.81)#4,777 |
| 19. | 64132 | 5.8% | 3.8%(+2.03)#121 | 4.3%(+1.55)#5,163 |
| 20. | 64133 | 5.7% | 3.8%(+1.92)#127 | 4.3%(+1.44)#5,345 |
| 21. | 64155 | 4.8% | 3.8%(+1.04)#158 | 4.3%(+0.557)#7,057 |
| 22. | 64118 | 4.8% | 3.8%(+0.989)#162 | 4.3%(+0.508)#7,171 |
| 23. | 64108 | 4.6% | 3.8%(+0.847)#167 | 4.3%(+0.366)#7,505 |
| 24. | 64154 | 4.6% | 3.8%(+0.830)#169 | 4.3%(+0.349)#7,556 |
| 25. | 64119 | 4.3% | 3.8%(+0.577)#188 | 4.3%(+0.096)#8,209 |
| 26. | 64127 | 4.0% | 3.8%(+0.254)#221 | 4.3%(-0.227)#9,180 |
| 27. | 64116 | 3.9% | 3.8%(+0.151)#232 | 4.3%(-0.330)#9,493 |
| 28. | 64137 | 3.5% | 3.8%(-0.297)#270 | 4.3%(-0.778)#10,984 |
| 29. | 64151 | 3.4% | 3.8%(-0.340)#277 | 4.3%(-0.821)#11,147 |
| 30. | 64152 | 2.9% | 3.8%(-0.830)#314 | 4.3%(-1.31)#12,952 |
| 31. | 64138 | 2.9% | 3.8%(-0.879)#320 | 4.3%(-1.36)#13,138 |
| 32. | 64157 | 2.7% | 3.8%(-1.07)#336 | 4.3%(-1.55)#13,908 |
| 33. | 64158 | 2.5% | 3.8%(-1.26)#354 | 4.3%(-1.74)#14,565 |
| 34. | 64156 | 2.5% | 3.8%(-1.26)#355 | 4.3%(-1.74)#14,577 |
| 35. | 64125 | 2.2% | 3.8%(-1.57)#385 | 4.3%(-2.05)#15,714 |
| 36. | 64145 | 1.7% | 3.8%(-2.03)#423 | 4.3%(-2.51)#17,345 |
| 37. | 64146 | 1.4% | 3.8%(-2.32)#443 | 4.3%(-2.81)#18,328 |
| 38. | 64163 | 1.1% | 3.8%(-2.67)#472 | 4.3%(-3.15)#19,398 |
| 39. | 64128 | 1.0% | 3.8%(-2.77)#483 | 4.3%(-3.25)#19,656 |
1
Common Questions
What are the Top 10 Zip Codes with the Highest Percentage of Population with a Degree in Visual and Performing Arts in Kansas City, MO?
Top 10 Zip Codes with the Highest Percentage of Population with a Degree in Visual and Performing Arts in Kansas City, MO are:
What zip code has the Highest Percentage of Population with a Degree in Visual and Performing Arts in Kansas City, MO?
64124 has the Highest Percentage of Population with a Degree in Visual and Performing Arts in Kansas City, MO with 15.1%.
What is the Percentage of Population with a Degree in Visual and Performing Arts in Kansas City, MO?
Percentage of Population with a Degree in Visual and Performing Arts in Kansas City is 6.1%.
What is the Percentage of Population with a Degree in Visual and Performing Arts in Missouri?
Percentage of Population with a Degree in Visual and Performing Arts in Missouri is 3.8%.
What is the Percentage of Population with a Degree in Visual and Performing Arts in the United States?
Percentage of Population with a Degree in Visual and Performing Arts in the United States is 4.3%.