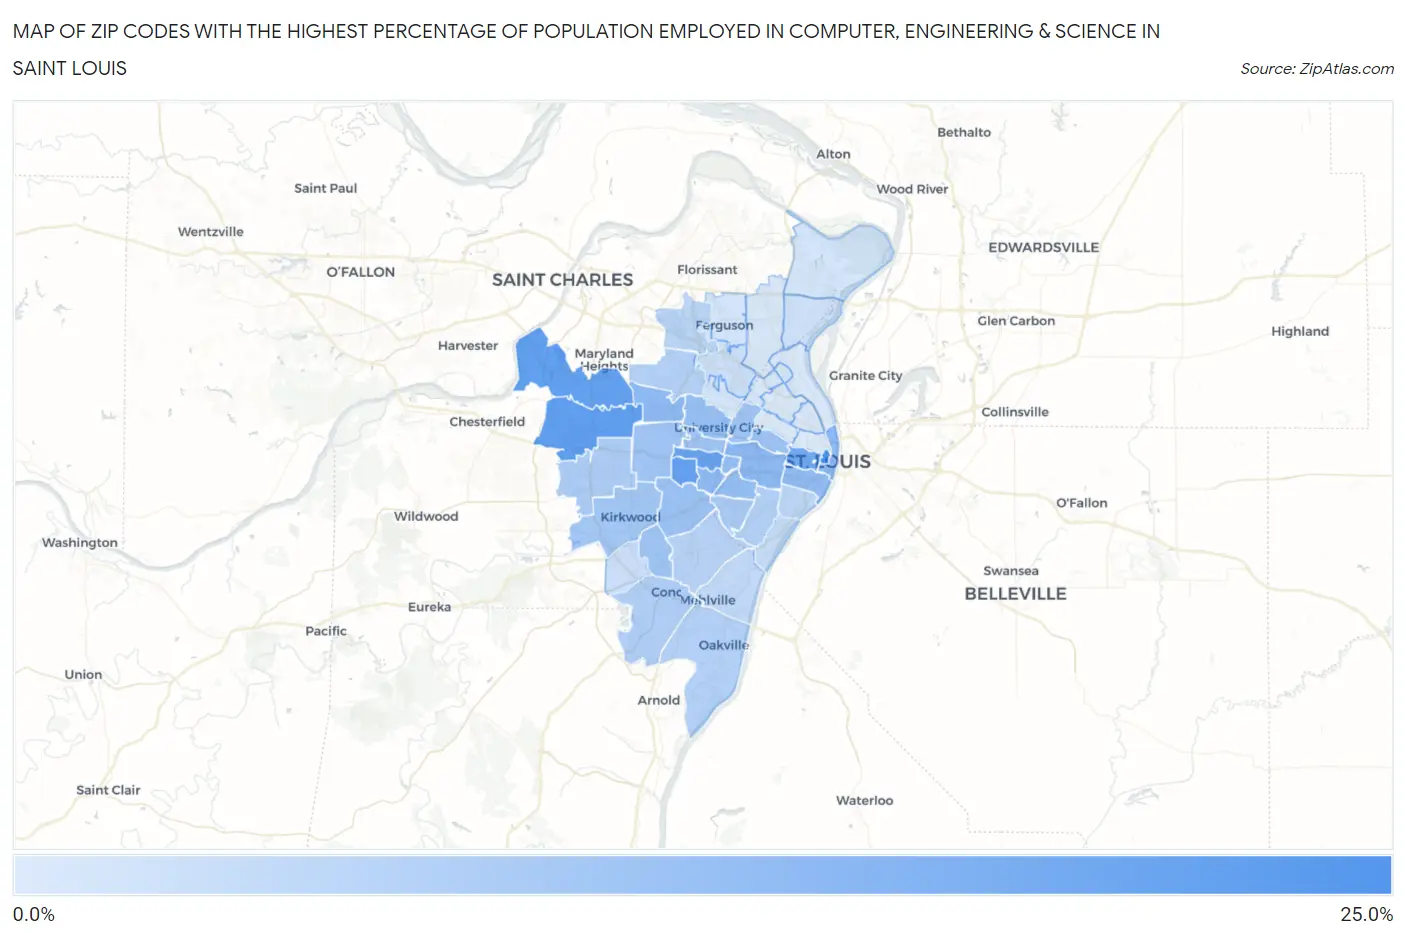
Zip Codes with the Highest Percentage of Population Employed in Computer, Engineering & Science in Saint Louis, MO
RELATED REPORTS & OPTIONS
Computer, Engineering & Science
Saint Louis
Compare Zip Codes
Map of Zip Codes with the Highest Percentage of Population Employed in Computer, Engineering & Science in Saint Louis
0.0%
25.0%
Zip Codes with the Highest Percentage of Population Employed in Computer, Engineering & Science in Saint Louis, MO
| Zip Code | % Employed | vs State | vs National | |
| 1. | 63101 | 21.6% | 5.9%(+15.7)#7 | 6.8%(+14.8)#403 |
| 2. | 63141 | 18.0% | 5.9%(+12.1)#13 | 6.8%(+11.2)#686 |
| 3. | 63146 | 17.7% | 5.9%(+11.9)#15 | 6.8%(+11.0)#723 |
| 4. | 63144 | 17.3% | 5.9%(+11.4)#17 | 6.8%(+10.5)#777 |
| 5. | 63117 | 16.9% | 5.9%(+11.0)#19 | 6.8%(+10.1)#826 |
| 6. | 63103 | 15.4% | 5.9%(+9.53)#24 | 6.8%(+8.64)#1,042 |
| 7. | 63110 | 11.8% | 5.9%(+5.97)#37 | 6.8%(+5.08)#2,112 |
| 8. | 63143 | 11.7% | 5.9%(+5.82)#39 | 6.8%(+4.94)#2,173 |
| 9. | 63102 | 11.5% | 5.9%(+5.66)#40 | 6.8%(+4.77)#2,275 |
| 10. | 63132 | 11.4% | 5.9%(+5.56)#41 | 6.8%(+4.67)#2,332 |
| 11. | 63104 | 11.2% | 5.9%(+5.28)#43 | 6.8%(+4.39)#2,486 |
| 12. | 63139 | 10.7% | 5.9%(+4.80)#47 | 6.8%(+3.92)#2,740 |
| 13. | 63130 | 10.2% | 5.9%(+4.34)#55 | 6.8%(+3.45)#3,056 |
| 14. | 63108 | 9.8% | 5.9%(+3.95)#67 | 6.8%(+3.07)#3,347 |
| 15. | 63119 | 9.8% | 5.9%(+3.88)#68 | 6.8%(+3.00)#3,395 |
| 16. | 63126 | 9.4% | 5.9%(+3.49)#72 | 6.8%(+2.61)#3,711 |
| 17. | 63112 | 9.3% | 5.9%(+3.37)#77 | 6.8%(+2.49)#3,822 |
| 18. | 63124 | 9.0% | 5.9%(+3.16)#81 | 6.8%(+2.27)#4,027 |
| 19. | 63105 | 9.0% | 5.9%(+3.11)#83 | 6.8%(+2.22)#4,080 |
| 20. | 63122 | 9.0% | 5.9%(+3.09)#85 | 6.8%(+2.20)#4,104 |
| 21. | 63109 | 7.9% | 5.9%(+1.98)#111 | 6.8%(+1.09)#5,471 |
| 22. | 63131 | 7.6% | 5.9%(+1.69)#122 | 6.8%(+0.800)#5,892 |
| 23. | 63128 | 7.3% | 5.9%(+1.38)#133 | 6.8%(+0.492)#6,373 |
| 24. | 63114 | 6.8% | 5.9%(+0.925)#144 | 6.8%(+0.040)#7,145 |
| 25. | 63129 | 6.7% | 5.9%(+0.867)#149 | 6.8%(-0.019)#7,253 |
| 26. | 63116 | 6.6% | 5.9%(+0.704)#152 | 6.8%(-0.181)#7,563 |
| 27. | 63123 | 6.2% | 5.9%(+0.356)#162 | 6.8%(-0.530)#8,262 |
| 28. | 63134 | 5.8% | 5.9%(-0.069)#180 | 6.8%(-0.955)#9,275 |
| 29. | 63118 | 5.4% | 5.9%(-0.468)#201 | 6.8%(-1.35)#10,298 |
| 30. | 63125 | 5.0% | 5.9%(-0.892)#223 | 6.8%(-1.78)#11,413 |
| 31. | 63111 | 4.4% | 5.9%(-1.49)#266 | 6.8%(-2.37)#13,205 |
| 32. | 63127 | 3.9% | 5.9%(-1.94)#302 | 6.8%(-2.82)#14,666 |
| 33. | 63121 | 3.6% | 5.9%(-2.26)#335 | 6.8%(-3.15)#15,812 |
| 34. | 63140 | 3.4% | 5.9%(-2.45)#351 | 6.8%(-3.34)#16,529 |
| 35. | 63137 | 3.3% | 5.9%(-2.53)#357 | 6.8%(-3.42)#16,815 |
| 36. | 63135 | 2.7% | 5.9%(-3.19)#437 | 6.8%(-4.08)#19,299 |
| 37. | 63138 | 2.6% | 5.9%(-3.31)#447 | 6.8%(-4.19)#19,765 |
| 38. | 63133 | 2.4% | 5.9%(-3.47)#466 | 6.8%(-4.35)#20,353 |
| 39. | 63120 | 2.3% | 5.9%(-3.61)#485 | 6.8%(-4.50)#20,864 |
| 40. | 63136 | 2.2% | 5.9%(-3.64)#489 | 6.8%(-4.52)#20,957 |
| 41. | 63147 | 2.0% | 5.9%(-3.93)#529 | 6.8%(-4.81)#22,049 |
| 42. | 63115 | 1.9% | 5.9%(-3.96)#531 | 6.8%(-4.84)#22,164 |
| 43. | 63107 | 1.8% | 5.9%(-4.03)#544 | 6.8%(-4.92)#22,433 |
| 44. | 63113 | 1.6% | 5.9%(-4.27)#577 | 6.8%(-5.15)#23,242 |
| 45. | 63106 | 1.5% | 5.9%(-4.34)#585 | 6.8%(-5.23)#23,484 |
1
Common Questions
What are the Top 10 Zip Codes with the Highest Percentage of Population Employed in Computer, Engineering & Science in Saint Louis, MO?
Top 10 Zip Codes with the Highest Percentage of Population Employed in Computer, Engineering & Science in Saint Louis, MO are:
What zip code has the Highest Percentage of Population Employed in Computer, Engineering & Science in Saint Louis, MO?
63101 has the Highest Percentage of Population Employed in Computer, Engineering & Science in Saint Louis, MO with 21.6%.
What is the Percentage of Population Employed in Computer, Engineering & Science in Missouri?
Percentage of Population Employed in Computer, Engineering & Science in Missouri is 5.9%.
What is the Percentage of Population Employed in Computer, Engineering & Science in the United States?
Percentage of Population Employed in Computer, Engineering & Science in the United States is 6.8%.