Zip Codes with the Highest Percentage of Population Employed in Security & Protection in Saint Louis, MO

RELATED REPORTS & OPTIONS

Security & Protection
Population
Families and Households
Female Fertility
Female Fertility (Unmarried)
Race (Community Size)
Race (Percentage)
Ancestry (Community Size)
AfghanAfricanAlbanianAlsatianAmericanArabArgentineanArmenianAustralianAustrianBahamianBelgianBelizeanBermudanBhutaneseBlackfeetBolivianBrazilianBritishBritish West IndianBulgarianBurmeseCajunCanadianCelticCentral AmericanCentral American IndianCherokeeChickasawChileanChippewaChoctawColombianCosta RicanCreekCroatianCubanCzechCzechoslovakianDanishDelawareDominicanDutchEastern EuropeanEcuadorianEgyptianEnglishEthiopianEuropeanFilipinoFinnishFrenchFrench American IndianFrench CanadianGermanGhanaianGreekGuamanian / ChamorroGuatemalanGuyaneseHaitianHonduranHungarianIcelanderIndian (Asian)IndonesianInupiatIranianIraqiIrishIroquoisIsraeliItalianJamaicanJapaneseJordanianKenyanKoreanLaotianLatvianLebaneseLiberianLithuanianLuxembourgerMacedonianMalaysianMalteseMexicanMexican American IndianMongolianMoroccanNative HawaiianNavajoNew ZealanderNicaraguanNigerianNorthern EuropeanNorwegianOsagePakistaniPalestinianPanamanianPennsylvania GermanPeruvianPolishPortuguesePotawatomiPuerto RicanRomanianRussianSalvadoranSamoanScandinavianScotch-IrishScottishSeminoleSenegaleseSerbianSierra LeoneanSiouxSlavicSlovakSloveneSomaliSouth AfricanSouth AmericanSpaniardSpanishSri LankanSubsaharan AfricanSudaneseSwedishSwissSyrianThaiTrinidadian and TobagonianTurkishUgandanUkrainianUruguayanUteVenezuelanWelshWest IndianYugoslavian
Ancestry (Percentage)
AfghanAfricanAlbanianAlsatianAmericanArabArgentineanArmenianAustralianAustrianBahamianBelgianBelizeanBermudanBhutaneseBlackfeetBolivianBrazilianBritishBritish West IndianBulgarianBurmeseCajunCanadianCelticCentral AmericanCentral American IndianCherokeeChickasawChileanChippewaChoctawColombianCosta RicanCreekCroatianCubanCzechCzechoslovakianDanishDelawareDominicanDutchEastern EuropeanEcuadorianEgyptianEnglishEthiopianEuropeanFilipinoFinnishFrenchFrench American IndianFrench CanadianGermanGhanaianGreekGuamanian / ChamorroGuatemalanGuyaneseHaitianHonduranHungarianIcelanderIndian (Asian)IndonesianInupiatIranianIraqiIrishIroquoisIsraeliItalianJamaicanJapaneseJordanianKenyanKoreanLaotianLatvianLebaneseLiberianLithuanianLuxembourgerMacedonianMalaysianMalteseMexicanMexican American IndianMongolianMoroccanNative HawaiianNavajoNew ZealanderNicaraguanNigerianNorthern EuropeanNorwegianOsagePakistaniPalestinianPanamanianPennsylvania GermanPeruvianPolishPortuguesePotawatomiPuerto RicanRomanianRussianSalvadoranSamoanScandinavianScotch-IrishScottishSeminoleSenegaleseSerbianSierra LeoneanSiouxSlavicSlovakSloveneSomaliSouth AfricanSouth AmericanSpaniardSpanishSri LankanSubsaharan AfricanSudaneseSwedishSwissSyrianThaiTrinidadian and TobagonianTurkishUgandanUkrainianUruguayanUteVenezuelanWelshWest IndianYugoslavian
Immigrant Origin (Total)
AfghanistanAfricaAlbaniaArgentinaAsiaAustraliaAustriaBahamasBangladeshBelarusBelgiumBelizeBoliviaBosnia and HerzegovinaBrazilBulgariaBurma / MyanmarCambodiaCanadaCaribbeanCentral AmericaChileChinaColombiaCongoCosta RicaCroatiaCubaCzechoslovakiaDenmarkEastern AfricaEastern AsiaEastern EuropeEcuadorEgyptEl SalvadorEnglandEritreaEthiopiaEuropeFranceGermanyGhanaGreeceGuatemalaGuyanaHaitiHondurasHong KongHungaryIndiaIndonesiaIranIraqIrelandIsraelItalyJamaicaJapanJordanKazakhstanKenyaKoreaKuwaitLaosLatin AmericaLebanonLiberiaMalaysiaMexicoMiddle AfricaMoldovaMoroccoNepalNetherlandsNicaraguaNigeriaNorth MacedoniaNorthern AfricaNorthern EuropeNorwayOceaniaPakistanPanamaPeruPhilippinesPolandRomaniaRussiaSaudi ArabiaScotlandSenegalSerbiaSierra LeoneSingaporeSomaliaSouth AfricaSouth AmericaSouth Central AsiaSouth Eastern AsiaSouthern EuropeSpainSri LankaSudanSwedenSwitzerlandSyriaTaiwanThailandTrinidad and TobagoTurkeyUgandaUkraineUruguayUzbekistanVenezuelaVietnamWestern AfricaWestern AsiaWestern EuropeZaireZimbabwe
Immigrant Origin (Percentage)
AfghanistanAfricaAlbaniaArgentinaAsiaAustraliaAustriaBahamasBangladeshBelarusBelgiumBelizeBoliviaBosnia and HerzegovinaBrazilBulgariaBurma / MyanmarCambodiaCanadaCaribbeanCentral AmericaChileChinaColombiaCongoCosta RicaCroatiaCubaCzechoslovakiaDenmarkEastern AfricaEastern AsiaEastern EuropeEcuadorEgyptEl SalvadorEnglandEritreaEthiopiaEuropeFranceGermanyGhanaGreeceGuatemalaGuyanaHaitiHondurasHong KongHungaryIndiaIndonesiaIranIraqIrelandIsraelItalyJamaicaJapanJordanKazakhstanKenyaKoreaKuwaitLaosLatin AmericaLebanonLiberiaMalaysiaMexicoMiddle AfricaMoldovaMoroccoNepalNetherlandsNicaraguaNigeriaNorth MacedoniaNorthern AfricaNorthern EuropeNorwayOceaniaPakistanPanamaPeruPhilippinesPolandRomaniaRussiaSaudi ArabiaScotlandSenegalSerbiaSierra LeoneSingaporeSomaliaSouth AfricaSouth AmericaSouth Central AsiaSouth Eastern AsiaSouthern EuropeSpainSri LankaSudanSwedenSwitzerlandSyriaTaiwanThailandTrinidad and TobagoTurkeyUgandaUkraineUruguayUzbekistanVenezuelaVietnamWestern AfricaWestern AsiaWestern EuropeZaireZimbabwe
Income
Income (Families)
Income (Households)
Poverty
Poverty (Families)
Unemployment
Employment Occupations
Employment Industries
Employer Class
Commute Time
Commute Means
School Enrollment
Education by Degree Field
Occupancy
Finances
Physical Characteristics
Saint Louis
Compare Zip Codes
Comparison Subject

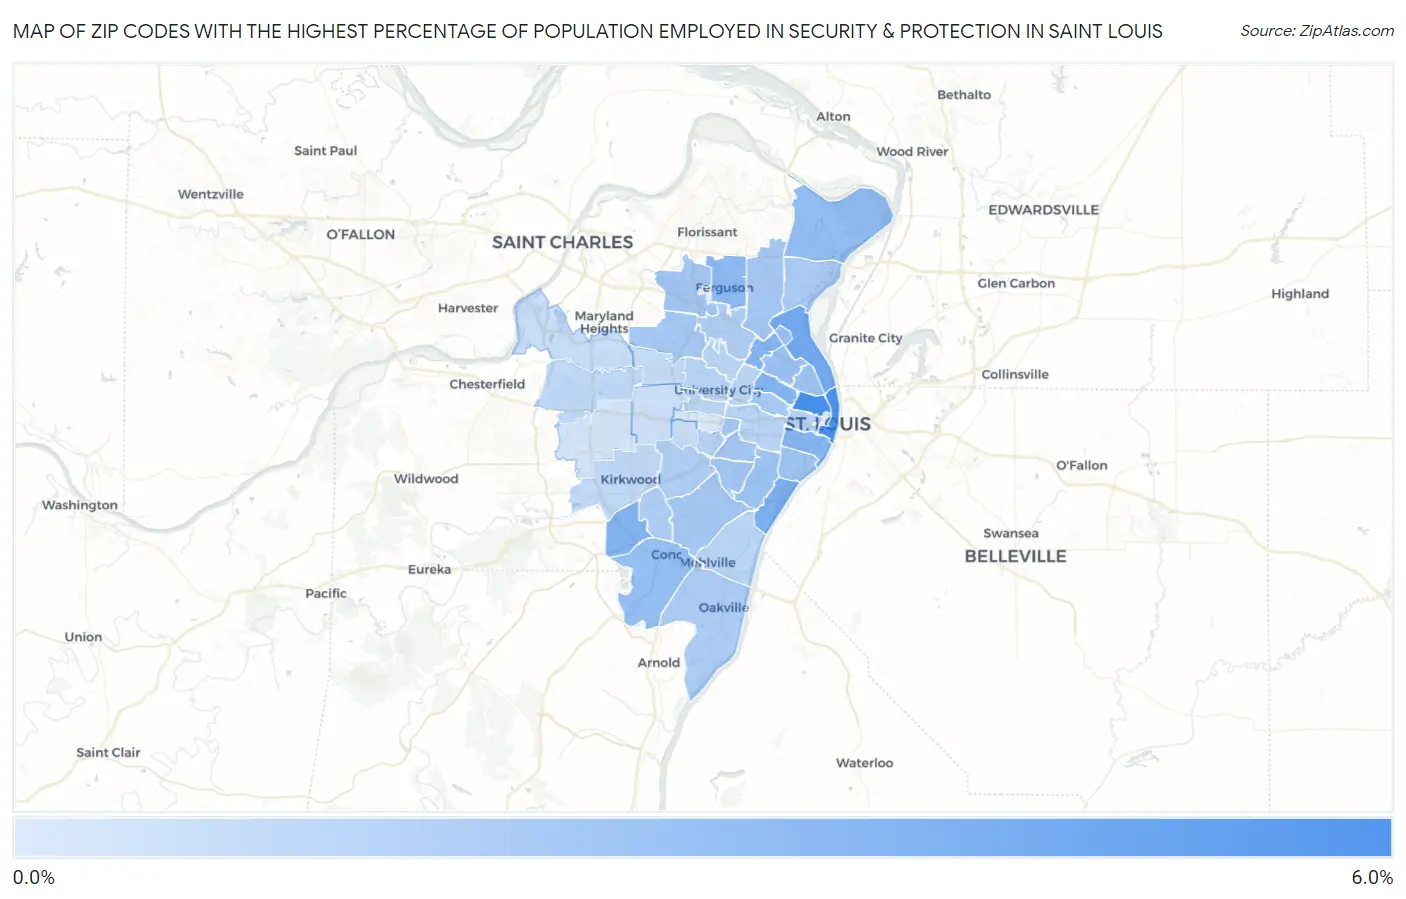
Map of Zip Codes with the Highest Percentage of Population Employed in Security & Protection in Saint Louis

0.0%
6.0%
Zip Codes with the Highest Percentage of Population Employed in Security & Protection in Saint Louis Map

Zip Codes with the Highest Percentage of Population Employed in Security & Protection in Saint Louis, MO

Zip Code % Employed vs State vs National
1.631065.4%1.9%(+3.51)#512.1%(+3.25)#2,542
2.631025.3%1.9%(+3.36)#562.1%(+3.10)#2,677
3.631473.8%1.9%(+1.95)#1002.1%(+1.70)#4,818
4.631113.5%1.9%(+1.57)#1192.1%(+1.32)#5,766
5.631273.3%1.9%(+1.40)#1302.1%(+1.14)#6,268
6.631133.2%1.9%(+1.31)#1392.1%(+1.05)#6,543
7.631203.2%1.9%(+1.30)#1402.1%(+1.04)#6,570
8.631043.1%1.9%(+1.22)#1492.1%(+0.958)#6,869
9.631353.0%1.9%(+1.06)#1662.1%(+0.803)#7,425
10.631382.7%1.9%(+0.829)#1902.1%(+0.572)#8,438
11.631282.7%1.9%(+0.772)#1962.1%(+0.515)#8,698
12.631152.5%1.9%(+0.606)#2212.1%(+0.349)#9,521
13.631162.3%1.9%(+0.452)#2432.1%(+0.195)#10,362
14.631182.3%1.9%(+0.424)#2462.1%(+0.167)#10,552
15.631072.3%1.9%(+0.384)#2522.1%(+0.126)#10,798
16.631342.2%1.9%(+0.290)#2682.1%(+0.033)#11,367
17.631392.2%1.9%(+0.273)#2702.1%(+0.016)#11,487
18.631092.1%1.9%(+0.237)#2802.1%(-0.020)#11,710
19.631142.1%1.9%(+0.214)#2832.1%(-0.043)#11,864
20.631232.1%1.9%(+0.194)#2852.1%(-0.063)#12,004
21.631362.1%1.9%(+0.180)#2892.1%(-0.078)#12,108
22.631082.0%1.9%(+0.093)#3042.1%(-0.164)#12,655
23.631371.9%1.9%(+0.023)#3132.1%(-0.235)#13,124
24.631291.9%1.9%(-0.026)#3322.1%(-0.283)#13,469
25.631261.8%1.9%(-0.136)#3552.1%(-0.393)#14,263
26.631211.7%1.9%(-0.147)#3582.1%(-0.404)#14,357
27.631191.7%1.9%(-0.182)#3672.1%(-0.439)#14,604
28.631431.5%1.9%(-0.435)#4162.1%(-0.692)#16,526
29.631031.4%1.9%(-0.477)#4312.1%(-0.734)#16,843
30.631251.4%1.9%(-0.498)#4382.1%(-0.755)#16,999
31.631331.4%1.9%(-0.508)#4402.1%(-0.765)#17,079
32.631301.4%1.9%(-0.519)#4422.1%(-0.776)#17,172
33.631101.3%1.9%(-0.571)#4572.1%(-0.828)#17,576
34.631051.3%1.9%(-0.587)#4632.1%(-0.844)#17,698
35.631121.3%1.9%(-0.596)#4642.1%(-0.853)#17,772
36.631411.2%1.9%(-0.704)#4872.1%(-0.961)#18,607
37.631221.1%1.9%(-0.793)#5082.1%(-1.05)#19,297
38.631320.92%1.9%(-0.967)#5602.1%(-1.22)#20,617
39.631460.89%1.9%(-1.01)#5672.1%(-1.26)#20,881
40.631440.77%1.9%(-1.12)#5902.1%(-1.38)#21,594
41.631240.74%1.9%(-1.15)#5942.1%(-1.41)#21,811
42.631310.52%1.9%(-1.37)#6382.1%(-1.63)#23,118
43.631170.17%1.9%(-1.72)#6912.1%(-1.98)#24,594

Common Questions

What are the Top 10 Zip Codes with the Highest Percentage of Population Employed in Security & Protection in Saint Louis, MO?
Top 10 Zip Codes with the Highest Percentage of Population Employed in Security & Protection in Saint Louis, MO are:
#1
5.4%
#2
5.3%
#3
3.8%
#4
3.5%
#5
3.3%
#6
3.2%
#7
3.2%
#8
3.1%
#9
3.0%
#10
2.7%
What zip code has the Highest Percentage of Population Employed in Security & Protection in Saint Louis, MO?
63106 has the Highest Percentage of Population Employed in Security & Protection in Saint Louis, MO with 5.4%.
What is the Percentage of Population Employed in Security & Protection in Missouri?
Percentage of Population Employed in Security & Protection in Missouri is 1.9%.
What is the Percentage of Population Employed in Security & Protection in the United States?
Percentage of Population Employed in Security & Protection in the United States is 2.1%.