Zip Codes with the Highest Percentage of Population with a Degree in Communications in Saint Louis, MO

RELATED REPORTS & OPTIONS

Communications
Population
Families and Households
Female Fertility
Female Fertility (Unmarried)
Race (Community Size)
Race (Percentage)
Ancestry (Community Size)
AfghanAfricanAlbanianAlsatianAmericanArabArgentineanArmenianAustralianAustrianBahamianBelgianBelizeanBermudanBhutaneseBlackfeetBolivianBrazilianBritishBritish West IndianBulgarianBurmeseCajunCanadianCelticCentral AmericanCentral American IndianCherokeeChickasawChileanChippewaChoctawColombianCosta RicanCreekCroatianCubanCzechCzechoslovakianDanishDelawareDominicanDutchEastern EuropeanEcuadorianEgyptianEnglishEthiopianEuropeanFilipinoFinnishFrenchFrench American IndianFrench CanadianGermanGhanaianGreekGuamanian / ChamorroGuatemalanGuyaneseHaitianHonduranHungarianIcelanderIndian (Asian)IndonesianInupiatIranianIraqiIrishIroquoisIsraeliItalianJamaicanJapaneseJordanianKenyanKoreanLaotianLatvianLebaneseLiberianLithuanianLuxembourgerMacedonianMalaysianMalteseMexicanMexican American IndianMongolianMoroccanNative HawaiianNavajoNew ZealanderNicaraguanNigerianNorthern EuropeanNorwegianOsagePakistaniPalestinianPanamanianPennsylvania GermanPeruvianPolishPortuguesePotawatomiPuerto RicanRomanianRussianSalvadoranSamoanScandinavianScotch-IrishScottishSeminoleSenegaleseSerbianSierra LeoneanSiouxSlavicSlovakSloveneSomaliSouth AfricanSouth AmericanSpaniardSpanishSri LankanSubsaharan AfricanSudaneseSwedishSwissSyrianThaiTrinidadian and TobagonianTurkishUgandanUkrainianUruguayanUteVenezuelanWelshWest IndianYugoslavian
Ancestry (Percentage)
AfghanAfricanAlbanianAlsatianAmericanArabArgentineanArmenianAustralianAustrianBahamianBelgianBelizeanBermudanBhutaneseBlackfeetBolivianBrazilianBritishBritish West IndianBulgarianBurmeseCajunCanadianCelticCentral AmericanCentral American IndianCherokeeChickasawChileanChippewaChoctawColombianCosta RicanCreekCroatianCubanCzechCzechoslovakianDanishDelawareDominicanDutchEastern EuropeanEcuadorianEgyptianEnglishEthiopianEuropeanFilipinoFinnishFrenchFrench American IndianFrench CanadianGermanGhanaianGreekGuamanian / ChamorroGuatemalanGuyaneseHaitianHonduranHungarianIcelanderIndian (Asian)IndonesianInupiatIranianIraqiIrishIroquoisIsraeliItalianJamaicanJapaneseJordanianKenyanKoreanLaotianLatvianLebaneseLiberianLithuanianLuxembourgerMacedonianMalaysianMalteseMexicanMexican American IndianMongolianMoroccanNative HawaiianNavajoNew ZealanderNicaraguanNigerianNorthern EuropeanNorwegianOsagePakistaniPalestinianPanamanianPennsylvania GermanPeruvianPolishPortuguesePotawatomiPuerto RicanRomanianRussianSalvadoranSamoanScandinavianScotch-IrishScottishSeminoleSenegaleseSerbianSierra LeoneanSiouxSlavicSlovakSloveneSomaliSouth AfricanSouth AmericanSpaniardSpanishSri LankanSubsaharan AfricanSudaneseSwedishSwissSyrianThaiTrinidadian and TobagonianTurkishUgandanUkrainianUruguayanUteVenezuelanWelshWest IndianYugoslavian
Immigrant Origin (Total)
AfghanistanAfricaAlbaniaArgentinaAsiaAustraliaAustriaBahamasBangladeshBelarusBelgiumBelizeBoliviaBosnia and HerzegovinaBrazilBulgariaBurma / MyanmarCambodiaCanadaCaribbeanCentral AmericaChileChinaColombiaCongoCosta RicaCroatiaCubaCzechoslovakiaDenmarkEastern AfricaEastern AsiaEastern EuropeEcuadorEgyptEl SalvadorEnglandEritreaEthiopiaEuropeFranceGermanyGhanaGreeceGuatemalaGuyanaHaitiHondurasHong KongHungaryIndiaIndonesiaIranIraqIrelandIsraelItalyJamaicaJapanJordanKazakhstanKenyaKoreaKuwaitLaosLatin AmericaLebanonLiberiaMalaysiaMexicoMiddle AfricaMoldovaMoroccoNepalNetherlandsNicaraguaNigeriaNorth MacedoniaNorthern AfricaNorthern EuropeNorwayOceaniaPakistanPanamaPeruPhilippinesPolandRomaniaRussiaSaudi ArabiaScotlandSenegalSerbiaSierra LeoneSingaporeSomaliaSouth AfricaSouth AmericaSouth Central AsiaSouth Eastern AsiaSouthern EuropeSpainSri LankaSudanSwedenSwitzerlandSyriaTaiwanThailandTrinidad and TobagoTurkeyUgandaUkraineUruguayUzbekistanVenezuelaVietnamWestern AfricaWestern AsiaWestern EuropeZaireZimbabwe
Immigrant Origin (Percentage)
AfghanistanAfricaAlbaniaArgentinaAsiaAustraliaAustriaBahamasBangladeshBelarusBelgiumBelizeBoliviaBosnia and HerzegovinaBrazilBulgariaBurma / MyanmarCambodiaCanadaCaribbeanCentral AmericaChileChinaColombiaCongoCosta RicaCroatiaCubaCzechoslovakiaDenmarkEastern AfricaEastern AsiaEastern EuropeEcuadorEgyptEl SalvadorEnglandEritreaEthiopiaEuropeFranceGermanyGhanaGreeceGuatemalaGuyanaHaitiHondurasHong KongHungaryIndiaIndonesiaIranIraqIrelandIsraelItalyJamaicaJapanJordanKazakhstanKenyaKoreaKuwaitLaosLatin AmericaLebanonLiberiaMalaysiaMexicoMiddle AfricaMoldovaMoroccoNepalNetherlandsNicaraguaNigeriaNorth MacedoniaNorthern AfricaNorthern EuropeNorwayOceaniaPakistanPanamaPeruPhilippinesPolandRomaniaRussiaSaudi ArabiaScotlandSenegalSerbiaSierra LeoneSingaporeSomaliaSouth AfricaSouth AmericaSouth Central AsiaSouth Eastern AsiaSouthern EuropeSpainSri LankaSudanSwedenSwitzerlandSyriaTaiwanThailandTrinidad and TobagoTurkeyUgandaUkraineUruguayUzbekistanVenezuelaVietnamWestern AfricaWestern AsiaWestern EuropeZaireZimbabwe
Income
Income (Families)
Income (Households)
Poverty
Poverty (Families)
Unemployment
Employment Occupations
Employment Industries
Employer Class
Commute Time
Commute Means
School Enrollment
Education by Degree Field
Occupancy
Finances
Physical Characteristics
Saint Louis
Compare Zip Codes
Comparison Subject

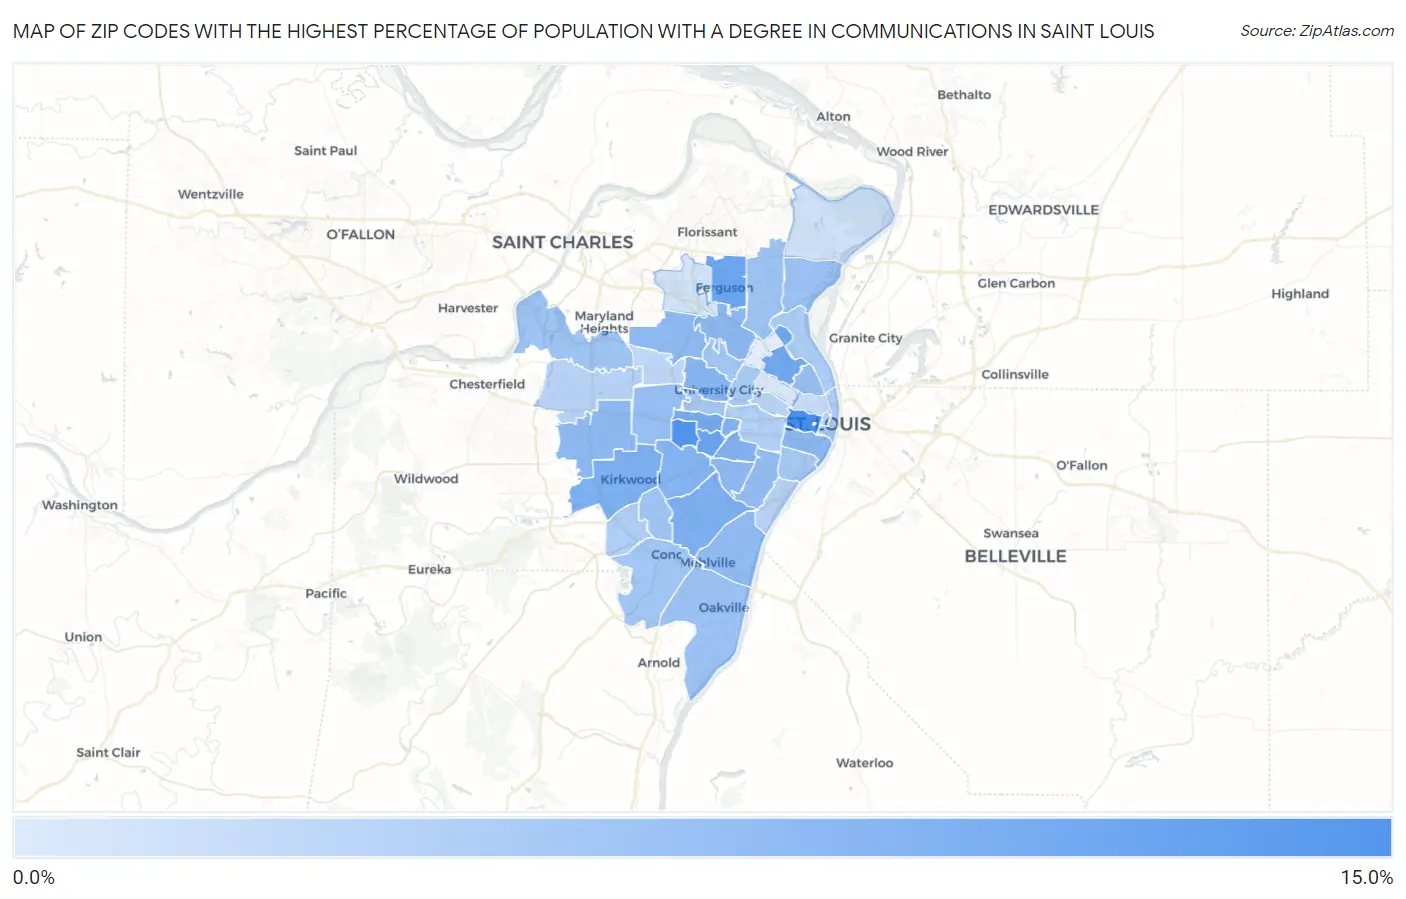
Map of Zip Codes with the Highest Percentage of Population with a Degree in Communications in Saint Louis

0.0%
15.0%
Zip Codes with the Highest Percentage of Population with a Degree in Communications in Saint Louis Map

Zip Codes with the Highest Percentage of Population with a Degree in Communications in Saint Louis, MO

Zip Code % Graduates vs State vs National
1.6310310.9%4.4%(+6.52)#404.1%(+6.76)#994
2.6314410.3%4.4%(+5.90)#444.1%(+6.15)#1,090
3.631438.5%4.4%(+4.12)#544.1%(+4.36)#1,632
4.631358.4%4.4%(+4.02)#564.1%(+4.26)#1,679
5.631157.9%4.4%(+3.55)#634.1%(+3.79)#1,926
6.631177.6%4.4%(+3.23)#684.1%(+3.47)#2,128
7.631237.2%4.4%(+2.86)#764.1%(+3.11)#2,406
8.631227.2%4.4%(+2.78)#784.1%(+3.02)#2,467
9.631396.9%4.4%(+2.50)#854.1%(+2.75)#2,720
10.631196.8%4.4%(+2.40)#934.1%(+2.64)#2,812
11.631306.6%4.4%(+2.23)#974.1%(+2.47)#3,016
12.631216.4%4.4%(+1.97)#1024.1%(+2.22)#3,313
13.631046.3%4.4%(+1.95)#1034.1%(+2.19)#3,332
14.631096.2%4.4%(+1.85)#1064.1%(+2.09)#3,461
15.631146.2%4.4%(+1.79)#1124.1%(+2.03)#3,529
16.631316.1%4.4%(+1.71)#1174.1%(+1.95)#3,651
17.631256.0%4.4%(+1.58)#1244.1%(+1.83)#3,842
18.631165.9%4.4%(+1.52)#1264.1%(+1.77)#3,937
19.631075.5%4.4%(+1.14)#1404.1%(+1.39)#4,607
20.631245.5%4.4%(+1.12)#1414.1%(+1.36)#4,646
21.631375.4%4.4%(+1.02)#1454.1%(+1.27)#4,837
22.631295.4%4.4%(+1.02)#1464.1%(+1.26)#4,851
23.631365.1%4.4%(+0.710)#1594.1%(+0.952)#5,490
24.631465.1%4.4%(+0.697)#1604.1%(+0.939)#5,521
25.631264.9%4.4%(+0.521)#1704.1%(+0.762)#5,923
26.631334.9%4.4%(+0.480)#1724.1%(+0.722)#6,049
27.631284.8%4.4%(+0.398)#1774.1%(+0.640)#6,237
28.631054.7%4.4%(+0.275)#1904.1%(+0.517)#6,537
29.631184.6%4.4%(+0.259)#1914.1%(+0.501)#6,587
30.631124.4%4.4%(-0.011)#2064.1%(+0.231)#7,354
31.631474.3%4.4%(-0.101)#2134.1%(+0.141)#7,652
32.631024.2%4.4%(-0.134)#2184.1%(+0.108)#7,762
33.631273.9%4.4%(-0.453)#2374.1%(-0.211)#8,831
34.631103.7%4.4%(-0.636)#2494.1%(-0.394)#9,485
35.631013.6%4.4%(-0.737)#2524.1%(-0.495)#9,835
36.631113.5%4.4%(-0.852)#2674.1%(-0.610)#10,230
37.631413.5%4.4%(-0.896)#2684.1%(-0.654)#10,404
38.631083.4%4.4%(-0.944)#2714.1%(-0.702)#10,581
39.631323.1%4.4%(-1.25)#2924.1%(-1.01)#11,756
40.631062.5%4.4%(-1.83)#3334.1%(-1.59)#13,978
41.631382.0%4.4%(-2.36)#3684.1%(-2.12)#15,806
42.631341.7%4.4%(-2.65)#3934.1%(-2.41)#16,804
43.631131.2%4.4%(-3.19)#4404.1%(-2.95)#18,446

Common Questions

What are the Top 10 Zip Codes with the Highest Percentage of Population with a Degree in Communications in Saint Louis, MO?
Top 10 Zip Codes with the Highest Percentage of Population with a Degree in Communications in Saint Louis, MO are:
#1
10.9%
#2
10.3%
#3
8.5%
#4
8.4%
#5
7.9%
#6
7.6%
#7
7.2%
#8
7.2%
#9
6.9%
#10
6.8%
What zip code has the Highest Percentage of Population with a Degree in Communications in Saint Louis, MO?
63103 has the Highest Percentage of Population with a Degree in Communications in Saint Louis, MO with 10.9%.
What is the Percentage of Population with a Degree in Communications in Missouri?
Percentage of Population with a Degree in Communications in Missouri is 4.4%.
What is the Percentage of Population with a Degree in Communications in the United States?
Percentage of Population with a Degree in Communications in the United States is 4.1%.