Zip Codes with the Highest Percentage of Population with a Degree in Communications in Florissant, MO
RELATED REPORTS & OPTIONS
Communications
Florissant
Compare Zip Codes
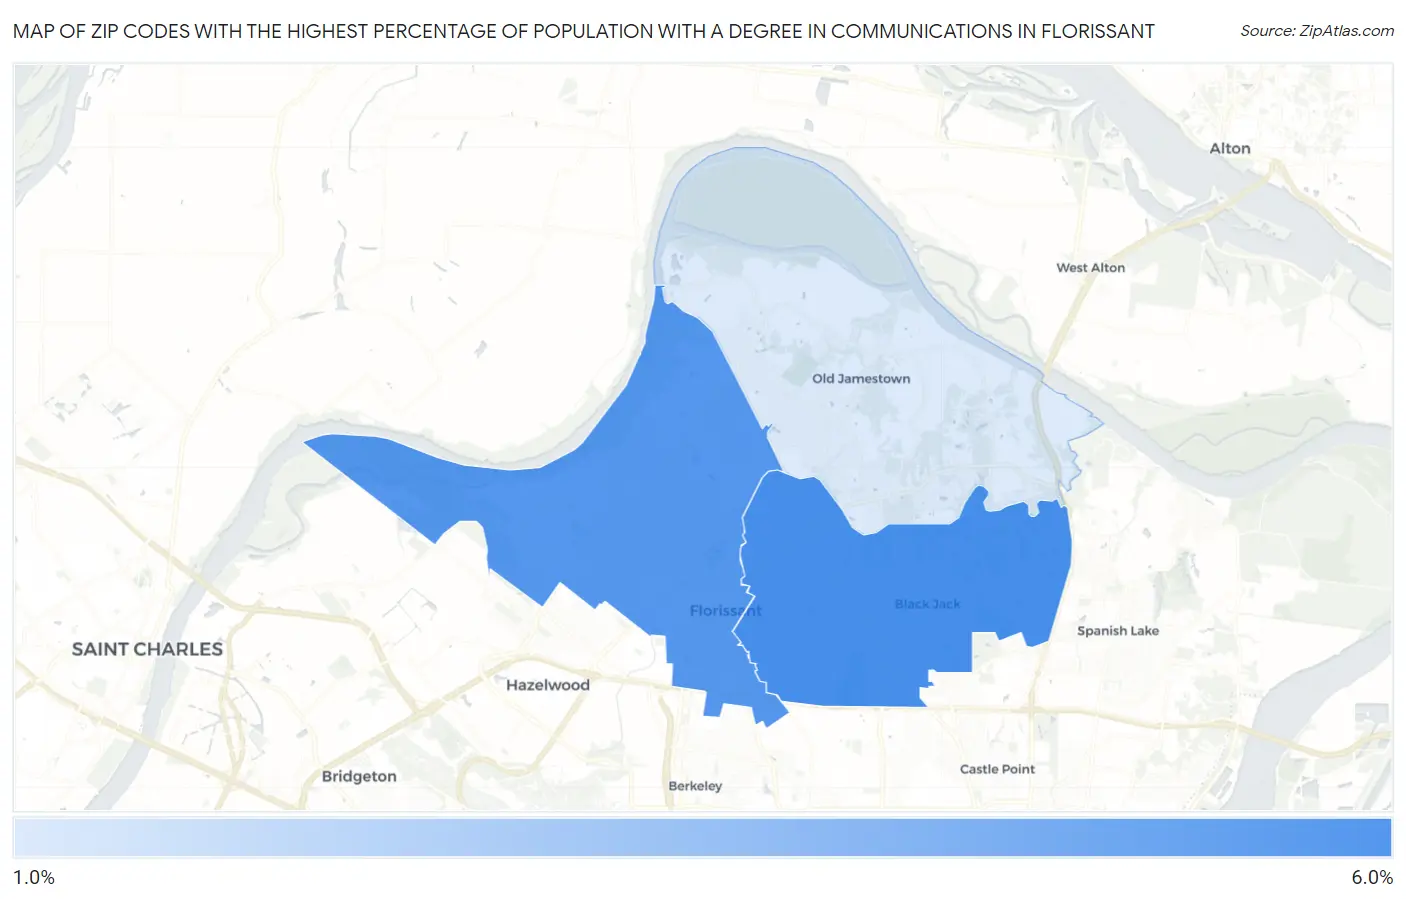
Map of Zip Codes with the Highest Percentage of Population with a Degree in Communications in Florissant
0.0%
6.0%
Zip Codes with the Highest Percentage of Population with a Degree in Communications in Florissant, MO
| Zip Code | % Graduates | vs State | vs National | |
| 1. | 63033 | 5.1% | 4.4%(+0.688)#161 | 4.1%(+0.930)#5,537 |
| 2. | 63031 | 4.8% | 4.4%(+0.391)#178 | 4.1%(+0.632)#6,253 |
| 3. | 63034 | 1.6% | 4.4%(-2.77)#403 | 4.1%(-2.53)#17,175 |
1
Common Questions
What are the Top Zip Codes with the Highest Percentage of Population with a Degree in Communications in Florissant, MO?
Top Zip Codes with the Highest Percentage of Population with a Degree in Communications in Florissant, MO are:
What zip code has the Highest Percentage of Population with a Degree in Communications in Florissant, MO?
63033 has the Highest Percentage of Population with a Degree in Communications in Florissant, MO with 5.1%.
What is the Percentage of Population with a Degree in Communications in Florissant, MO?
Percentage of Population with a Degree in Communications in Florissant is 5.1%.
What is the Percentage of Population with a Degree in Communications in Missouri?
Percentage of Population with a Degree in Communications in Missouri is 4.4%.
What is the Percentage of Population with a Degree in Communications in the United States?
Percentage of Population with a Degree in Communications in the United States is 4.1%.