Immigrants from Hungary vs Subsaharan African Wage/Income Gap

COMPARE

Immigrants from Hungary
Race
Ancestry
AfghanAfricanAlaska NativeAlaskan AthabascanAlbanianAleutAlsatianAmericanApacheArabArapahoArgentineanArmenianAssyrian/Chaldean/SyriacAustralianAustrianBahamianBangladeshiBarbadianBasqueBelgianBelizeanBermudanBhutaneseBlackfeetBolivianBrazilianBritishBritish West IndianBulgarianBurmeseCajunCambodianCanadianCape VerdeanCarpatho RusynCelticCentral AmericanCentral American IndianCherokeeCheyenneChickasawChileanChineseChippewaChoctawColombianColvilleComancheCosta RicanCreeCreekCroatianCrowCubanCypriotCzechCzechoslovakianDanishDelawareDominicanDutchDutch West IndianEastern EuropeanEcuadorianEgyptianEnglishEstonianEthiopianEuropeanFijianFilipinoFinnishFrenchFrench American IndianFrench CanadianGermanGerman RussianGhanaianGreekGuamanian/ChamorroGuatemalanGuyaneseHaitianHmongHonduranHopiHoumaHungarianIcelanderIndian (Asian)IndonesianInupiatIranianIraqiIrishIroquoisIsraeliItalianJamaicanJapaneseJordanianKenyanKiowaKoreanLaotianLatvianLebaneseLiberianLithuanianLumbeeLuxembourgerMacedonianMalaysianMalteseMarshalleseMenomineeMexicanMexican American IndianMongolianMoroccanNative HawaiianNavajoNepaleseNew ZealanderNicaraguanNigerianNorthern EuropeanNorwegianOkinawanOsageOttawaPaiutePakistaniPalestinianPanamanianParaguayanPennsylvania GermanPeruvianPimaPolishPortuguesePotawatomiPuebloPuerto RicanPuget Sound SalishRomanianRussianSalvadoranSamoanScandinavianScotch-IrishScottishSeminoleSenegaleseSerbianShoshoneSierra LeoneanSiouxSlavicSlovakSloveneSomaliSouth AfricanSouth AmericanSouth American IndianSoviet UnionSpaniardSpanishSpanish AmericanSpanish American IndianSri LankanSudaneseSwedishSwissSyrianTaiwaneseThaiTlingit-HaidaTohono O'OdhamTonganTrinidadian and TobagonianTsimshianTurkishU.S. Virgin IslanderUgandanUkrainianUruguayanUteVenezuelanVietnameseWelshWest IndianYakamaYaquiYugoslavianYumanYup'ikZimbabwean
Immigration
NonimmigrantsImmigrantsAfghanistanAfricaAlbaniaArgentinaArmeniaAsiaAustraliaAustriaBahamasBangladeshBarbadosBelarusBelgiumBelizeBoliviaBosnia and HerzegovinaBrazilBulgariaBurma/MyanmarCabo VerdeCambodiaCameroonCanadaCaribbeanCentral AmericaChileChinaColombiaCongoCosta RicaCroatiaCubaCzechoslovakiaDenmarkDominicaDominican RepublicEastern AfricaEastern AsiaEastern EuropeEcuadorEgyptEl SalvadorEnglandEritreaEthiopiaEuropeFijiFranceGermanyGhanaGreeceGrenadaGuatemalaGuyanaHaitiHondurasHong KongHungaryIndiaIndonesiaIranIraqIrelandIsraelItalyJamaicaJapanJordanKazakhstanKenyaKoreaKuwaitLaosLatin AmericaLatviaLebanonLiberiaLithuaniaMalaysiaMexicoMicronesiaMiddle AfricaMoldovaMoroccoNepalNetherlandsNicaraguaNigeriaNorth AmericaNorth MacedoniaNorthern AfricaNorthern EuropeNorwayOceaniaPakistanPanamaPeruPhilippinesPolandPortugalRomaniaRussiaSaudi ArabiaScotlandSenegalSerbiaSierra LeoneSingaporeSomaliaSouth AfricaSouth AmericaSouth Central AsiaSouth Eastern AsiaSouthern EuropeSpainSri LankaSt. Vincent and the GrenadinesSudanSwedenSwitzerlandSyriaTaiwanThailandTrinidad and TobagoTurkeyUgandaUkraineUruguayUzbekistanVenezuelaVietnamWest IndiesWestern AfricaWestern AsiaWestern EuropeYemenZaireZimbabweAzores
Subsaharan African
Race
Ancestry
AfghanAfricanAlaska NativeAlaskan AthabascanAlbanianAleutAlsatianAmericanApacheArabArapahoArgentineanArmenianAssyrian/Chaldean/SyriacAustralianAustrianBahamianBangladeshiBarbadianBasqueBelgianBelizeanBermudanBhutaneseBlackfeetBolivianBrazilianBritishBritish West IndianBulgarianBurmeseCajunCambodianCanadianCape VerdeanCarpatho RusynCelticCentral AmericanCentral American IndianCherokeeCheyenneChickasawChileanChineseChippewaChoctawColombianColvilleComancheCosta RicanCreeCreekCroatianCrowCubanCypriotCzechCzechoslovakianDanishDelawareDominicanDutchDutch West IndianEastern EuropeanEcuadorianEgyptianEnglishEstonianEthiopianEuropeanFijianFilipinoFinnishFrenchFrench American IndianFrench CanadianGermanGerman RussianGhanaianGreekGuamanian/ChamorroGuatemalanGuyaneseHaitianHmongHonduranHopiHoumaHungarianIcelanderIndian (Asian)IndonesianInupiatIranianIraqiIrishIroquoisIsraeliItalianJamaicanJapaneseJordanianKenyanKiowaKoreanLaotianLatvianLebaneseLiberianLithuanianLumbeeLuxembourgerMacedonianMalaysianMalteseMarshalleseMenomineeMexicanMexican American IndianMongolianMoroccanNative HawaiianNavajoNepaleseNew ZealanderNicaraguanNigerianNorthern EuropeanNorwegianOkinawanOsageOttawaPaiutePakistaniPalestinianPanamanianParaguayanPennsylvania GermanPeruvianPimaPolishPortuguesePotawatomiPuebloPuerto RicanPuget Sound SalishRomanianRussianSalvadoranSamoanScandinavianScotch-IrishScottishSeminoleSenegaleseSerbianShoshoneSierra LeoneanSiouxSlavicSlovakSloveneSomaliSouth AfricanSouth AmericanSouth American IndianSoviet UnionSpaniardSpanishSpanish AmericanSpanish American IndianSri LankanSubsaharan AfricanSudaneseSwedishSwissSyrianTaiwaneseThaiTlingit-HaidaTohono O'OdhamTonganTrinidadian and TobagonianTsimshianTurkishU.S. Virgin IslanderUgandanUkrainianUruguayanUteVenezuelanVietnameseWelshWest IndianYakamaYaquiYugoslavianYumanYup'ikZimbabwean
Immigration
NonimmigrantsImmigrantsAfghanistanAfricaAlbaniaArgentinaArmeniaAsiaAustraliaAustriaBahamasBangladeshBarbadosBelarusBelgiumBelizeBoliviaBosnia and HerzegovinaBrazilBulgariaBurma/MyanmarCabo VerdeCambodiaCameroonCanadaCaribbeanCentral AmericaChileChinaColombiaCongoCosta RicaCroatiaCubaCzechoslovakiaDenmarkDominicaDominican RepublicEastern AfricaEastern AsiaEastern EuropeEcuadorEgyptEl SalvadorEnglandEritreaEthiopiaEuropeFijiFranceGermanyGhanaGreeceGrenadaGuatemalaGuyanaHaitiHondurasHong KongIndiaIndonesiaIranIraqIrelandIsraelItalyJamaicaJapanJordanKazakhstanKenyaKoreaKuwaitLaosLatin AmericaLatviaLebanonLiberiaLithuaniaMalaysiaMexicoMicronesiaMiddle AfricaMoldovaMoroccoNepalNetherlandsNicaraguaNigeriaNorth AmericaNorth MacedoniaNorthern AfricaNorthern EuropeNorwayOceaniaPakistanPanamaPeruPhilippinesPolandPortugalRomaniaRussiaSaudi ArabiaScotlandSenegalSerbiaSierra LeoneSingaporeSomaliaSouth AfricaSouth AmericaSouth Central AsiaSouth Eastern AsiaSouthern EuropeSpainSri LankaSt. Vincent and the GrenadinesSudanSwedenSwitzerlandSyriaTaiwanThailandTrinidad and TobagoTurkeyUgandaUkraineUruguayUzbekistanVenezuelaVietnamWest IndiesWestern AfricaWestern AsiaWestern EuropeYemenZaireZimbabweAzores
Wage/Income Gap
Income
Poverty
Unemployment
Labor Participation
Family Structure
Vehicle Availability
Education Level
Disability

Wage/Income Gap Comparison

Immigrants from Hungary

Sub-Saharan Africans

Tragic
Exceptional
27.0%
WAGE/INCOME GAP
4.8/ 100
METRIC RATING
235th/ 347
METRIC RANK
22.8%
WAGE/INCOME GAP
99.9/ 100
METRIC RATING
72nd/ 347
METRIC RANK

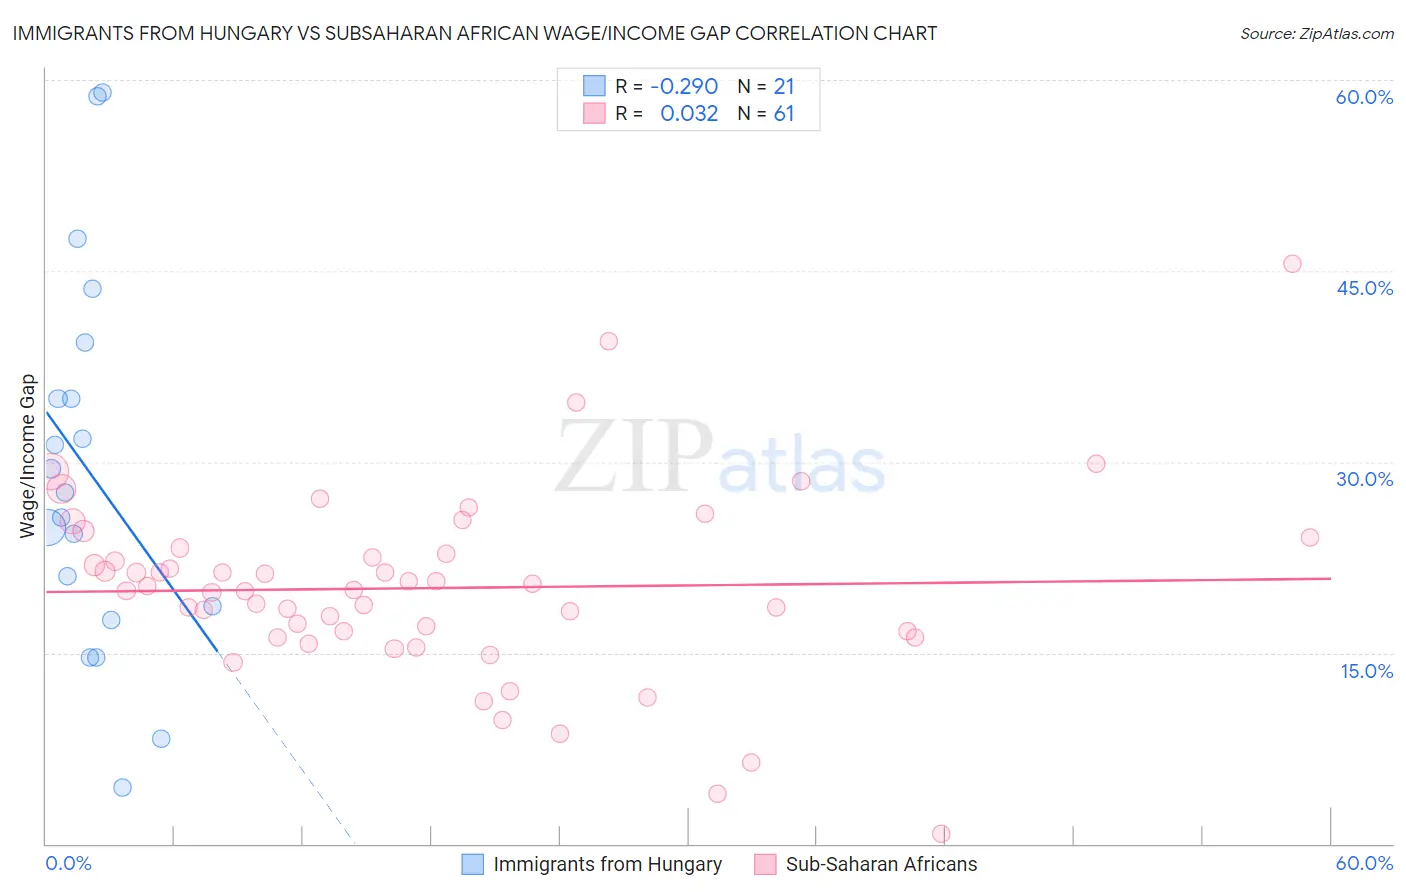
Immigrants from Hungary vs Subsaharan African Wage/Income Gap Correlation Chart

The statistical analysis conducted on geographies consisting of 195,626,970 people shows a weak negative correlation between the proportion of Immigrants from Hungary and wage/income gap percentage in the United States with a correlation coefficient (R) of -0.290 and weighted average of 27.0%. Similarly, the statistical analysis conducted on geographies consisting of 507,315,173 people shows no correlation between the proportion of Sub-Saharan Africans and wage/income gap percentage in the United States with a correlation coefficient (R) of 0.032 and weighted average of 22.8%, a difference of 18.4%.
Immigrants from Hungary vs Subsaharan African Wage/Income Gap

Wage/Income Gap Correlation Summary

MeasurementImmigrants from HungarySubsaharan African
Minimum4.4%0.79%
Maximum59.1%45.6%
Range54.6%44.8%
Mean29.2%20.1%
Median27.6%19.9%
Interquartile 25% (IQ1)18.1%16.4%
Interquartile 75% (IQ3)37.2%23.0%
Interquartile Range (IQR)19.1%6.6%
Standard Deviation (Sample)14.7%7.4%
Standard Deviation (Population)14.4%7.4%

Similar Demographics by Wage/Income Gap

Demographics Similar to Immigrants from Hungary by Wage/Income Gap

In terms of wage/income gap, the demographic groups most similar to Immigrants from Hungary are Immigrants from Pakistan (27.0%, a difference of 0.010%), Immigrants from Romania (27.0%, a difference of 0.020%), Immigrants from Brazil (27.0%, a difference of 0.060%), Argentinean (27.0%, a difference of 0.12%), and Bhutanese (27.0%, a difference of 0.15%).
DemographicsRating | RankWage/Income Gap
Immigrants | Turkey
5.6
/100
|
#228
Tragic
27.0%
Immigrants | Asia
5.5
/100
|
#229
Tragic
27.0%
Ottawa
5.3
/100
|
#230
Tragic
27.0%
Bhutanese
5.3
/100
|
#231
Tragic
27.0%
Argentineans
5.2
/100
|
#232
Tragic
27.0%
Immigrants | Brazil
5.0
/100
|
#233
Tragic
27.0%
Immigrants | Pakistan
4.9
/100
|
#234
Tragic
27.0%
Immigrants | Hungary
4.8
/100
|
#235
Tragic
27.0%
Immigrants | Romania
4.8
/100
|
#236
Tragic
27.0%
Immigrants | Eastern Asia
4.4
/100
|
#237
Tragic
27.1%
Osage
4.4
/100
|
#238
Tragic
27.1%
Estonians
4.3
/100
|
#239
Tragic
27.1%
Immigrants | Europe
3.8
/100
|
#240
Tragic
27.1%
Creek
3.8
/100
|
#241
Tragic
27.1%
Immigrants | Sri Lanka
3.7
/100
|
#242
Tragic
27.1%

Demographics Similar to Sub-Saharan Africans by Wage/Income Gap

In terms of wage/income gap, the demographic groups most similar to Sub-Saharan Africans are Immigrants from Eastern Africa (22.8%, a difference of 0.030%), Immigrants from Burma/Myanmar (22.8%, a difference of 0.11%), Immigrants from El Salvador (22.8%, a difference of 0.15%), Immigrants from Uzbekistan (22.7%, a difference of 0.31%), and Fijian (22.9%, a difference of 0.39%).
DemographicsRating | RankWage/Income Gap
Guatemalans
99.9
/100
|
#65
Exceptional
22.6%
Central American Indians
99.9
/100
|
#66
Exceptional
22.7%
Menominee
99.9
/100
|
#67
Exceptional
22.7%
Immigrants | Nigeria
99.9
/100
|
#68
Exceptional
22.7%
Indonesians
99.9
/100
|
#69
Exceptional
22.7%
Immigrants | Uzbekistan
99.9
/100
|
#70
Exceptional
22.7%
Immigrants | El Salvador
99.9
/100
|
#71
Exceptional
22.8%
Sub-Saharan Africans
99.9
/100
|
#72
Exceptional
22.8%
Immigrants | Eastern Africa
99.9
/100
|
#73
Exceptional
22.8%
Immigrants | Burma/Myanmar
99.9
/100
|
#74
Exceptional
22.8%
Fijians
99.9
/100
|
#75
Exceptional
22.9%
Ecuadorians
99.9
/100
|
#76
Exceptional
22.9%
Africans
99.9
/100
|
#77
Exceptional
22.9%
Nigerians
99.9
/100
|
#78
Exceptional
23.0%
Immigrants | Nicaragua
99.9
/100
|
#79
Exceptional
23.0%