Zip Codes with the Highest Percentage of Population Employed in Food Preparation & Serving in Tampa, FL
RELATED REPORTS & OPTIONS
Food Preparation & Serving
Tampa
Compare Zip Codes
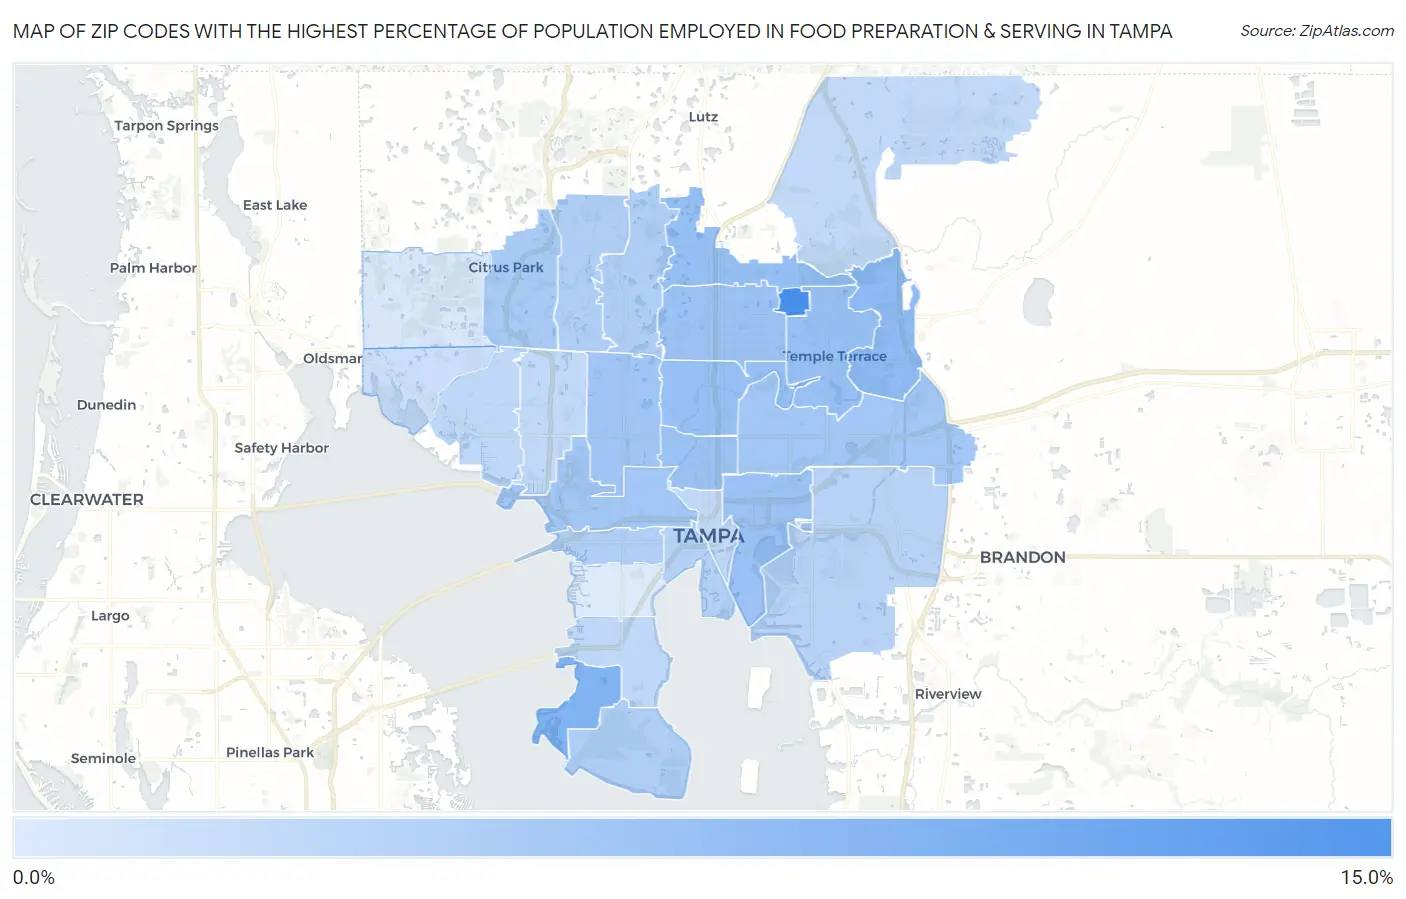
Map of Zip Codes with the Highest Percentage of Population Employed in Food Preparation & Serving in Tampa
0.0%
15.0%
Zip Codes with the Highest Percentage of Population Employed in Food Preparation & Serving in Tampa, FL
| Zip Code | % Employed | vs State | vs National | |
| 1. | 33620 | 14.7% | 6.1%(+8.58)#24 | 5.3%(+9.38)#1,037 |
| 2. | 33616 | 9.6% | 6.1%(+3.50)#107 | 5.3%(+4.31)#2,977 |
| 3. | 33637 | 8.3% | 6.1%(+2.18)#175 | 5.3%(+2.98)#4,353 |
| 4. | 33613 | 7.7% | 6.1%(+1.62)#232 | 5.3%(+2.42)#5,195 |
| 5. | 33617 | 7.6% | 6.1%(+1.49)#247 | 5.3%(+2.29)#5,415 |
| 6. | 33604 | 7.6% | 6.1%(+1.47)#250 | 5.3%(+2.27)#5,450 |
| 7. | 33612 | 7.5% | 6.1%(+1.36)#265 | 5.3%(+2.17)#5,647 |
| 8. | 33603 | 7.3% | 6.1%(+1.18)#286 | 5.3%(+1.99)#5,983 |
| 9. | 33605 | 7.1% | 6.1%(+1.04)#299 | 5.3%(+1.85)#6,274 |
| 10. | 33614 | 6.7% | 6.1%(+0.596)#365 | 5.3%(+1.40)#7,375 |
| 11. | 33610 | 6.7% | 6.1%(+0.571)#367 | 5.3%(+1.38)#7,450 |
| 12. | 33607 | 6.6% | 6.1%(+0.462)#379 | 5.3%(+1.27)#7,722 |
| 13. | 33625 | 6.3% | 6.1%(+0.171)#414 | 5.3%(+0.975)#8,539 |
| 14. | 33624 | 5.7% | 6.1%(-0.402)#506 | 5.3%(+0.402)#10,390 |
| 15. | 33621 | 5.6% | 6.1%(-0.461)#512 | 5.3%(+0.343)#10,605 |
| 16. | 33618 | 5.6% | 6.1%(-0.471)#513 | 5.3%(+0.334)#10,642 |
| 17. | 33609 | 5.4% | 6.1%(-0.696)#545 | 5.3%(+0.108)#11,427 |
| 18. | 33606 | 5.1% | 6.1%(-0.979)#586 | 5.3%(-0.174)#12,495 |
| 19. | 33619 | 4.8% | 6.1%(-1.31)#632 | 5.3%(-0.505)#13,819 |
| 20. | 33611 | 4.3% | 6.1%(-1.80)#684 | 5.3%(-0.994)#15,915 |
| 21. | 33615 | 4.2% | 6.1%(-1.89)#697 | 5.3%(-1.08)#16,303 |
| 22. | 33647 | 4.2% | 6.1%(-1.93)#700 | 5.3%(-1.12)#16,458 |
| 23. | 33602 | 4.1% | 6.1%(-2.02)#713 | 5.3%(-1.22)#16,838 |
| 24. | 33634 | 4.1% | 6.1%(-2.03)#715 | 5.3%(-1.23)#16,891 |
| 25. | 33635 | 3.3% | 6.1%(-2.76)#800 | 5.3%(-1.96)#19,934 |
| 26. | 33626 | 2.2% | 6.1%(-3.86)#877 | 5.3%(-3.06)#24,010 |
| 27. | 33629 | 1.8% | 6.1%(-4.28)#896 | 5.3%(-3.47)#25,233 |
1
Common Questions
What are the Top 10 Zip Codes with the Highest Percentage of Population Employed in Food Preparation & Serving in Tampa, FL?
Top 10 Zip Codes with the Highest Percentage of Population Employed in Food Preparation & Serving in Tampa, FL are:
What zip code has the Highest Percentage of Population Employed in Food Preparation & Serving in Tampa, FL?
33620 has the Highest Percentage of Population Employed in Food Preparation & Serving in Tampa, FL with 14.7%.
What is the Percentage of Population Employed in Food Preparation & Serving in Tampa, FL?
Percentage of Population Employed in Food Preparation & Serving in Tampa is 6.2%.
What is the Percentage of Population Employed in Food Preparation & Serving in Florida?
Percentage of Population Employed in Food Preparation & Serving in Florida is 6.1%.
What is the Percentage of Population Employed in Food Preparation & Serving in the United States?
Percentage of Population Employed in Food Preparation & Serving in the United States is 5.3%.