Zip Codes with the Highest Percentage of Population Employed in Food Preparation & Serving in Cape Coral, FL
RELATED REPORTS & OPTIONS
Food Preparation & Serving
Cape Coral
Compare Zip Codes
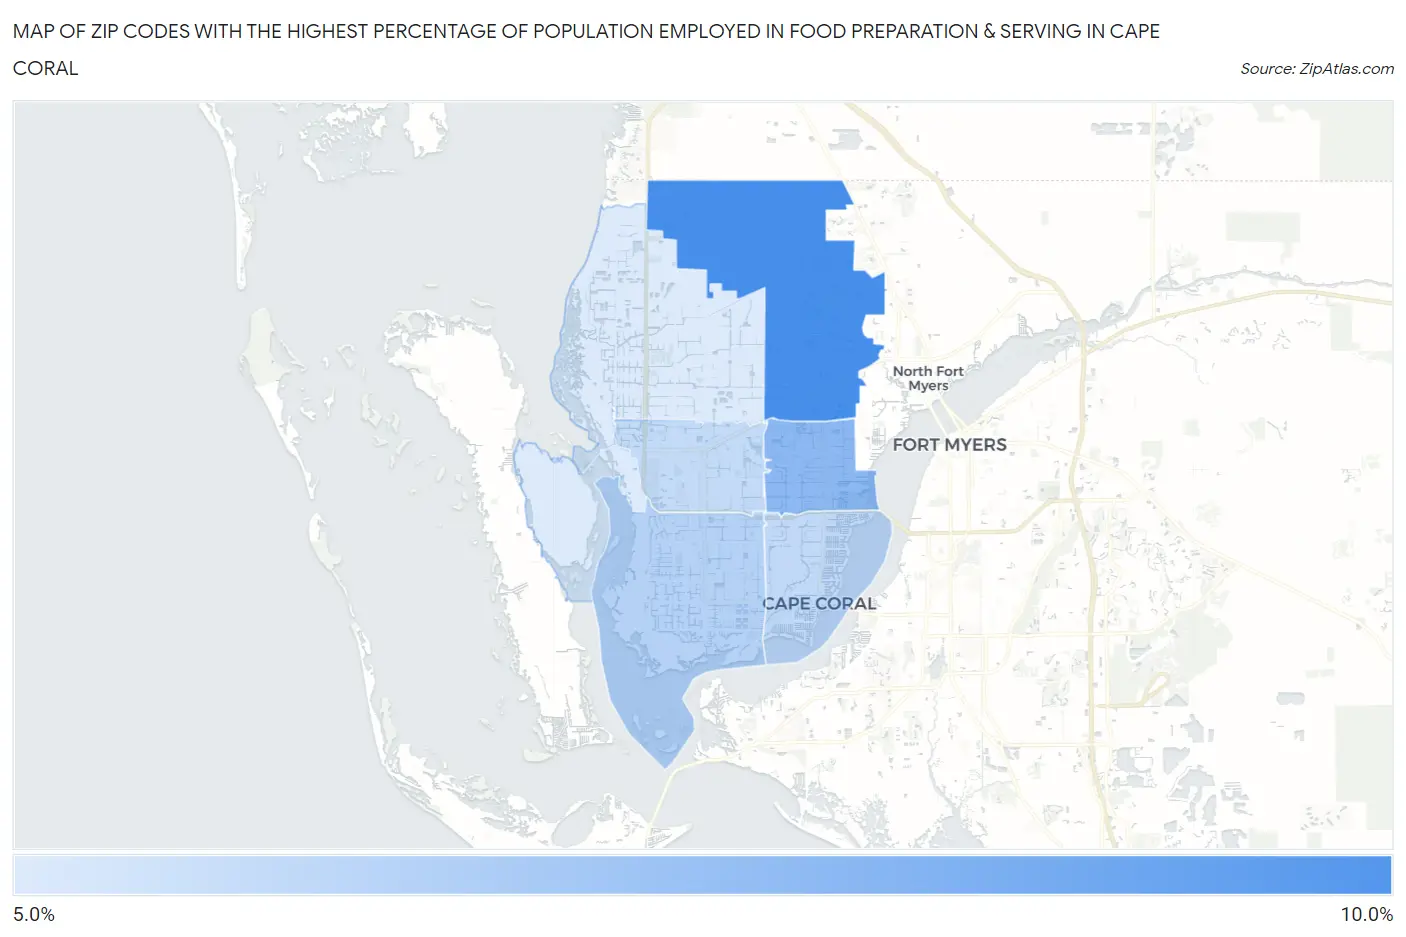
Map of Zip Codes with the Highest Percentage of Population Employed in Food Preparation & Serving in Cape Coral
0.0%
10.0%
Zip Codes with the Highest Percentage of Population Employed in Food Preparation & Serving in Cape Coral, FL
| Zip Code | % Employed | vs State | vs National | |
| 1. | 33909 | 9.3% | 6.1%(+3.17)#126 | 5.3%(+3.98)#3,269 |
| 2. | 33990 | 7.5% | 6.1%(+1.42)#259 | 5.3%(+2.22)#5,552 |
| 3. | 33914 | 6.4% | 6.1%(+0.340)#394 | 5.3%(+1.14)#8,064 |
| 4. | 33904 | 6.1% | 6.1%(+0.044)#435 | 5.3%(+0.848)#8,918 |
| 5. | 33991 | 6.1% | 6.1%(-0.002)#443 | 5.3%(+0.803)#9,061 |
| 6. | 33993 | 5.4% | 6.1%(-0.645)#537 | 5.3%(+0.160)#11,243 |
1
Common Questions
What are the Top 5 Zip Codes with the Highest Percentage of Population Employed in Food Preparation & Serving in Cape Coral, FL?
Top 5 Zip Codes with the Highest Percentage of Population Employed in Food Preparation & Serving in Cape Coral, FL are:
What zip code has the Highest Percentage of Population Employed in Food Preparation & Serving in Cape Coral, FL?
33909 has the Highest Percentage of Population Employed in Food Preparation & Serving in Cape Coral, FL with 9.3%.
What is the Percentage of Population Employed in Food Preparation & Serving in Cape Coral, FL?
Percentage of Population Employed in Food Preparation & Serving in Cape Coral is 7.0%.
What is the Percentage of Population Employed in Food Preparation & Serving in Florida?
Percentage of Population Employed in Food Preparation & Serving in Florida is 6.1%.
What is the Percentage of Population Employed in Food Preparation & Serving in the United States?
Percentage of Population Employed in Food Preparation & Serving in the United States is 5.3%.