Zip Codes with the Highest Percentage of Population Employed in Architecture & Engineering in Tampa, FL
RELATED REPORTS & OPTIONS
Architecture & Engineering
Tampa
Compare Zip Codes
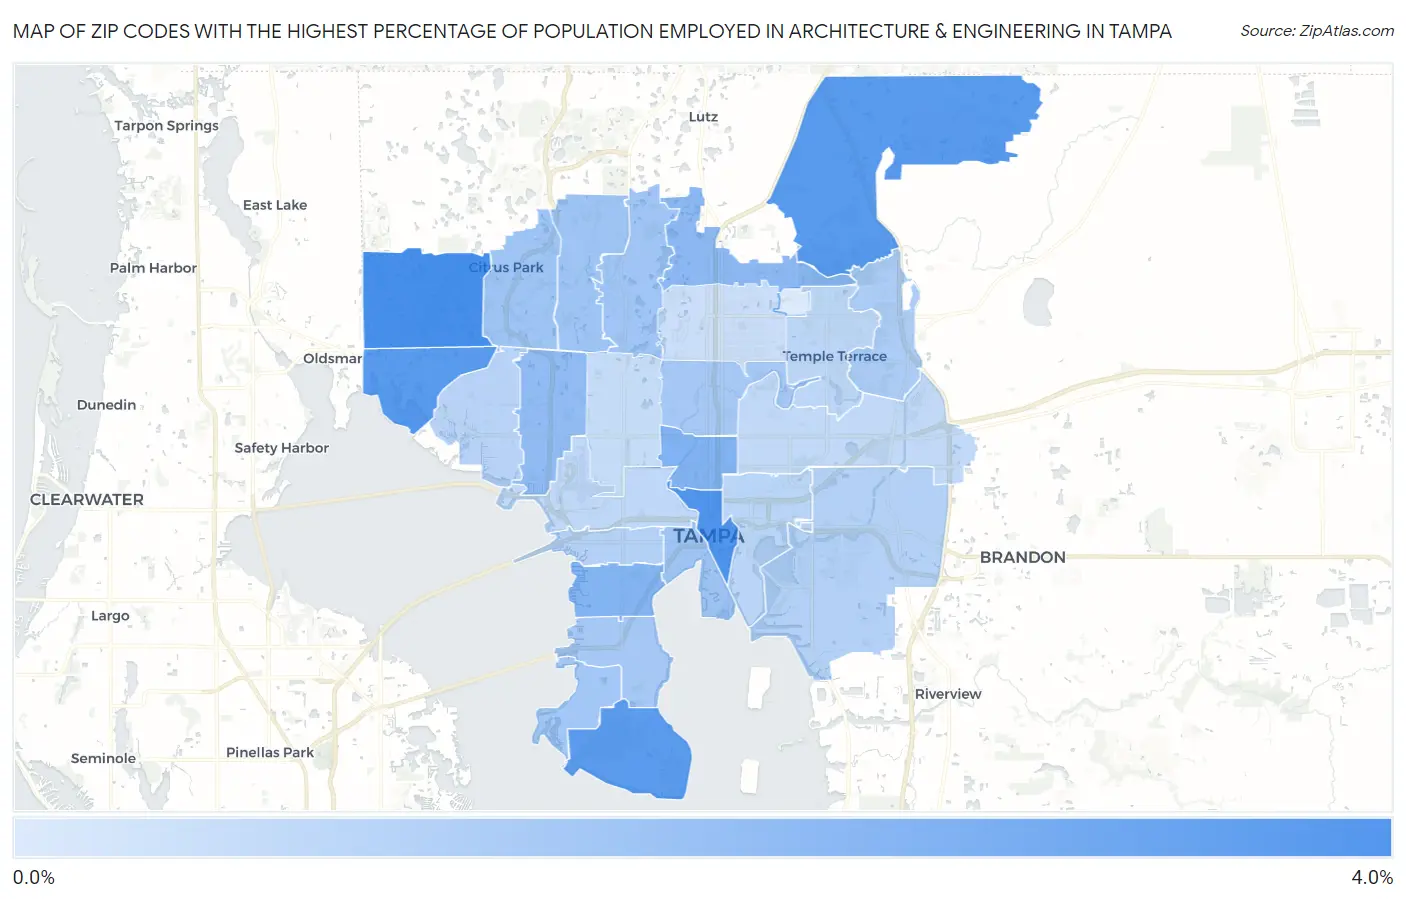
Map of Zip Codes with the Highest Percentage of Population Employed in Architecture & Engineering in Tampa
0.0%
4.0%
Zip Codes with the Highest Percentage of Population Employed in Architecture & Engineering in Tampa, FL
| Zip Code | % Employed | vs State | vs National | |
| 1. | 33626 | 3.3% | 1.6%(+1.73)#76 | 2.1%(+1.18)#4,131 |
| 2. | 33602 | 3.2% | 1.6%(+1.56)#83 | 2.1%(+1.01)#4,581 |
| 3. | 33647 | 3.0% | 1.6%(+1.42)#93 | 2.1%(+0.867)#5,001 |
| 4. | 33635 | 3.0% | 1.6%(+1.39)#96 | 2.1%(+0.840)#5,091 |
| 5. | 33621 | 3.0% | 1.6%(+1.38)#100 | 2.1%(+0.831)#5,120 |
| 6. | 33603 | 2.2% | 1.6%(+0.608)#200 | 2.1%(+0.057)#8,445 |
| 7. | 33629 | 2.1% | 1.6%(+0.546)#209 | 2.1%(-0.005)#8,792 |
| 8. | 33613 | 2.0% | 1.6%(+0.382)#237 | 2.1%(-0.169)#9,737 |
| 9. | 33634 | 1.9% | 1.6%(+0.282)#257 | 2.1%(-0.268)#10,356 |
| 10. | 33624 | 1.6% | 1.6%(+0.045)#325 | 2.1%(-0.506)#11,885 |
| 11. | 33625 | 1.6% | 1.6%(+0.041)#329 | 2.1%(-0.509)#11,907 |
| 12. | 33606 | 1.6% | 1.6%(+0.032)#332 | 2.1%(-0.518)#11,973 |
| 13. | 33618 | 1.6% | 1.6%(-0.014)#350 | 2.1%(-0.565)#12,279 |
| 14. | 33616 | 1.5% | 1.6%(-0.069)#368 | 2.1%(-0.620)#12,650 |
| 15. | 33611 | 1.5% | 1.6%(-0.122)#393 | 2.1%(-0.672)#13,039 |
| 16. | 33604 | 1.5% | 1.6%(-0.126)#398 | 2.1%(-0.676)#13,072 |
| 17. | 33637 | 1.4% | 1.6%(-0.242)#441 | 2.1%(-0.792)#13,905 |
| 18. | 33609 | 1.2% | 1.6%(-0.369)#483 | 2.1%(-0.919)#14,840 |
| 19. | 33619 | 1.2% | 1.6%(-0.371)#485 | 2.1%(-0.921)#14,851 |
| 20. | 33615 | 1.1% | 1.6%(-0.478)#534 | 2.1%(-1.03)#15,686 |
| 21. | 33605 | 1.1% | 1.6%(-0.506)#548 | 2.1%(-1.06)#15,905 |
| 22. | 33617 | 1.1% | 1.6%(-0.530)#556 | 2.1%(-1.08)#16,098 |
| 23. | 33607 | 1.0% | 1.6%(-0.599)#571 | 2.1%(-1.15)#16,588 |
| 24. | 33610 | 0.97% | 1.6%(-0.629)#581 | 2.1%(-1.18)#16,841 |
| 25. | 33614 | 0.89% | 1.6%(-0.710)#609 | 2.1%(-1.26)#17,459 |
| 26. | 33612 | 0.79% | 1.6%(-0.812)#659 | 2.1%(-1.36)#18,231 |
| 27. | 33620 | 0.44% | 1.6%(-1.16)#769 | 2.1%(-1.71)#20,680 |
1
Common Questions
What are the Top 10 Zip Codes with the Highest Percentage of Population Employed in Architecture & Engineering in Tampa, FL?
Top 10 Zip Codes with the Highest Percentage of Population Employed in Architecture & Engineering in Tampa, FL are:
What zip code has the Highest Percentage of Population Employed in Architecture & Engineering in Tampa, FL?
33626 has the Highest Percentage of Population Employed in Architecture & Engineering in Tampa, FL with 3.3%.
What is the Percentage of Population Employed in Architecture & Engineering in Tampa, FL?
Percentage of Population Employed in Architecture & Engineering in Tampa is 1.6%.
What is the Percentage of Population Employed in Architecture & Engineering in Florida?
Percentage of Population Employed in Architecture & Engineering in Florida is 1.6%.
What is the Percentage of Population Employed in Architecture & Engineering in the United States?
Percentage of Population Employed in Architecture & Engineering in the United States is 2.1%.