Zip Codes with the Highest Percentage of Population Employed in Food Preparation & Serving in Altamonte Springs, FL
RELATED REPORTS & OPTIONS
Food Preparation & Serving
Altamonte Springs
Compare Zip Codes
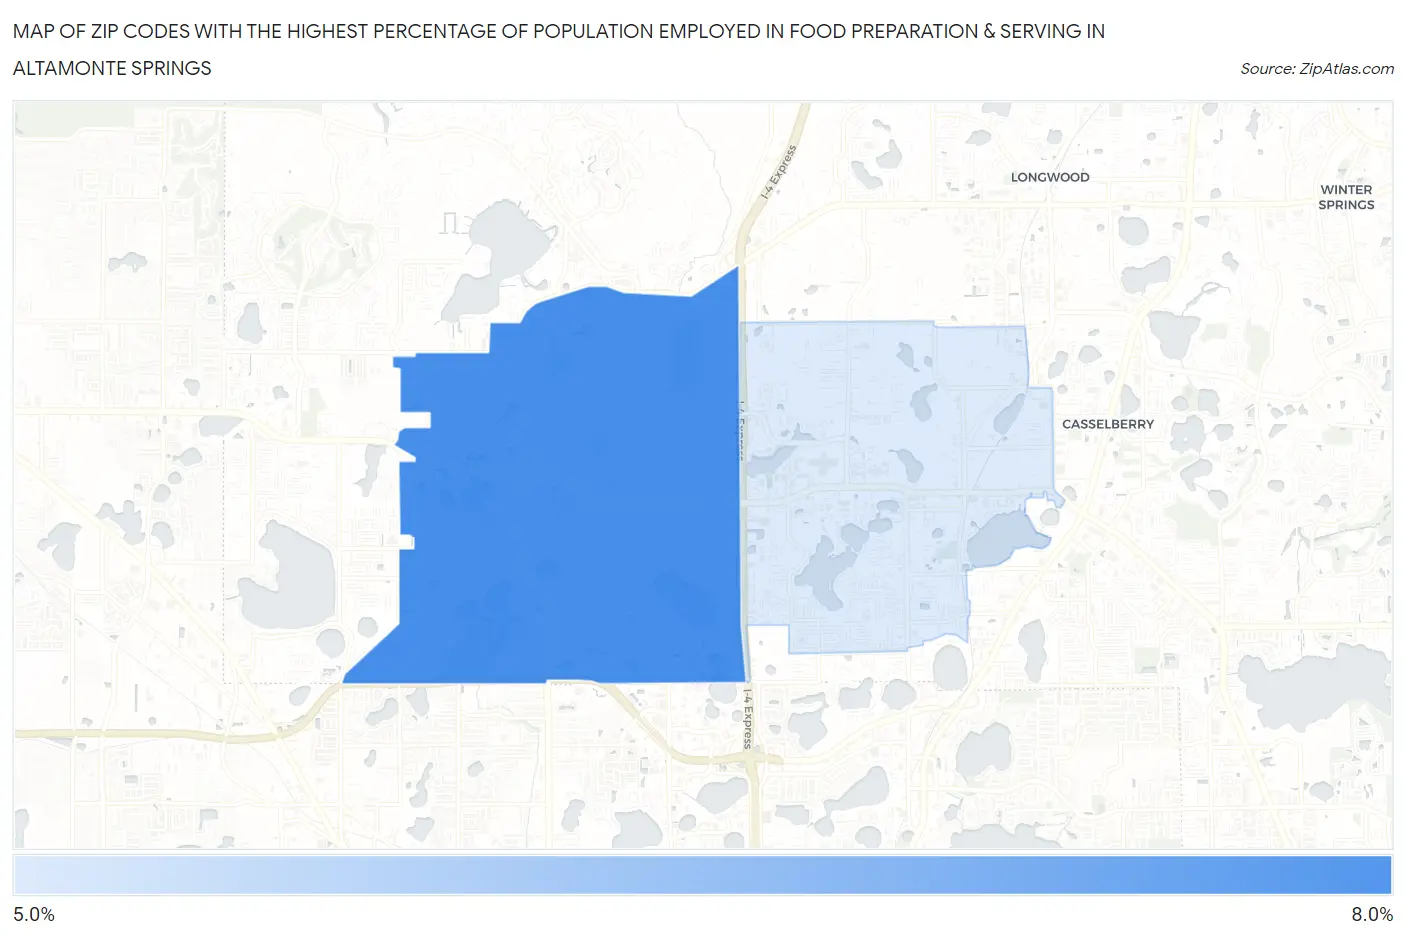
Map of Zip Codes with the Highest Percentage of Population Employed in Food Preparation & Serving in Altamonte Springs
0.0%
8.0%
Zip Codes with the Highest Percentage of Population Employed in Food Preparation & Serving in Altamonte Springs, FL
| Zip Code | % Employed | vs State | vs National | |
| 1. | 32714 | 6.8% | 6.1%(+0.704)#345 | 5.3%(+1.51)#7,073 |
| 2. | 32701 | 5.5% | 6.1%(-0.542)#523 | 5.3%(+0.262)#10,898 |
1
Common Questions
What are the Top Zip Codes with the Highest Percentage of Population Employed in Food Preparation & Serving in Altamonte Springs, FL?
Top Zip Codes with the Highest Percentage of Population Employed in Food Preparation & Serving in Altamonte Springs, FL are:
What zip code has the Highest Percentage of Population Employed in Food Preparation & Serving in Altamonte Springs, FL?
32714 has the Highest Percentage of Population Employed in Food Preparation & Serving in Altamonte Springs, FL with 6.8%.
What is the Percentage of Population Employed in Food Preparation & Serving in Altamonte Springs, FL?
Percentage of Population Employed in Food Preparation & Serving in Altamonte Springs is 6.6%.
What is the Percentage of Population Employed in Food Preparation & Serving in Florida?
Percentage of Population Employed in Food Preparation & Serving in Florida is 6.1%.
What is the Percentage of Population Employed in Food Preparation & Serving in the United States?
Percentage of Population Employed in Food Preparation & Serving in the United States is 5.3%.