Zip Codes with the Highest Percentage of Population Employed in Food Preparation & Serving in Daytona Beach, FL
RELATED REPORTS & OPTIONS
Food Preparation & Serving
Daytona Beach
Compare Zip Codes
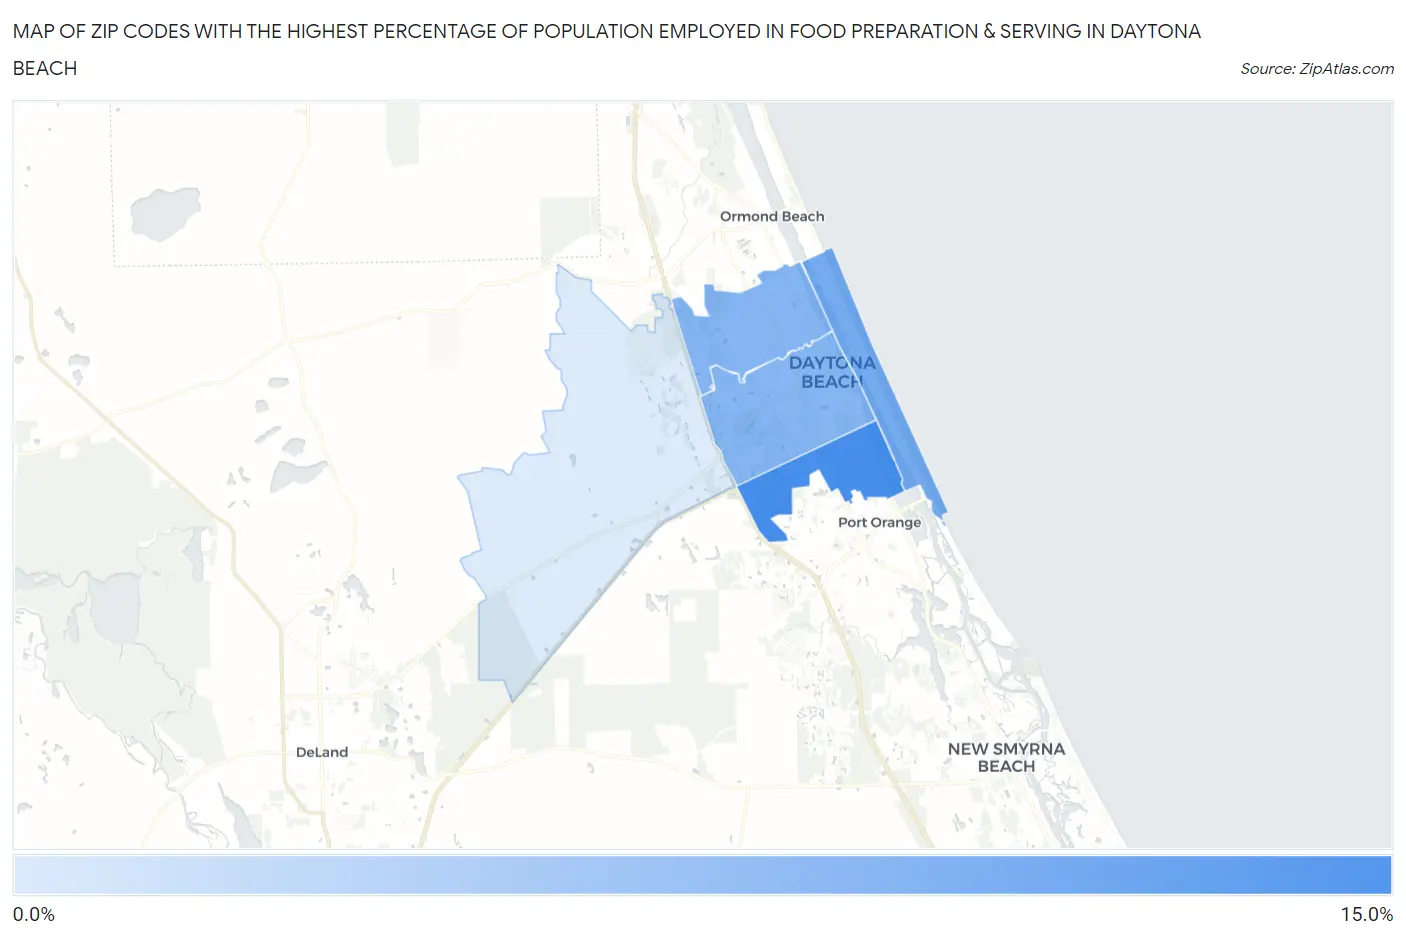
Map of Zip Codes with the Highest Percentage of Population Employed in Food Preparation & Serving in Daytona Beach
0.0%
15.0%
Zip Codes with the Highest Percentage of Population Employed in Food Preparation & Serving in Daytona Beach, FL
| Zip Code | % Employed | vs State | vs National | |
| 1. | 32119 | 12.3% | 6.1%(+6.24)#42 | 5.3%(+7.05)#1,560 |
| 2. | 32118 | 8.7% | 6.1%(+2.57)#152 | 5.3%(+3.38)#3,899 |
| 3. | 32117 | 7.4% | 6.1%(+1.28)#274 | 5.3%(+2.08)#5,811 |
| 4. | 32114 | 7.3% | 6.1%(+1.23)#280 | 5.3%(+2.04)#5,885 |
| 5. | 32124 | 0.64% | 6.1%(-5.46)#922 | 5.3%(-4.65)#27,539 |
1
Common Questions
What are the Top 3 Zip Codes with the Highest Percentage of Population Employed in Food Preparation & Serving in Daytona Beach, FL?
Top 3 Zip Codes with the Highest Percentage of Population Employed in Food Preparation & Serving in Daytona Beach, FL are:
What zip code has the Highest Percentage of Population Employed in Food Preparation & Serving in Daytona Beach, FL?
32119 has the Highest Percentage of Population Employed in Food Preparation & Serving in Daytona Beach, FL with 12.3%.
What is the Percentage of Population Employed in Food Preparation & Serving in Daytona Beach, FL?
Percentage of Population Employed in Food Preparation & Serving in Daytona Beach is 7.9%.
What is the Percentage of Population Employed in Food Preparation & Serving in Florida?
Percentage of Population Employed in Food Preparation & Serving in Florida is 6.1%.
What is the Percentage of Population Employed in Food Preparation & Serving in the United States?
Percentage of Population Employed in Food Preparation & Serving in the United States is 5.3%.