Zip Codes with the Highest Percentage of Population Employed in Food Preparation & Serving in Pinellas Park, FL
RELATED REPORTS & OPTIONS
Food Preparation & Serving
Pinellas Park
Compare Zip Codes
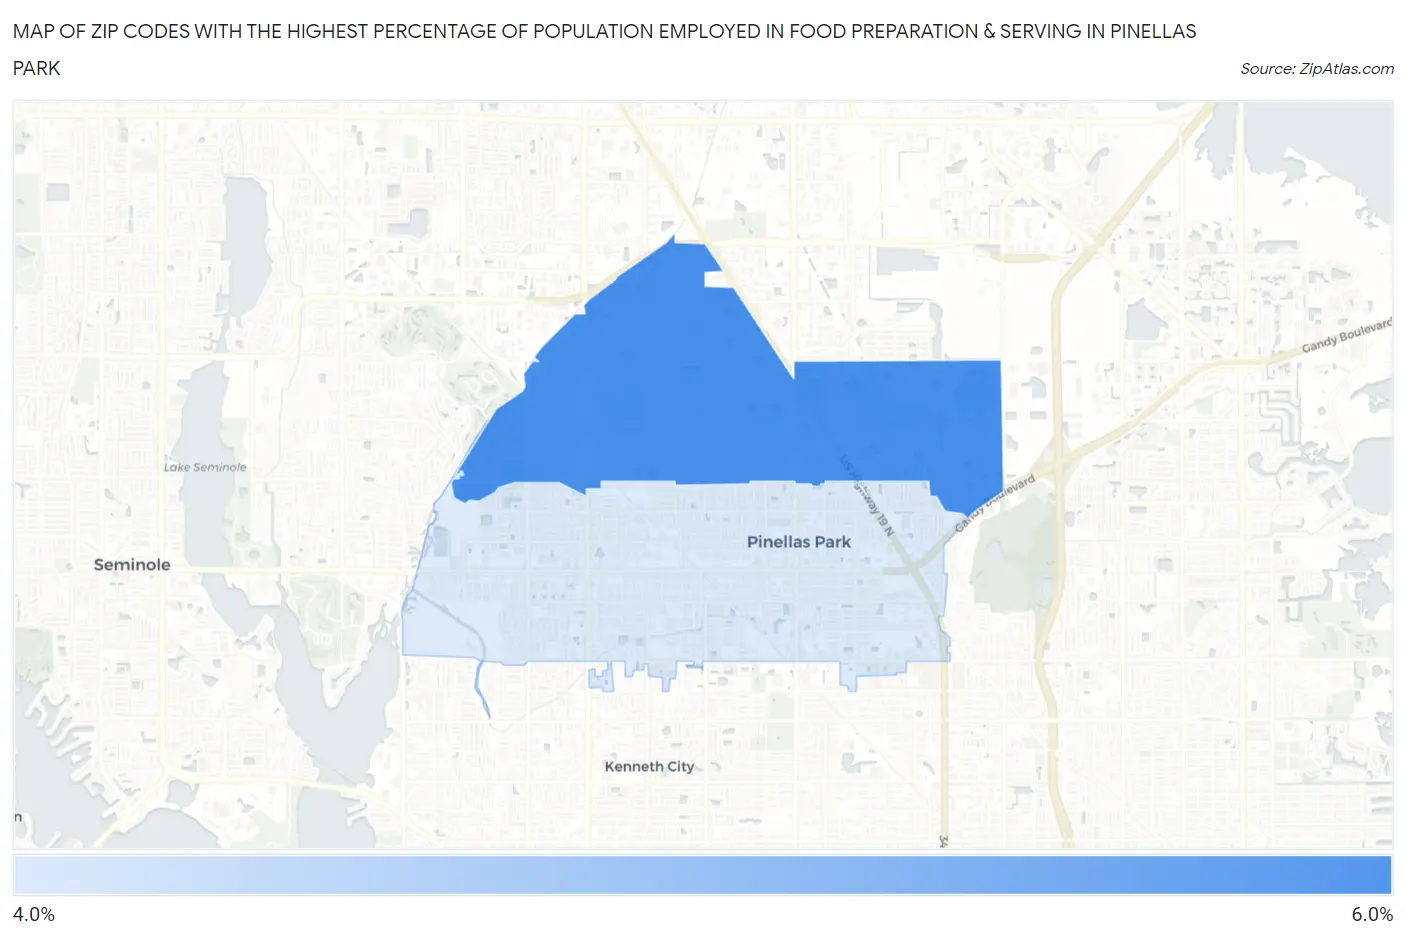
Map of Zip Codes with the Highest Percentage of Population Employed in Food Preparation & Serving in Pinellas Park
0.0%
6.0%
Zip Codes with the Highest Percentage of Population Employed in Food Preparation & Serving in Pinellas Park, FL
| Zip Code | % Employed | vs State | vs National | |
| 1. | 33782 | 5.1% | 6.1%(-0.947)#577 | 5.3%(-0.143)#12,387 |
| 2. | 33781 | 4.8% | 6.1%(-1.33)#635 | 5.3%(-0.522)#13,896 |
1
Common Questions
What are the Top Zip Codes with the Highest Percentage of Population Employed in Food Preparation & Serving in Pinellas Park, FL?
Top Zip Codes with the Highest Percentage of Population Employed in Food Preparation & Serving in Pinellas Park, FL are:
What zip code has the Highest Percentage of Population Employed in Food Preparation & Serving in Pinellas Park, FL?
33782 has the Highest Percentage of Population Employed in Food Preparation & Serving in Pinellas Park, FL with 5.1%.
What is the Percentage of Population Employed in Food Preparation & Serving in Pinellas Park, FL?
Percentage of Population Employed in Food Preparation & Serving in Pinellas Park is 4.6%.
What is the Percentage of Population Employed in Food Preparation & Serving in Florida?
Percentage of Population Employed in Food Preparation & Serving in Florida is 6.1%.
What is the Percentage of Population Employed in Food Preparation & Serving in the United States?
Percentage of Population Employed in Food Preparation & Serving in the United States is 5.3%.