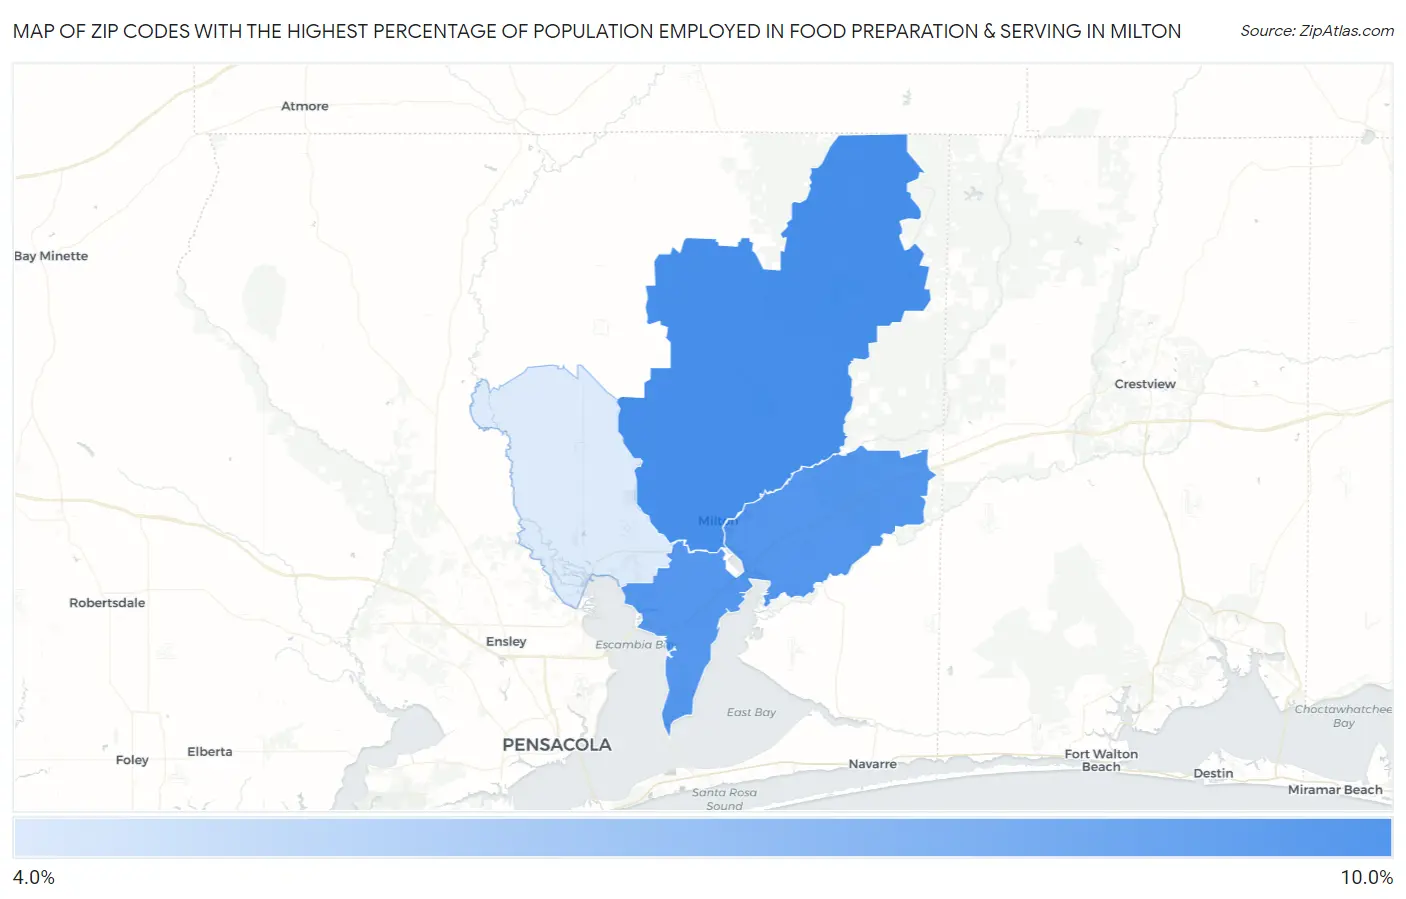
Zip Codes with the Highest Percentage of Population Employed in Food Preparation & Serving in Milton, FL
RELATED REPORTS & OPTIONS
Food Preparation & Serving
Milton
Compare Zip Codes
Map of Zip Codes with the Highest Percentage of Population Employed in Food Preparation & Serving in Milton
0.0%
10.0%
Zip Codes with the Highest Percentage of Population Employed in Food Preparation & Serving in Milton, FL
| Zip Code | % Employed | vs State | vs National | |
| 1. | 32570 | 8.1% | 6.1%(+2.05)#189 | 5.3%(+2.85)#4,531 |
| 2. | 32583 | 7.8% | 6.1%(+1.66)#225 | 5.3%(+2.47)#5,140 |
| 3. | 32571 | 4.2% | 6.1%(-1.88)#694 | 5.3%(-1.07)#16,268 |
1
Common Questions
What are the Top Zip Codes with the Highest Percentage of Population Employed in Food Preparation & Serving in Milton, FL?
Top Zip Codes with the Highest Percentage of Population Employed in Food Preparation & Serving in Milton, FL are:
What zip code has the Highest Percentage of Population Employed in Food Preparation & Serving in Milton, FL?
32570 has the Highest Percentage of Population Employed in Food Preparation & Serving in Milton, FL with 8.1%.
What is the Percentage of Population Employed in Food Preparation & Serving in Milton, FL?
Percentage of Population Employed in Food Preparation & Serving in Milton is 7.7%.
What is the Percentage of Population Employed in Food Preparation & Serving in Florida?
Percentage of Population Employed in Food Preparation & Serving in Florida is 6.1%.
What is the Percentage of Population Employed in Food Preparation & Serving in the United States?
Percentage of Population Employed in Food Preparation & Serving in the United States is 5.3%.