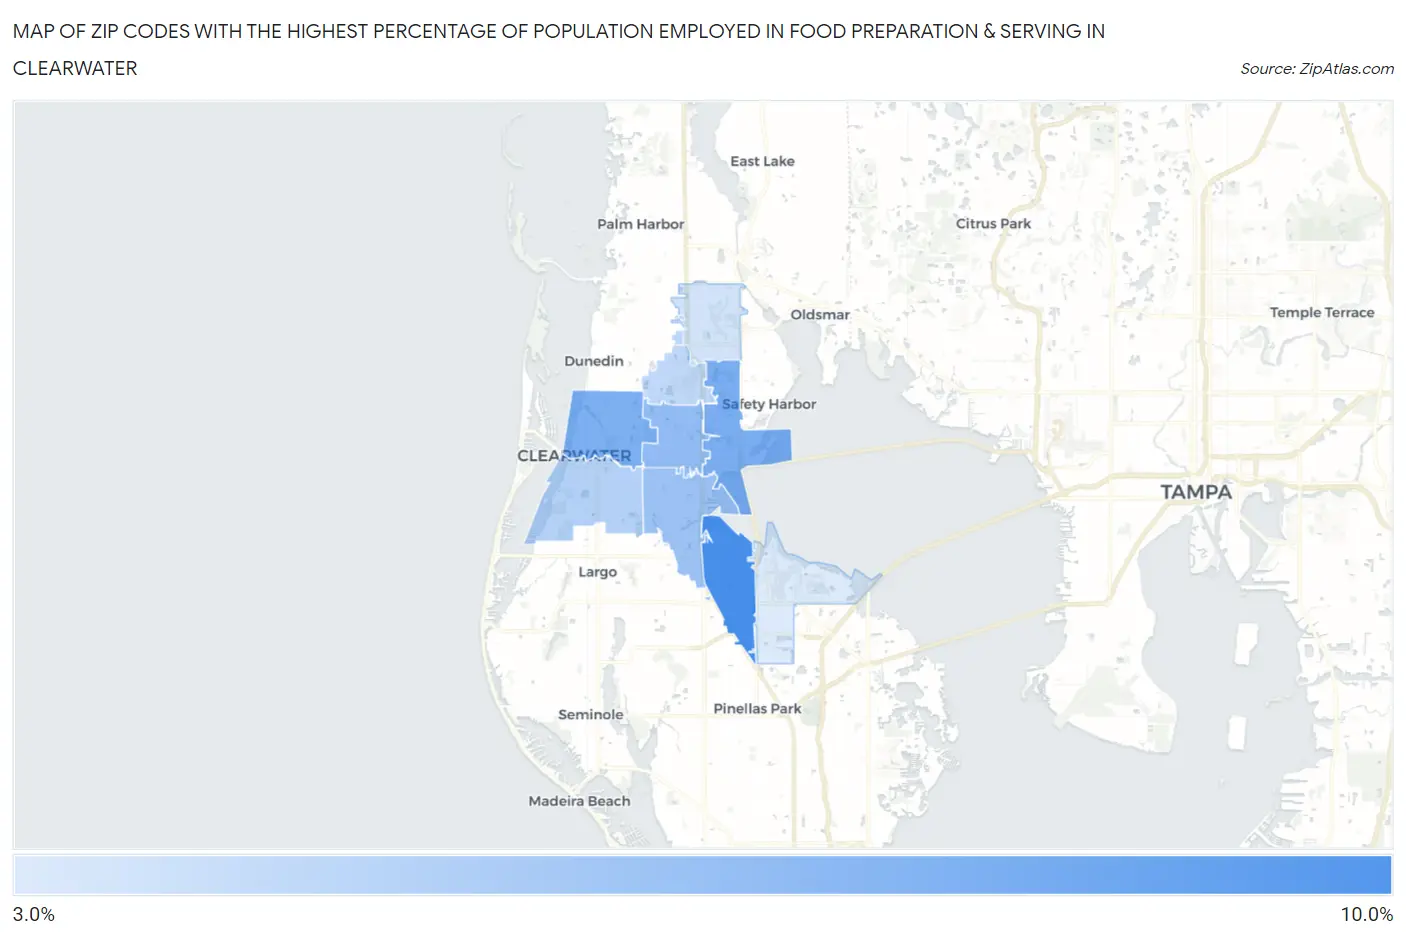
Zip Codes with the Highest Percentage of Population Employed in Food Preparation & Serving in Clearwater, FL
RELATED REPORTS & OPTIONS
Food Preparation & Serving
Clearwater
Compare Zip Codes
Map of Zip Codes with the Highest Percentage of Population Employed in Food Preparation & Serving in Clearwater
0.0%
10.0%
Zip Codes with the Highest Percentage of Population Employed in Food Preparation & Serving in Clearwater, FL
| Zip Code | % Employed | vs State | vs National | |
| 1. | 33760 | 9.8% | 6.1%(+3.76)#93 | 5.3%(+4.56)#2,755 |
| 2. | 33759 | 7.8% | 6.1%(+1.66)#224 | 5.3%(+2.47)#5,136 |
| 3. | 33755 | 7.7% | 6.1%(+1.64)#229 | 5.3%(+2.44)#5,168 |
| 4. | 33765 | 6.8% | 6.1%(+0.735)#339 | 5.3%(+1.54)#6,998 |
| 5. | 33764 | 6.4% | 6.1%(+0.329)#397 | 5.3%(+1.13)#8,095 |
| 6. | 33756 | 5.5% | 6.1%(-0.607)#534 | 5.3%(+0.197)#11,117 |
| 7. | 33763 | 5.0% | 6.1%(-1.07)#596 | 5.3%(-0.262)#12,846 |
| 8. | 33761 | 4.3% | 6.1%(-1.83)#688 | 5.3%(-1.02)#16,038 |
| 9. | 33762 | 3.9% | 6.1%(-2.23)#745 | 5.3%(-1.43)#17,709 |
1
Common Questions
What are the Top 5 Zip Codes with the Highest Percentage of Population Employed in Food Preparation & Serving in Clearwater, FL?
Top 5 Zip Codes with the Highest Percentage of Population Employed in Food Preparation & Serving in Clearwater, FL are:
What zip code has the Highest Percentage of Population Employed in Food Preparation & Serving in Clearwater, FL?
33760 has the Highest Percentage of Population Employed in Food Preparation & Serving in Clearwater, FL with 9.8%.
What is the Percentage of Population Employed in Food Preparation & Serving in Clearwater, FL?
Percentage of Population Employed in Food Preparation & Serving in Clearwater is 6.4%.
What is the Percentage of Population Employed in Food Preparation & Serving in Florida?
Percentage of Population Employed in Food Preparation & Serving in Florida is 6.1%.
What is the Percentage of Population Employed in Food Preparation & Serving in the United States?
Percentage of Population Employed in Food Preparation & Serving in the United States is 5.3%.