Zip Codes with the Highest Percentage of Population Employed in Food Preparation & Serving in Vero Beach, FL
RELATED REPORTS & OPTIONS
Food Preparation & Serving
Vero Beach
Compare Zip Codes
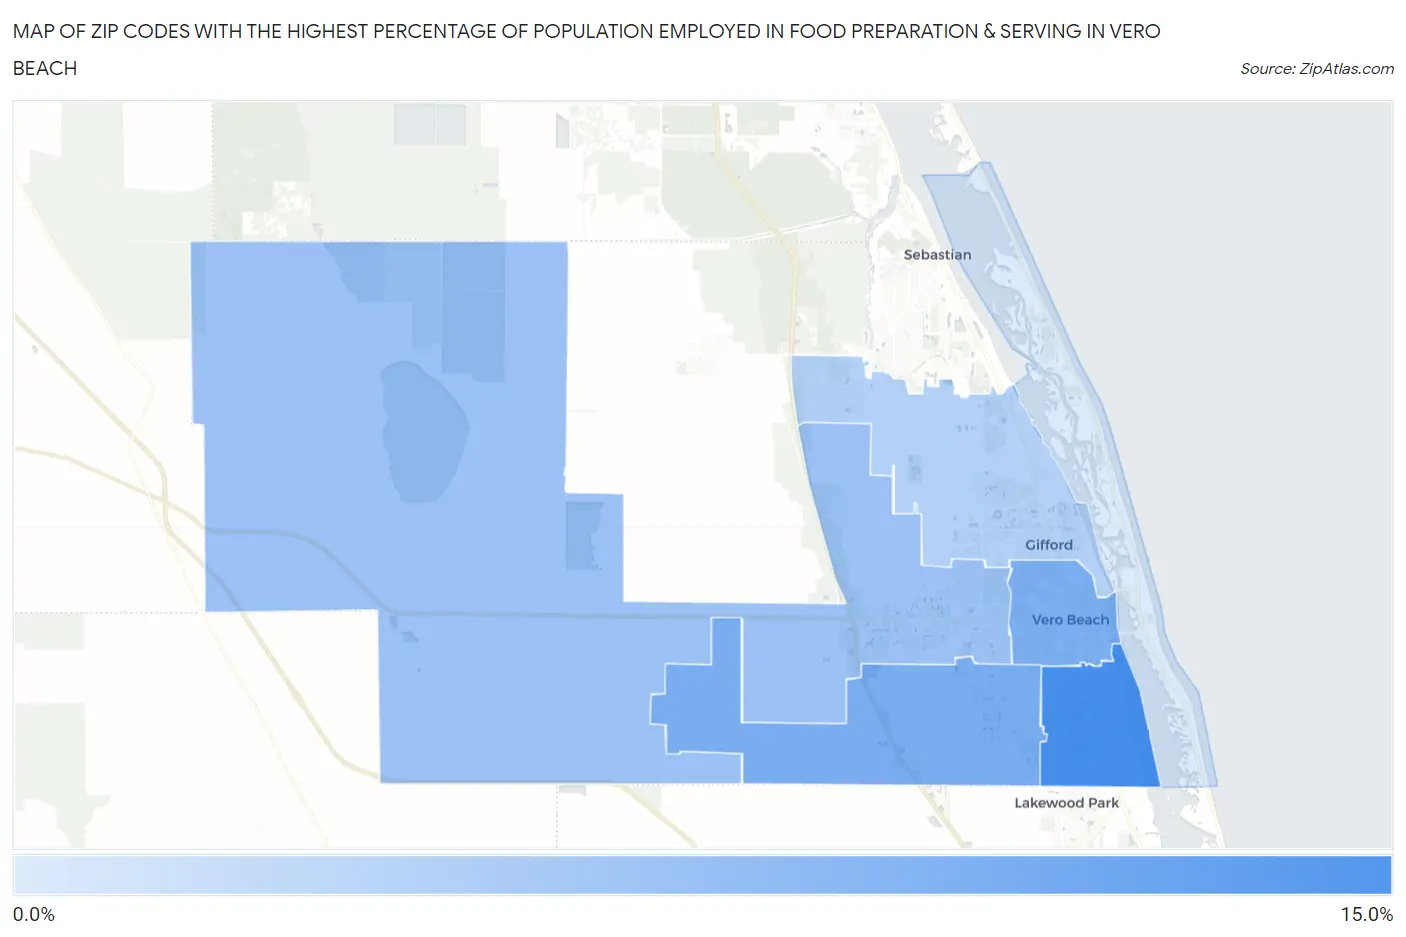
Map of Zip Codes with the Highest Percentage of Population Employed in Food Preparation & Serving in Vero Beach
0.0%
15.0%
Zip Codes with the Highest Percentage of Population Employed in Food Preparation & Serving in Vero Beach, FL
| Zip Code | % Employed | vs State | vs National | |
| 1. | 32962 | 10.8% | 6.1%(+4.67)#63 | 5.3%(+5.48)#2,171 |
| 2. | 32968 | 7.8% | 6.1%(+1.75)#210 | 5.3%(+2.55)#4,981 |
| 3. | 32960 | 7.8% | 6.1%(+1.66)#223 | 5.3%(+2.47)#5,134 |
| 4. | 32966 | 6.0% | 6.1%(-0.109)#461 | 5.3%(+0.696)#9,402 |
| 5. | 32967 | 4.7% | 6.1%(-1.36)#642 | 5.3%(-0.560)#14,055 |
| 6. | 32963 | 2.4% | 6.1%(-3.67)#861 | 5.3%(-2.87)#23,408 |
1
Common Questions
What are the Top 5 Zip Codes with the Highest Percentage of Population Employed in Food Preparation & Serving in Vero Beach, FL?
Top 5 Zip Codes with the Highest Percentage of Population Employed in Food Preparation & Serving in Vero Beach, FL are:
What zip code has the Highest Percentage of Population Employed in Food Preparation & Serving in Vero Beach, FL?
32962 has the Highest Percentage of Population Employed in Food Preparation & Serving in Vero Beach, FL with 10.8%.
What is the Percentage of Population Employed in Food Preparation & Serving in Vero Beach, FL?
Percentage of Population Employed in Food Preparation & Serving in Vero Beach is 3.9%.
What is the Percentage of Population Employed in Food Preparation & Serving in Florida?
Percentage of Population Employed in Food Preparation & Serving in Florida is 6.1%.
What is the Percentage of Population Employed in Food Preparation & Serving in the United States?
Percentage of Population Employed in Food Preparation & Serving in the United States is 5.3%.