Zip Codes with the Highest Percentage of Population Employed in Food Preparation & Serving in Ocala, FL
RELATED REPORTS & OPTIONS
Food Preparation & Serving
Ocala
Compare Zip Codes
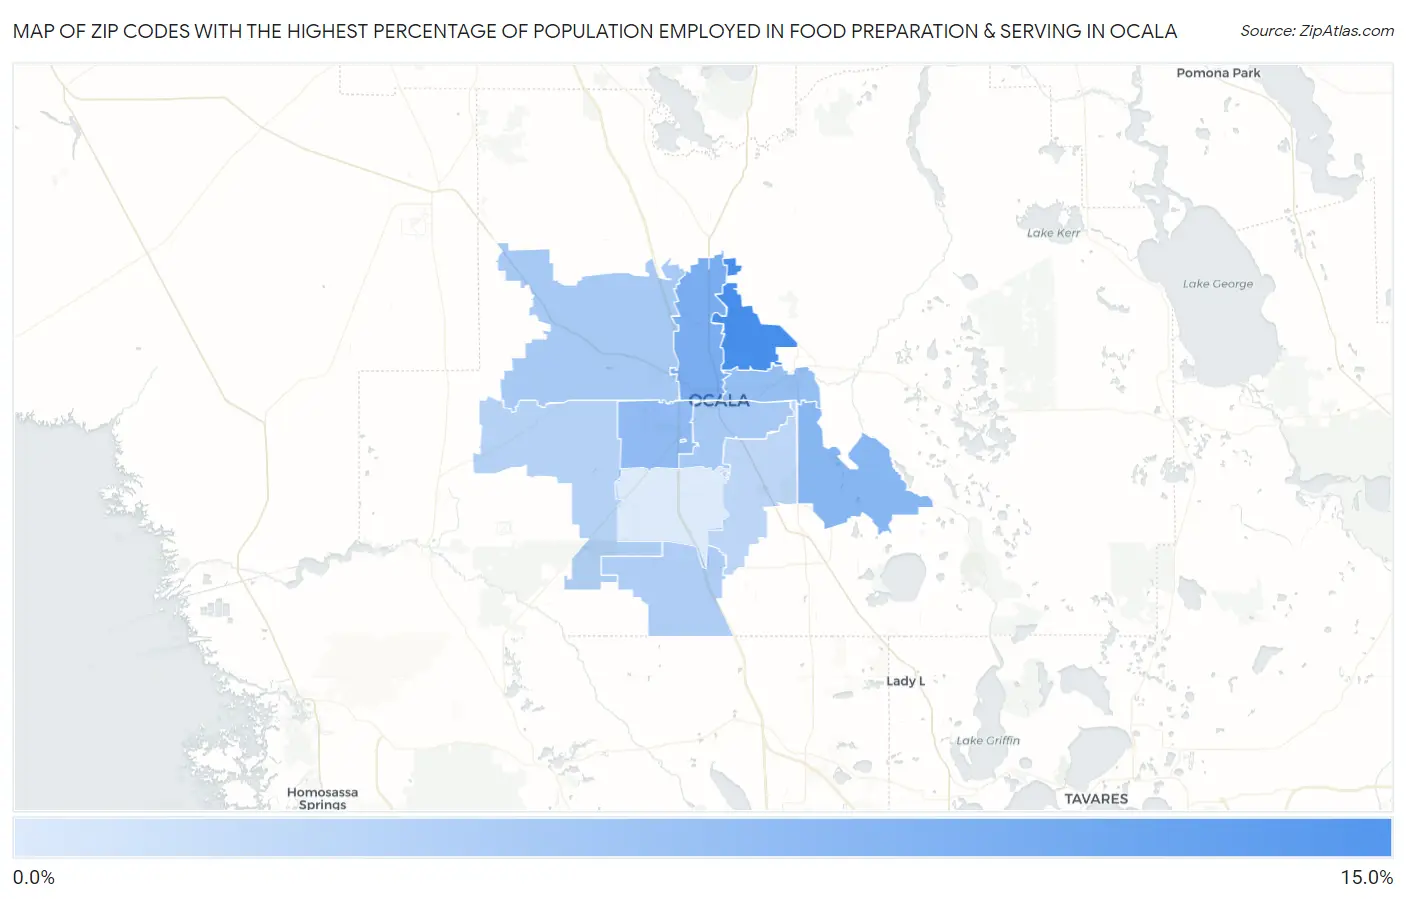
Map of Zip Codes with the Highest Percentage of Population Employed in Food Preparation & Serving in Ocala
0.0%
15.0%
Zip Codes with the Highest Percentage of Population Employed in Food Preparation & Serving in Ocala, FL
| Zip Code | % Employed | vs State | vs National | |
| 1. | 34479 | 11.8% | 6.1%(+5.75)#45 | 5.3%(+6.55)#1,723 |
| 2. | 34475 | 8.3% | 6.1%(+2.16)#176 | 5.3%(+2.97)#4,371 |
| 3. | 34472 | 7.4% | 6.1%(+1.28)#273 | 5.3%(+2.08)#5,804 |
| 4. | 34474 | 6.7% | 6.1%(+0.601)#362 | 5.3%(+1.41)#7,359 |
| 5. | 34470 | 6.5% | 6.1%(+0.360)#390 | 5.3%(+1.16)#8,006 |
| 6. | 34471 | 5.2% | 6.1%(-0.898)#570 | 5.3%(-0.094)#12,177 |
| 7. | 34482 | 5.2% | 6.1%(-0.906)#573 | 5.3%(-0.102)#12,221 |
| 8. | 34473 | 4.8% | 6.1%(-1.33)#636 | 5.3%(-0.524)#13,901 |
| 9. | 34481 | 4.2% | 6.1%(-1.86)#692 | 5.3%(-1.06)#16,197 |
| 10. | 34480 | 3.8% | 6.1%(-2.29)#752 | 5.3%(-1.48)#17,920 |
| 11. | 34476 | 1.7% | 6.1%(-4.37)#900 | 5.3%(-3.56)#25,476 |
1
Common Questions
What are the Top 10 Zip Codes with the Highest Percentage of Population Employed in Food Preparation & Serving in Ocala, FL?
Top 10 Zip Codes with the Highest Percentage of Population Employed in Food Preparation & Serving in Ocala, FL are:
What zip code has the Highest Percentage of Population Employed in Food Preparation & Serving in Ocala, FL?
34479 has the Highest Percentage of Population Employed in Food Preparation & Serving in Ocala, FL with 11.8%.
What is the Percentage of Population Employed in Food Preparation & Serving in Ocala, FL?
Percentage of Population Employed in Food Preparation & Serving in Ocala is 6.8%.
What is the Percentage of Population Employed in Food Preparation & Serving in Florida?
Percentage of Population Employed in Food Preparation & Serving in Florida is 6.1%.
What is the Percentage of Population Employed in Food Preparation & Serving in the United States?
Percentage of Population Employed in Food Preparation & Serving in the United States is 5.3%.