Zip Codes with the Highest Percentage of Population Employed in Food Preparation & Serving in Inverness, FL
RELATED REPORTS & OPTIONS
Food Preparation & Serving
Inverness
Compare Zip Codes
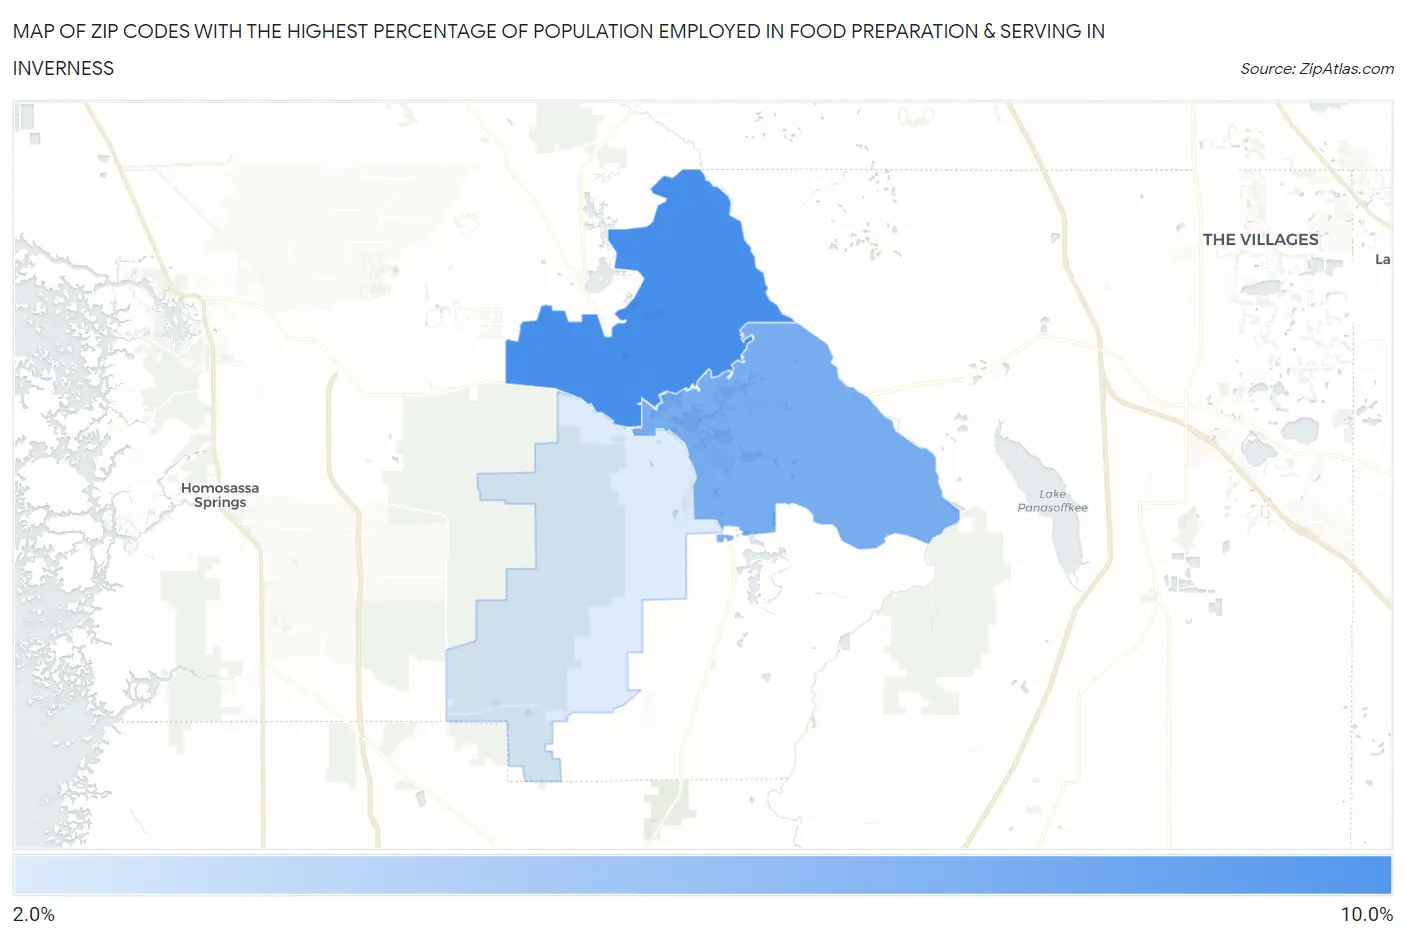
Map of Zip Codes with the Highest Percentage of Population Employed in Food Preparation & Serving in Inverness
0.0%
10.0%
Zip Codes with the Highest Percentage of Population Employed in Food Preparation & Serving in Inverness, FL
| Zip Code | % Employed | vs State | vs National | |
| 1. | 34453 | 9.3% | 6.1%(+3.22)#121 | 5.3%(+4.03)#3,224 |
| 2. | 34450 | 7.2% | 6.1%(+1.06)#296 | 5.3%(+1.87)#6,225 |
| 3. | 34452 | 2.9% | 6.1%(-3.19)#828 | 5.3%(-2.39)#21,655 |
1
Common Questions
What are the Top Zip Codes with the Highest Percentage of Population Employed in Food Preparation & Serving in Inverness, FL?
Top Zip Codes with the Highest Percentage of Population Employed in Food Preparation & Serving in Inverness, FL are:
What zip code has the Highest Percentage of Population Employed in Food Preparation & Serving in Inverness, FL?
34453 has the Highest Percentage of Population Employed in Food Preparation & Serving in Inverness, FL with 9.3%.
What is the Percentage of Population Employed in Food Preparation & Serving in Inverness, FL?
Percentage of Population Employed in Food Preparation & Serving in Inverness is 7.5%.
What is the Percentage of Population Employed in Food Preparation & Serving in Florida?
Percentage of Population Employed in Food Preparation & Serving in Florida is 6.1%.
What is the Percentage of Population Employed in Food Preparation & Serving in the United States?
Percentage of Population Employed in Food Preparation & Serving in the United States is 5.3%.