Zip Codes with the Highest Percentage of Population Employed in Health Diagnosing & Treating in Tampa, FL
RELATED REPORTS & OPTIONS
Health Diagnosing & Treating
Tampa
Compare Zip Codes
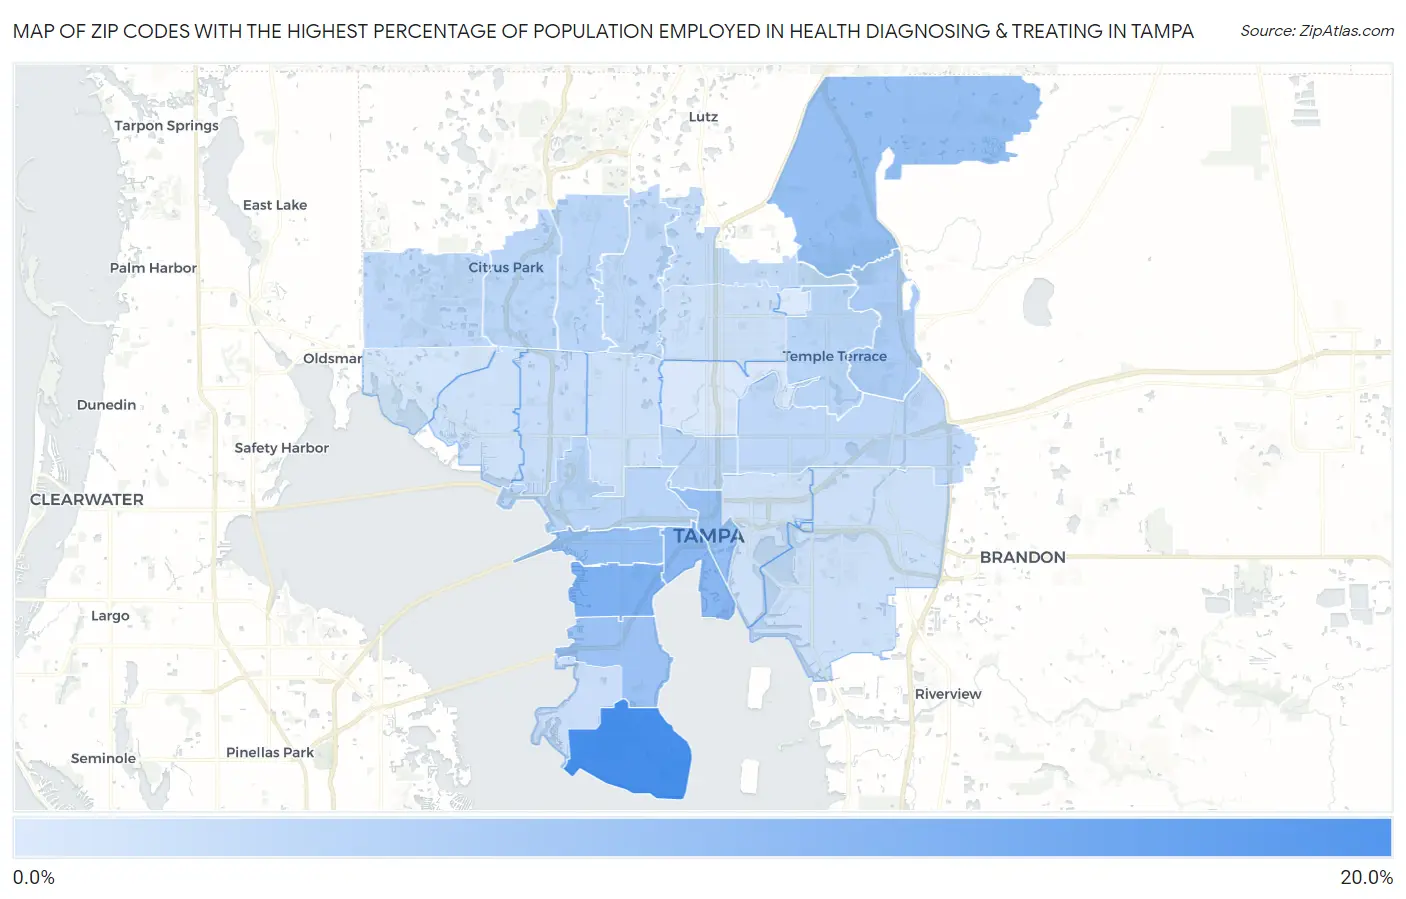
Map of Zip Codes with the Highest Percentage of Population Employed in Health Diagnosing & Treating in Tampa
0.0%
20.0%
Zip Codes with the Highest Percentage of Population Employed in Health Diagnosing & Treating in Tampa, FL
| Zip Code | % Employed | vs State | vs National | |
| 1. | 33621 | 18.2% | 6.4%(+11.8)#13 | 6.2%(+12.0)#685 |
| 2. | 33629 | 12.3% | 6.4%(+5.83)#47 | 6.2%(+6.03)#2,072 |
| 3. | 33606 | 11.2% | 6.4%(+4.74)#68 | 6.2%(+4.94)#2,751 |
| 4. | 33609 | 10.0% | 6.4%(+3.55)#99 | 6.2%(+3.76)#3,884 |
| 5. | 33647 | 9.9% | 6.4%(+3.42)#103 | 6.2%(+3.62)#4,033 |
| 6. | 33602 | 9.7% | 6.4%(+3.24)#110 | 6.2%(+3.44)#4,270 |
| 7. | 33611 | 9.4% | 6.4%(+2.97)#123 | 6.2%(+3.17)#4,654 |
| 8. | 33637 | 7.5% | 6.4%(+1.08)#273 | 6.2%(+1.28)#8,730 |
| 9. | 33607 | 6.3% | 6.4%(-0.165)#456 | 6.2%(+0.039)#12,820 |
| 10. | 33625 | 6.3% | 6.4%(-0.168)#459 | 6.2%(+0.036)#12,832 |
| 11. | 33624 | 6.2% | 6.4%(-0.216)#471 | 6.2%(-0.011)#13,025 |
| 12. | 33617 | 6.1% | 6.4%(-0.302)#486 | 6.2%(-0.098)#13,352 |
| 13. | 33603 | 6.1% | 6.4%(-0.377)#499 | 6.2%(-0.172)#13,605 |
| 14. | 33618 | 5.8% | 6.4%(-0.601)#531 | 6.2%(-0.397)#14,424 |
| 15. | 33610 | 5.8% | 6.4%(-0.632)#537 | 6.2%(-0.428)#14,539 |
| 16. | 33626 | 5.8% | 6.4%(-0.644)#539 | 6.2%(-0.440)#14,594 |
| 17. | 33613 | 5.4% | 6.4%(-1.09)#601 | 6.2%(-0.882)#16,318 |
| 18. | 33634 | 4.8% | 6.4%(-1.61)#670 | 6.2%(-1.40)#18,321 |
| 19. | 33616 | 4.6% | 6.4%(-1.85)#701 | 6.2%(-1.64)#19,244 |
| 20. | 33619 | 4.5% | 6.4%(-1.92)#714 | 6.2%(-1.72)#19,531 |
| 21. | 33614 | 4.4% | 6.4%(-2.00)#723 | 6.2%(-1.79)#19,827 |
| 22. | 33612 | 4.4% | 6.4%(-2.08)#731 | 6.2%(-1.87)#20,091 |
| 23. | 33615 | 4.3% | 6.4%(-2.11)#735 | 6.2%(-1.91)#20,214 |
| 24. | 33605 | 4.1% | 6.4%(-2.33)#765 | 6.2%(-2.12)#20,987 |
| 25. | 33635 | 3.8% | 6.4%(-2.67)#800 | 6.2%(-2.47)#22,062 |
| 26. | 33604 | 3.0% | 6.4%(-3.41)#857 | 6.2%(-3.20)#24,206 |
| 27. | 33620 | 2.9% | 6.4%(-3.55)#867 | 6.2%(-3.34)#24,571 |
1
Common Questions
What are the Top 10 Zip Codes with the Highest Percentage of Population Employed in Health Diagnosing & Treating in Tampa, FL?
Top 10 Zip Codes with the Highest Percentage of Population Employed in Health Diagnosing & Treating in Tampa, FL are:
What zip code has the Highest Percentage of Population Employed in Health Diagnosing & Treating in Tampa, FL?
33621 has the Highest Percentage of Population Employed in Health Diagnosing & Treating in Tampa, FL with 18.2%.
What is the Percentage of Population Employed in Health Diagnosing & Treating in Tampa, FL?
Percentage of Population Employed in Health Diagnosing & Treating in Tampa is 7.5%.
What is the Percentage of Population Employed in Health Diagnosing & Treating in Florida?
Percentage of Population Employed in Health Diagnosing & Treating in Florida is 6.4%.
What is the Percentage of Population Employed in Health Diagnosing & Treating in the United States?
Percentage of Population Employed in Health Diagnosing & Treating in the United States is 6.2%.