Guamanian/Chamorro vs Dominican Currently Married
COMPARE
Guamanian/Chamorro
Dominican
Currently Married
Currently Married Comparison
Guamanians/Chamorros
Dominicans
47.1%
CURRENTLY MARRIED
74.2/ 100
METRIC RATING
143rd/ 347
METRIC RANK
39.5%
CURRENTLY MARRIED
0.0/ 100
METRIC RATING
339th/ 347
METRIC RANK
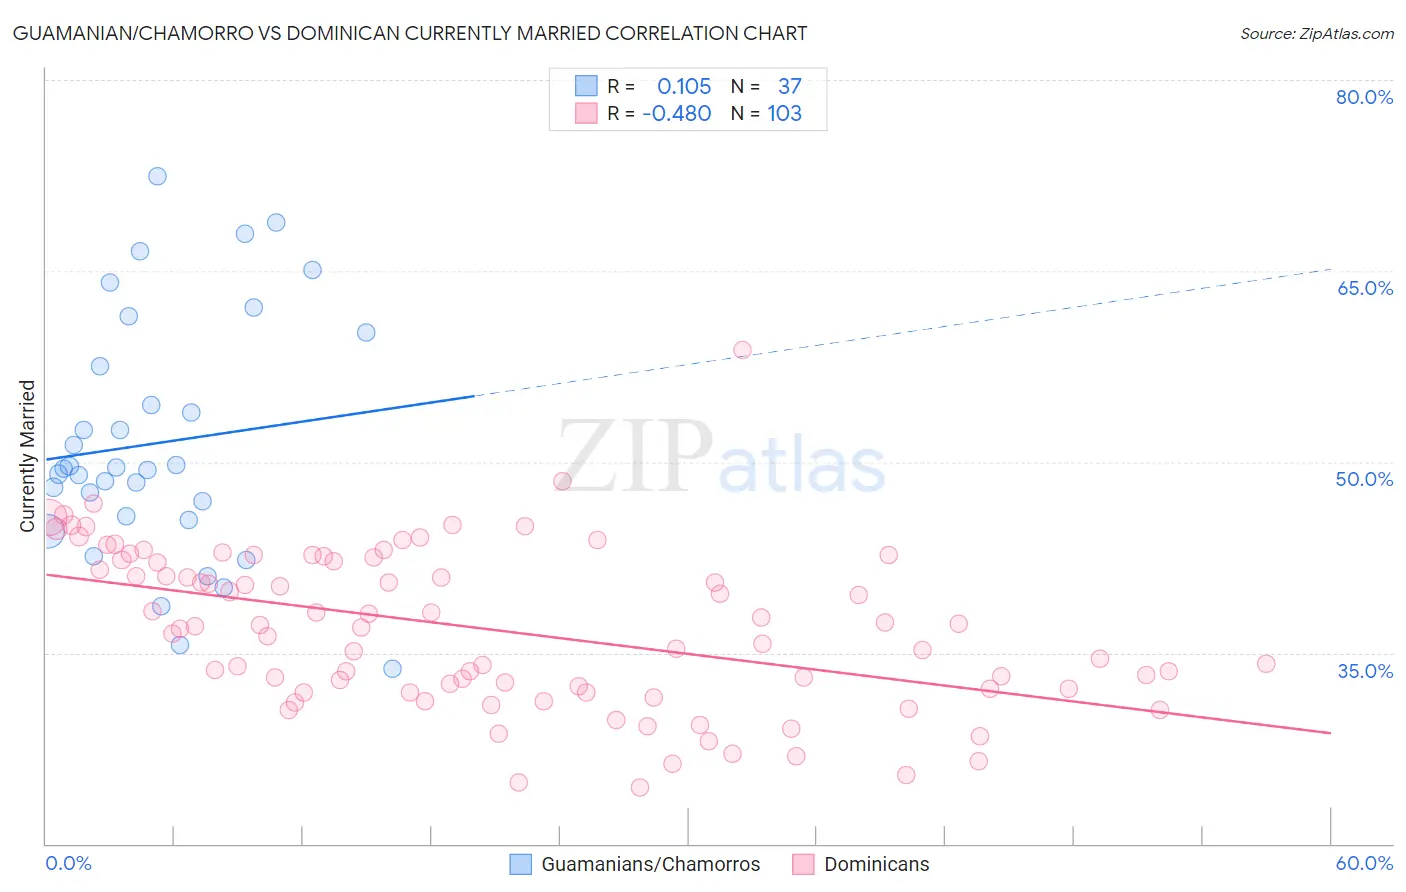
Guamanian/Chamorro vs Dominican Currently Married Correlation Chart
The statistical analysis conducted on geographies consisting of 221,951,395 people shows a poor positive correlation between the proportion of Guamanians/Chamorros and percentage of population currently married in the United States with a correlation coefficient (R) of 0.105 and weighted average of 47.1%. Similarly, the statistical analysis conducted on geographies consisting of 355,078,950 people shows a moderate negative correlation between the proportion of Dominicans and percentage of population currently married in the United States with a correlation coefficient (R) of -0.480 and weighted average of 39.5%, a difference of 19.1%.
Currently Married Correlation Summary
| Measurement | Guamanian/Chamorro | Dominican |
| Minimum | 33.7% | 24.4% |
| Maximum | 72.4% | 58.8% |
| Range | 38.7% | 34.4% |
| Mean | 51.5% | 36.9% |
| Median | 49.5% | 37.0% |
| Interquartile 25% (IQ1) | 45.6% | 32.2% |
| Interquartile 75% (IQ3) | 58.9% | 42.3% |
| Interquartile Range (IQR) | 13.3% | 10.1% |
| Standard Deviation (Sample) | 9.5% | 6.3% |
| Standard Deviation (Population) | 9.4% | 6.2% |
Similar Demographics by Currently Married
Demographics Similar to Guamanians/Chamorros by Currently Married
In terms of currently married, the demographic groups most similar to Guamanians/Chamorros are Venezuelan (47.1%, a difference of 0.010%), Argentinean (47.1%, a difference of 0.010%), Hmong (47.1%, a difference of 0.040%), Cajun (47.1%, a difference of 0.050%), and Immigrants from South Eastern Asia (47.1%, a difference of 0.060%).
| Demographics | Rating | Rank | Currently Married |
| Immigrants | Vietnam | 78.2 /100 | #136 | Good 47.2% |
| Paraguayans | 77.8 /100 | #137 | Good 47.2% |
| Pakistanis | 77.5 /100 | #138 | Good 47.2% |
| Yugoslavians | 77.4 /100 | #139 | Good 47.2% |
| Cajuns | 75.3 /100 | #140 | Good 47.1% |
| Venezuelans | 74.4 /100 | #141 | Good 47.1% |
| Argentineans | 74.4 /100 | #142 | Good 47.1% |
| Guamanians/Chamorros | 74.2 /100 | #143 | Good 47.1% |
| Hmong | 73.4 /100 | #144 | Good 47.1% |
| Immigrants | South Eastern Asia | 72.9 /100 | #145 | Good 47.1% |
| Carpatho Rusyns | 72.6 /100 | #146 | Good 47.0% |
| Immigrants | Argentina | 72.0 /100 | #147 | Good 47.0% |
| Cambodians | 70.4 /100 | #148 | Good 47.0% |
| Zimbabweans | 70.1 /100 | #149 | Good 47.0% |
| Immigrants | Turkey | 70.0 /100 | #150 | Good 47.0% |
Demographics Similar to Dominicans by Currently Married
In terms of currently married, the demographic groups most similar to Dominicans are Cape Verdean (39.6%, a difference of 0.15%), Black/African American (39.6%, a difference of 0.25%), British West Indian (39.8%, a difference of 0.63%), Lumbee (39.8%, a difference of 0.80%), and Immigrants from Grenada (39.1%, a difference of 0.96%).
| Demographics | Rating | Rank | Currently Married |
| Immigrants | St. Vincent and the Grenadines | 0.0 /100 | #332 | Tragic 40.1% |
| Yup'ik | 0.0 /100 | #333 | Tragic 39.9% |
| Puerto Ricans | 0.0 /100 | #334 | Tragic 39.9% |
| Lumbee | 0.0 /100 | #335 | Tragic 39.8% |
| British West Indians | 0.0 /100 | #336 | Tragic 39.8% |
| Blacks/African Americans | 0.0 /100 | #337 | Tragic 39.6% |
| Cape Verdeans | 0.0 /100 | #338 | Tragic 39.6% |
| Dominicans | 0.0 /100 | #339 | Tragic 39.5% |
| Immigrants | Grenada | 0.0 /100 | #340 | Tragic 39.1% |
| Navajo | 0.0 /100 | #341 | Tragic 39.0% |
| Immigrants | Dominican Republic | 0.0 /100 | #342 | Tragic 38.9% |
| Pueblo | 0.0 /100 | #343 | Tragic 38.2% |
| Immigrants | Cabo Verde | 0.0 /100 | #344 | Tragic 37.8% |
| Tohono O'odham | 0.0 /100 | #345 | Tragic 36.8% |
| Hopi | 0.0 /100 | #346 | Tragic 36.5% |