Zip Codes with the Highest Percentage of Population Employed in Life, Physical & Social Science in Turlock, CA
RELATED REPORTS & OPTIONS
Life, Physical & Social Science
Turlock
Compare Zip Codes
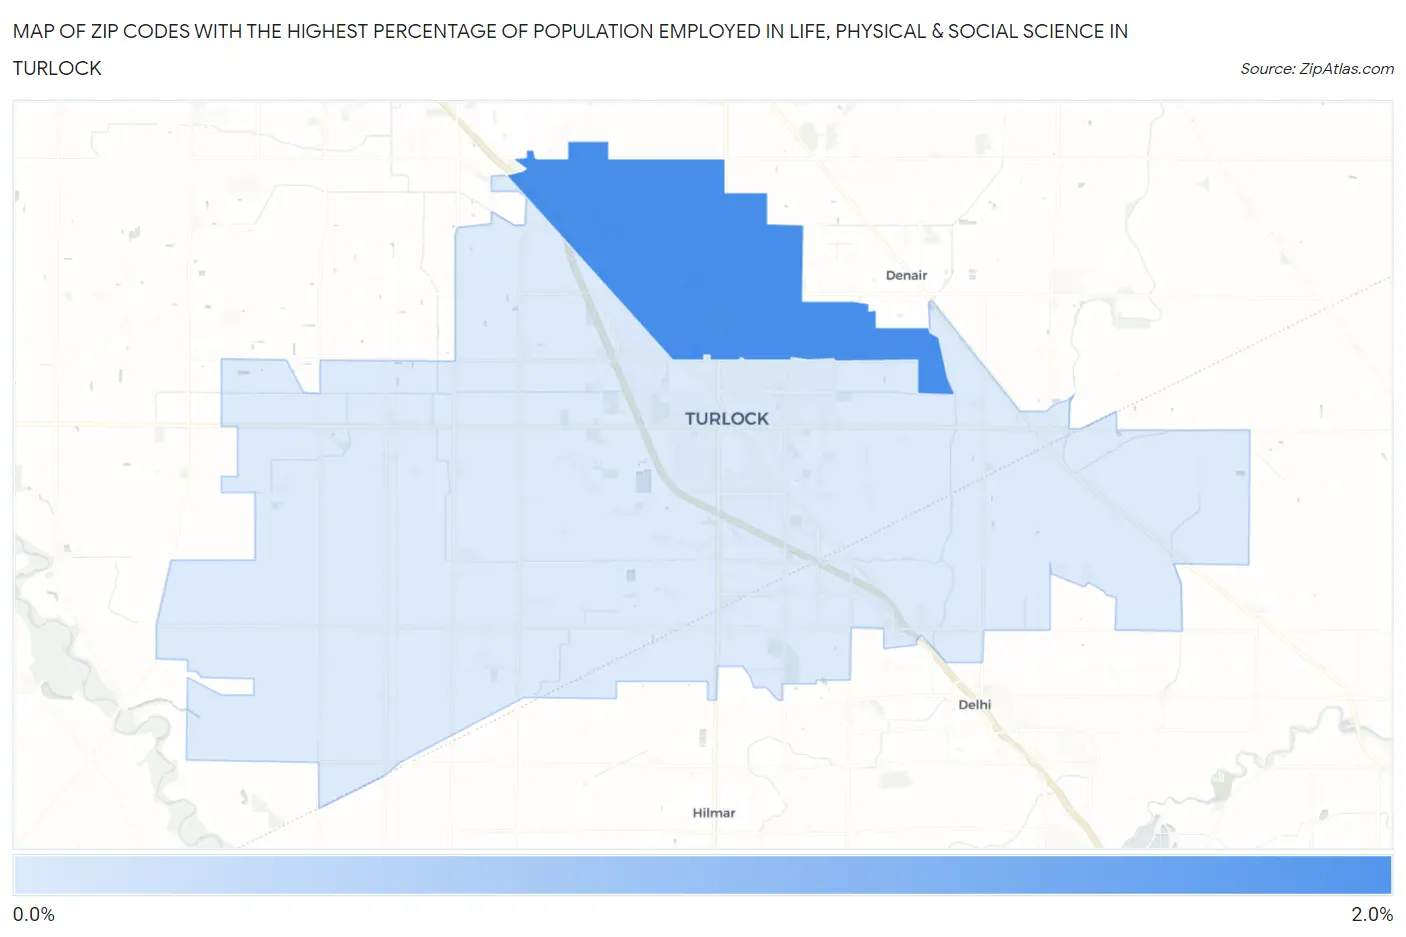
Map of Zip Codes with the Highest Percentage of Population Employed in Life, Physical & Social Science in Turlock
0.0%
2.0%
Zip Codes with the Highest Percentage of Population Employed in Life, Physical & Social Science in Turlock, CA
| Zip Code | % Employed | vs State | vs National | |
| 1. | 95382 | 1.6% | 1.3%(+0.322)#438 | 1.1%(+0.539)#5,031 |
| 2. | 95380 | 0.64% | 1.3%(-0.670)#984 | 1.1%(-0.453)#12,816 |
1
Common Questions
What are the Top Zip Codes with the Highest Percentage of Population Employed in Life, Physical & Social Science in Turlock, CA?
Top Zip Codes with the Highest Percentage of Population Employed in Life, Physical & Social Science in Turlock, CA are:
What zip code has the Highest Percentage of Population Employed in Life, Physical & Social Science in Turlock, CA?
95382 has the Highest Percentage of Population Employed in Life, Physical & Social Science in Turlock, CA with 1.6%.
What is the Percentage of Population Employed in Life, Physical & Social Science in Turlock, CA?
Percentage of Population Employed in Life, Physical & Social Science in Turlock is 1.2%.
What is the Percentage of Population Employed in Life, Physical & Social Science in California?
Percentage of Population Employed in Life, Physical & Social Science in California is 1.3%.
What is the Percentage of Population Employed in Life, Physical & Social Science in the United States?
Percentage of Population Employed in Life, Physical & Social Science in the United States is 1.1%.