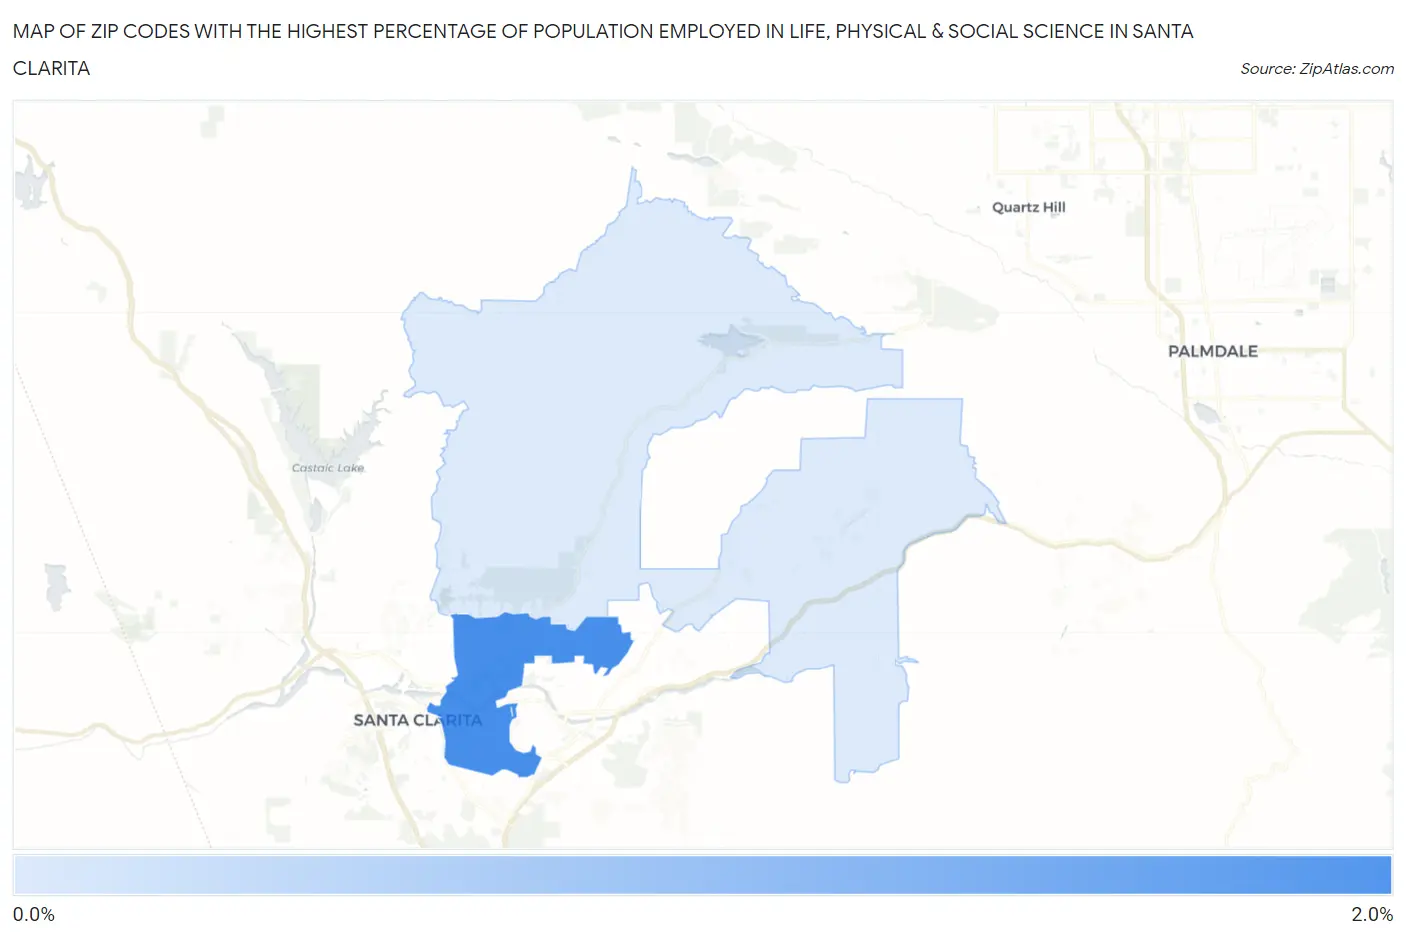
Zip Codes with the Highest Percentage of Population Employed in Life, Physical & Social Science in Santa Clarita, CA
RELATED REPORTS & OPTIONS
Life, Physical & Social Science
Santa Clarita
Compare Zip Codes
Map of Zip Codes with the Highest Percentage of Population Employed in Life, Physical & Social Science in Santa Clarita
0.0%
2.0%
Zip Codes with the Highest Percentage of Population Employed in Life, Physical & Social Science in Santa Clarita, CA
| Zip Code | % Employed | vs State | vs National | |
| 1. | 91350 | 1.7% | 1.3%(+0.436)#393 | 1.1%(+0.653)#4,530 |
| 2. | 91390 | 0.81% | 1.3%(-0.499)#873 | 1.1%(-0.282)#10,903 |
1
Common Questions
What are the Top Zip Codes with the Highest Percentage of Population Employed in Life, Physical & Social Science in Santa Clarita, CA?
Top Zip Codes with the Highest Percentage of Population Employed in Life, Physical & Social Science in Santa Clarita, CA are:
What zip code has the Highest Percentage of Population Employed in Life, Physical & Social Science in Santa Clarita, CA?
91350 has the Highest Percentage of Population Employed in Life, Physical & Social Science in Santa Clarita, CA with 1.7%.
What is the Percentage of Population Employed in Life, Physical & Social Science in Santa Clarita, CA?
Percentage of Population Employed in Life, Physical & Social Science in Santa Clarita is 1.3%.
What is the Percentage of Population Employed in Life, Physical & Social Science in California?
Percentage of Population Employed in Life, Physical & Social Science in California is 1.3%.
What is the Percentage of Population Employed in Life, Physical & Social Science in the United States?
Percentage of Population Employed in Life, Physical & Social Science in the United States is 1.1%.