Zip Codes with the Highest Percentage of Population Employed in Food Preparation & Serving in Warrenton, VA
RELATED REPORTS & OPTIONS
Food Preparation & Serving
Warrenton
Compare Zip Codes
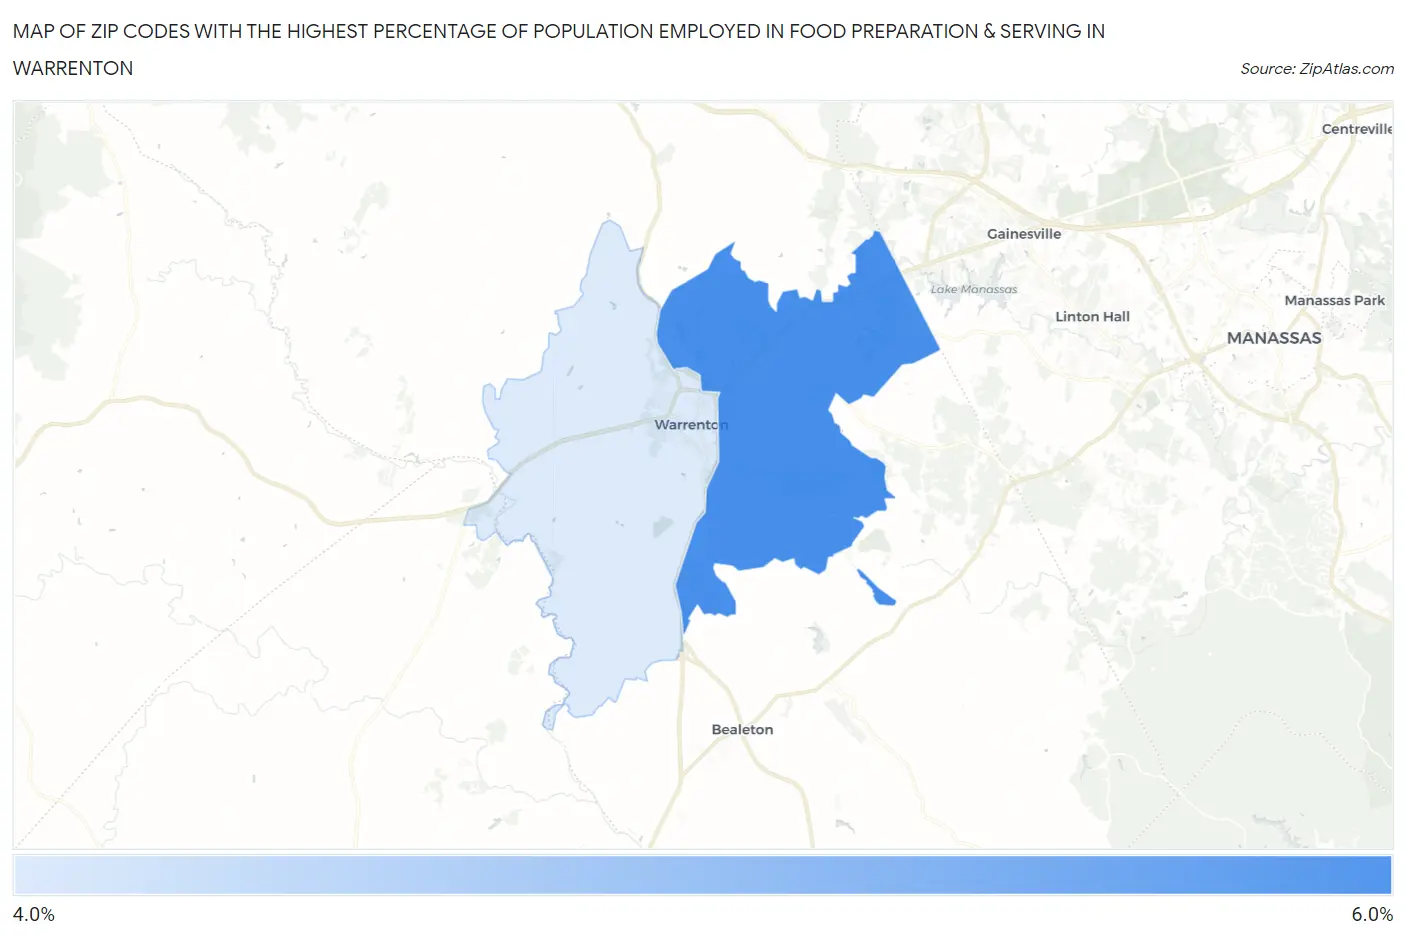
Map of Zip Codes with the Highest Percentage of Population Employed in Food Preparation & Serving in Warrenton
0.0%
6.0%
Zip Codes with the Highest Percentage of Population Employed in Food Preparation & Serving in Warrenton, VA
| Zip Code | % Employed | vs State | vs National | |
| 1. | 20187 | 5.1% | 4.8%(+0.327)#280 | 5.3%(-0.173)#12,491 |
| 2. | 20186 | 4.4% | 4.8%(-0.400)#358 | 5.3%(-0.899)#15,475 |
1
Common Questions
What are the Top Zip Codes with the Highest Percentage of Population Employed in Food Preparation & Serving in Warrenton, VA?
Top Zip Codes with the Highest Percentage of Population Employed in Food Preparation & Serving in Warrenton, VA are:
What zip code has the Highest Percentage of Population Employed in Food Preparation & Serving in Warrenton, VA?
20187 has the Highest Percentage of Population Employed in Food Preparation & Serving in Warrenton, VA with 5.1%.
What is the Percentage of Population Employed in Food Preparation & Serving in Warrenton, VA?
Percentage of Population Employed in Food Preparation & Serving in Warrenton is 3.5%.
What is the Percentage of Population Employed in Food Preparation & Serving in Virginia?
Percentage of Population Employed in Food Preparation & Serving in Virginia is 4.8%.
What is the Percentage of Population Employed in Food Preparation & Serving in the United States?
Percentage of Population Employed in Food Preparation & Serving in the United States is 5.3%.