Zip Codes with the Highest Percentage of Population Employed in Office & Administration in Warrenton, VA
RELATED REPORTS & OPTIONS
Office & Administration
Warrenton
Compare Zip Codes
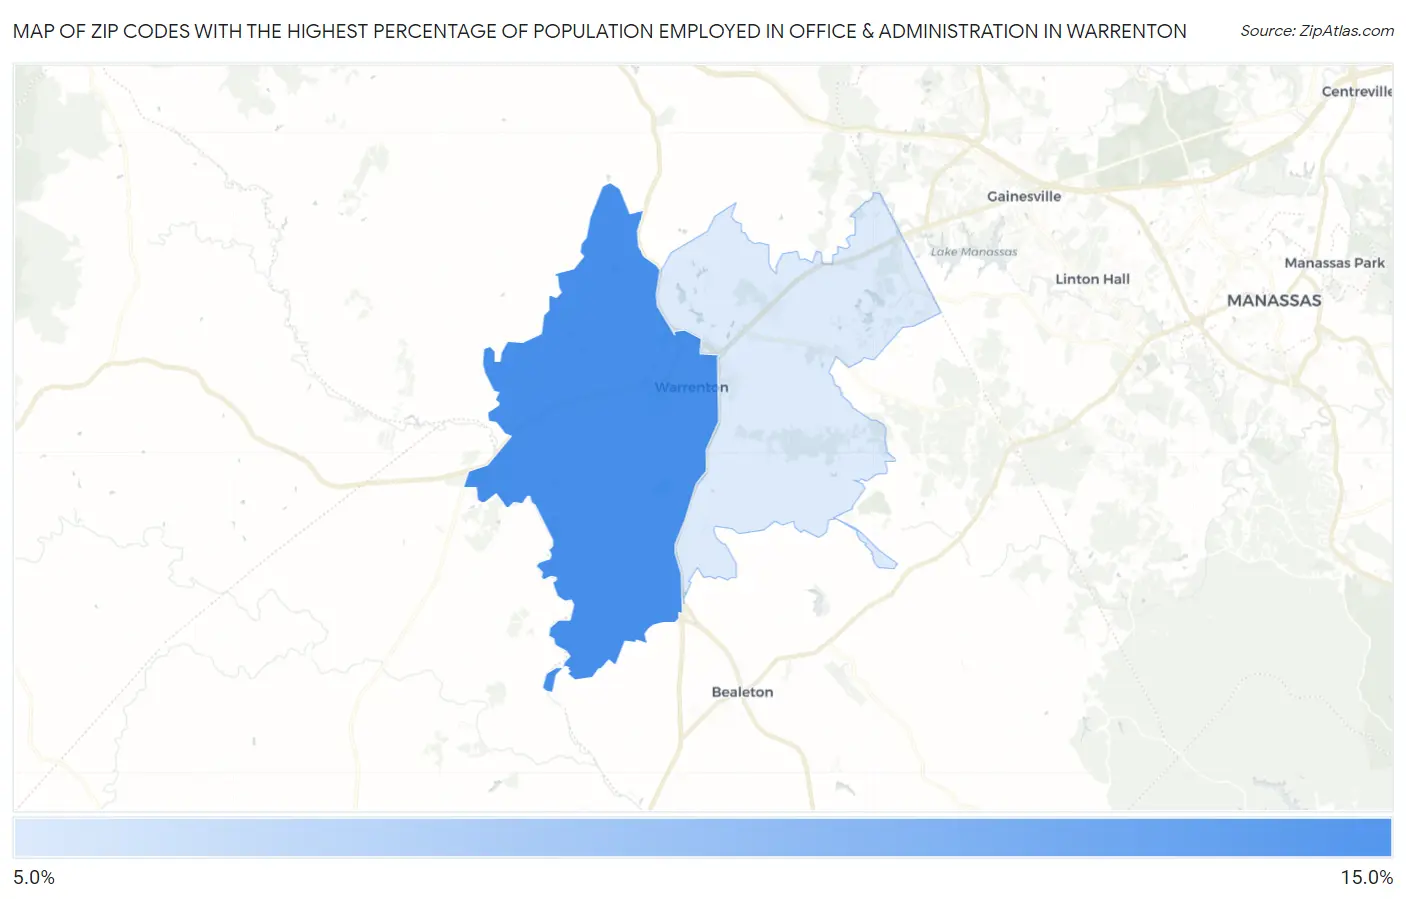
Map of Zip Codes with the Highest Percentage of Population Employed in Office & Administration in Warrenton
0.0%
15.0%
Zip Codes with the Highest Percentage of Population Employed in Office & Administration in Warrenton, VA
| Zip Code | % Employed | vs State | vs National | |
| 1. | 20186 | 11.1% | 10.0%(+1.11)#318 | 10.9%(+0.242)#13,538 |
| 2. | 20187 | 9.5% | 10.0%(-0.503)#433 | 10.9%(-1.37)#18,822 |
1
Common Questions
What are the Top Zip Codes with the Highest Percentage of Population Employed in Office & Administration in Warrenton, VA?
Top Zip Codes with the Highest Percentage of Population Employed in Office & Administration in Warrenton, VA are:
What zip code has the Highest Percentage of Population Employed in Office & Administration in Warrenton, VA?
20186 has the Highest Percentage of Population Employed in Office & Administration in Warrenton, VA with 11.1%.
What is the Percentage of Population Employed in Office & Administration in Warrenton, VA?
Percentage of Population Employed in Office & Administration in Warrenton is 11.6%.
What is the Percentage of Population Employed in Office & Administration in Virginia?
Percentage of Population Employed in Office & Administration in Virginia is 10.0%.
What is the Percentage of Population Employed in Office & Administration in the United States?
Percentage of Population Employed in Office & Administration in the United States is 10.9%.