Zip Codes with the Highest Percentage of Population Employed in Food Preparation & Serving in Suffolk, VA
RELATED REPORTS & OPTIONS
Food Preparation & Serving
Suffolk
Compare Zip Codes
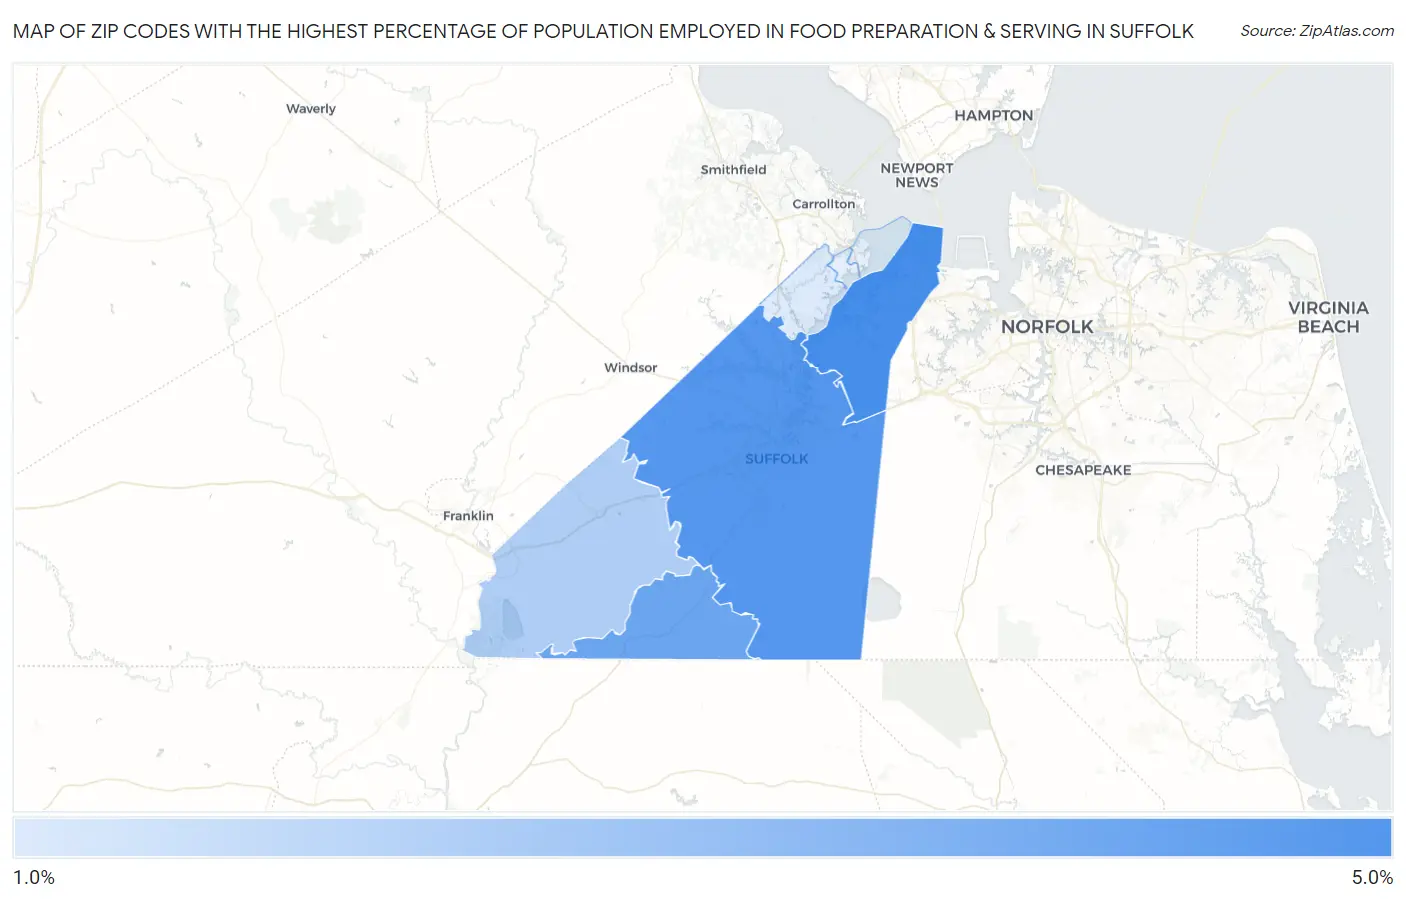
Map of Zip Codes with the Highest Percentage of Population Employed in Food Preparation & Serving in Suffolk
0.0%
5.0%
Zip Codes with the Highest Percentage of Population Employed in Food Preparation & Serving in Suffolk, VA
| Zip Code | % Employed | vs State | vs National | |
| 1. | 23435 | 4.3% | 4.8%(-0.464)#367 | 5.3%(-0.964)#15,778 |
| 2. | 23434 | 4.1% | 4.8%(-0.736)#394 | 5.3%(-1.24)#16,931 |
| 3. | 23438 | 3.6% | 4.8%(-1.19)#453 | 5.3%(-1.69)#18,802 |
| 4. | 23437 | 2.2% | 4.8%(-2.55)#597 | 5.3%(-3.05)#24,000 |
| 5. | 23432 | 1.3% | 4.8%(-3.47)#658 | 5.3%(-3.97)#26,374 |
1
Common Questions
What are the Top 5 Zip Codes with the Highest Percentage of Population Employed in Food Preparation & Serving in Suffolk, VA?
Top 5 Zip Codes with the Highest Percentage of Population Employed in Food Preparation & Serving in Suffolk, VA are:
What zip code has the Highest Percentage of Population Employed in Food Preparation & Serving in Suffolk, VA?
23435 has the Highest Percentage of Population Employed in Food Preparation & Serving in Suffolk, VA with 4.3%.
What is the Percentage of Population Employed in Food Preparation & Serving in Suffolk, VA?
Percentage of Population Employed in Food Preparation & Serving in Suffolk is 3.9%.
What is the Percentage of Population Employed in Food Preparation & Serving in Virginia?
Percentage of Population Employed in Food Preparation & Serving in Virginia is 4.8%.
What is the Percentage of Population Employed in Food Preparation & Serving in the United States?
Percentage of Population Employed in Food Preparation & Serving in the United States is 5.3%.