Zip Codes with the Highest Percentage of Population Employed in Food Preparation & Serving in Glen Allen, VA
RELATED REPORTS & OPTIONS
Food Preparation & Serving
Glen Allen
Compare Zip Codes
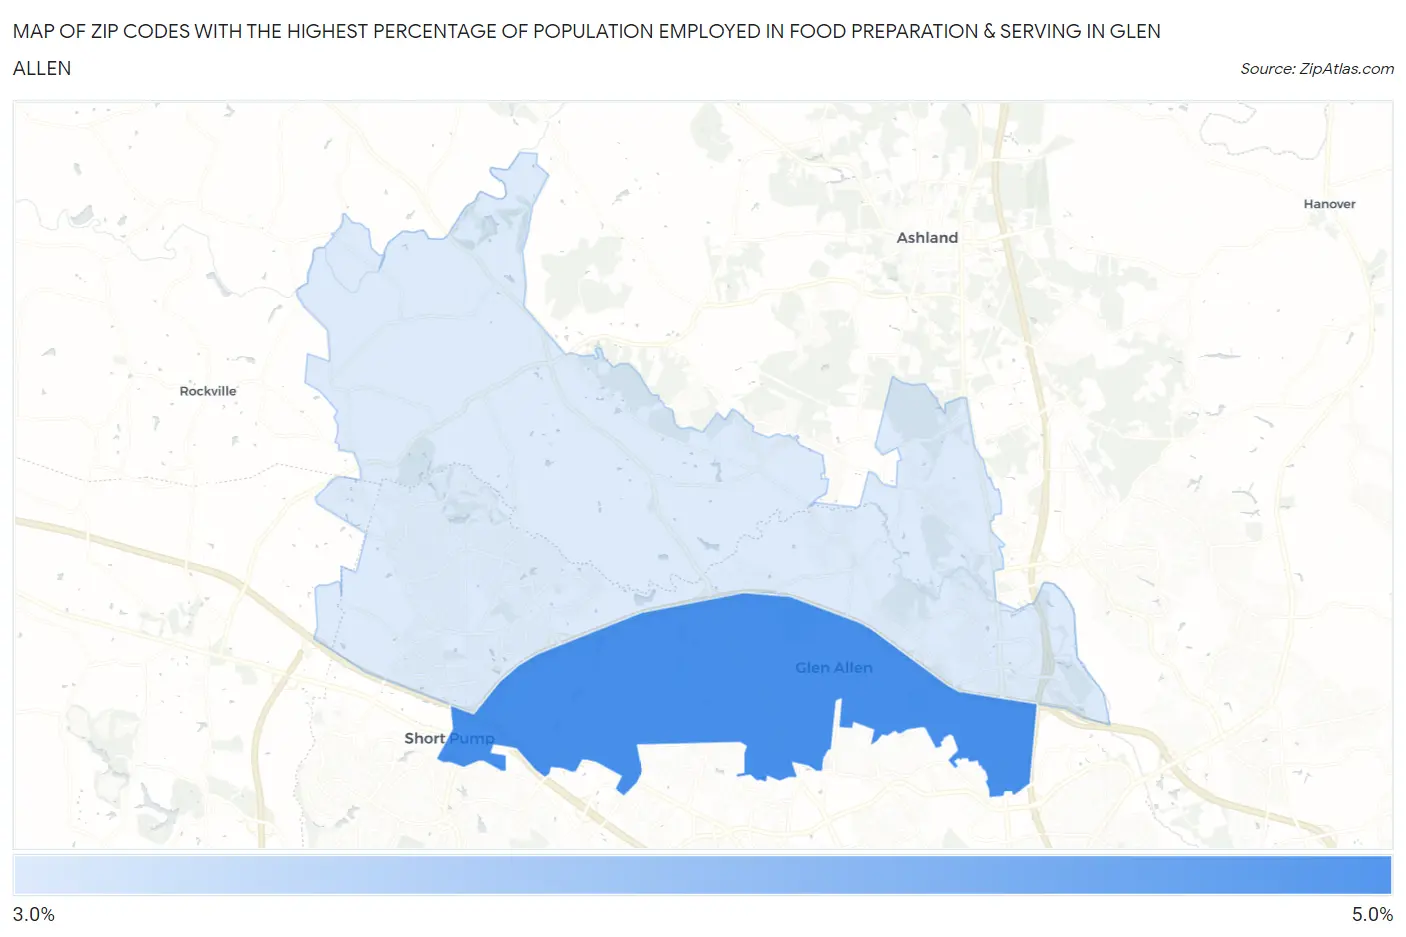
Map of Zip Codes with the Highest Percentage of Population Employed in Food Preparation & Serving in Glen Allen
0.0%
5.0%
Zip Codes with the Highest Percentage of Population Employed in Food Preparation & Serving in Glen Allen, VA
| Zip Code | % Employed | vs State | vs National | |
| 1. | 23060 | 4.1% | 4.8%(-0.637)#386 | 5.3%(-1.14)#16,508 |
| 2. | 23059 | 3.1% | 4.8%(-1.65)#501 | 5.3%(-2.15)#20,742 |
1
Common Questions
What are the Top Zip Codes with the Highest Percentage of Population Employed in Food Preparation & Serving in Glen Allen, VA?
Top Zip Codes with the Highest Percentage of Population Employed in Food Preparation & Serving in Glen Allen, VA are:
What zip code has the Highest Percentage of Population Employed in Food Preparation & Serving in Glen Allen, VA?
23060 has the Highest Percentage of Population Employed in Food Preparation & Serving in Glen Allen, VA with 4.1%.
What is the Percentage of Population Employed in Food Preparation & Serving in Glen Allen, VA?
Percentage of Population Employed in Food Preparation & Serving in Glen Allen is 3.4%.
What is the Percentage of Population Employed in Food Preparation & Serving in Virginia?
Percentage of Population Employed in Food Preparation & Serving in Virginia is 4.8%.
What is the Percentage of Population Employed in Food Preparation & Serving in the United States?
Percentage of Population Employed in Food Preparation & Serving in the United States is 5.3%.